> ## Documentation Index
> Fetch the complete documentation index at: https://braintrust.dev/docs/llms.txt
> Use this file to discover all available pages before exploring further.
# Send application logs
> Send application logs to Braintrust from the Python SDK or OpenTelemetry, then browse, filter, and query them alongside your traces.
export const feature_0 = "Application logs"
export const verb_0 = "are"
Send application logs to Braintrust to inspect events such as retries and payment failures alongside your AI traces. A log doesn't require an LLM call, an agent, or an active trace. When a failure occurs during an agent run, you can inspect both the message and the surrounding model behavior.
Get logs into Braintrust in two ways:
* [Send logs from the Python SDK](#send-logs-from-the-python-sdk), either by emitting messages or by forwarding standard-library `logging` records.
* [Send OpenTelemetry logs](#send-opentelemetry-logs) from any language that exports OTLP.
{feature_0} {verb_0} in [public preview](/docs/feature-lifecycle) and can change before reaching general availability.
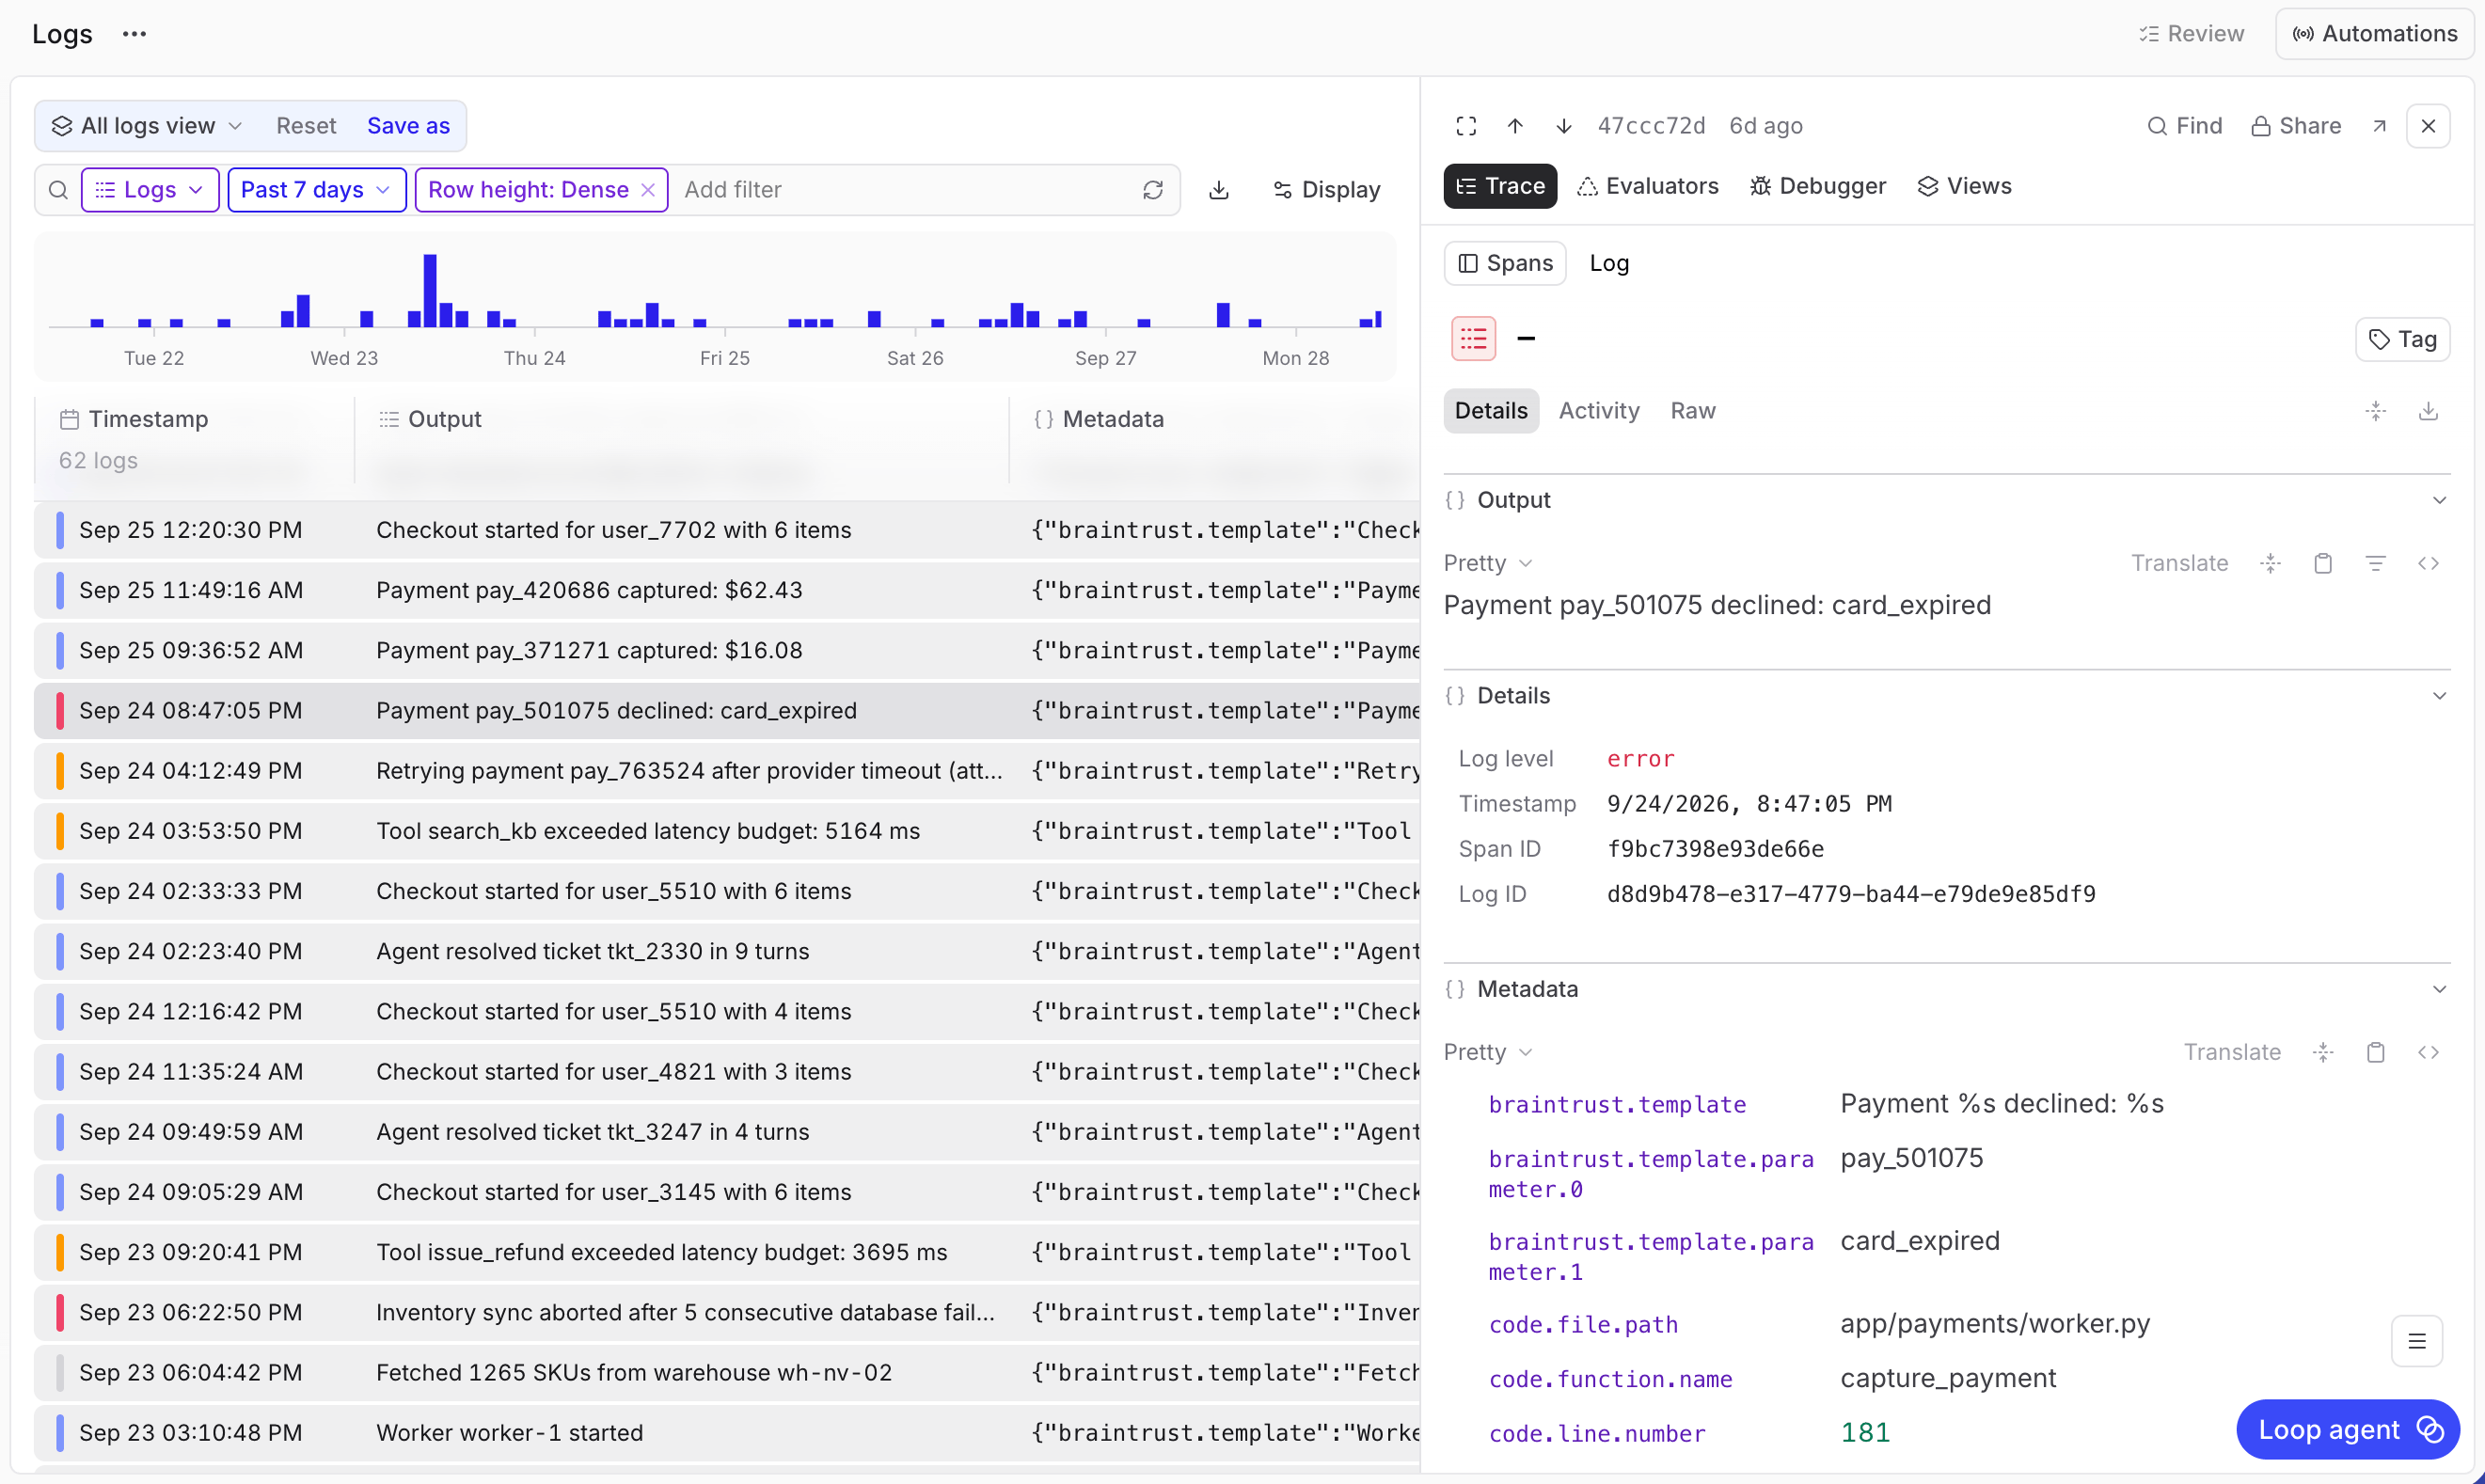 Messages share the fields, queries, filters, and IDs used by spans. A message:
* Records a point in time, with zero duration.
* Has no children.
* Carries a severity level.
Emit a message to record an event. Open a [span](/docs/instrument/trace-application-logic) to time an operation or nest other rows under it.
## Send logs from the Python SDK
To send logs from Python, [emit messages](/docs/sdks/python/application-logs#emit-logs-from-the-sdk) with a project logger's severity methods, such as `info()` and `error()`, or [forward existing records](/docs/sdks/python/application-logs#capture-existing-python-logs) from the standard-library `logging` module with `BraintrustLogHandler`. The guide covers stored fields, message templates, and associating logs with a trace.
## Send OpenTelemetry logs
To forward OpenTelemetry logs, [configure your exporter or Collector](/docs/integrations/sdk-integrations/opentelemetry/send-traces-and-logs#send-logs).
## Inspect logs
The **Logs** row type shows SDK messages, OTLP log records, and OpenTelemetry span events. The **Traces** and **Spans** row types exclude these rows. Log rows don't offer scoring or human review actions.
1. Go to [** Logs**](https://www.braintrust.dev/app/~/logs) in your project. In the toolbar's row type selector, choose **Logs**. This loads **All logs view**, with **Dense** rows and an all-time range.
2. Choose a time range and use the search field to filter messages.
3. Select a message to inspect its contents:
* **Output**: The full message.
* **Details**: Log level, timestamp, span ID, and log ID.
* **Metadata** and **Context**: Additional fields, when present.
To query messages with [SQL](/docs/reference/sql), use the [** SQL sandbox**](https://www.braintrust.dev/app/~/sql), the [`bt sql`](/docs/reference/cli/sql) CLI, or the [API](/docs/reference/sql#api). Filter on `span_attributes.type = 'log'` to select messages, and include a range filter on `created` to bound the query.
```sql Recent messages in a project theme={"theme":{"light":"github-light","dark":"github-dark-dimmed"}}
SELECT created, output, span_attributes.log_level, metadata
FROM project_logs('') -- Replace with your project ID
WHERE span_attributes.type = 'log'
AND created > NOW() - INTERVAL 1 DAY
ORDER BY created DESC
LIMIT 100
```
### Filter by severity
In the **Logs** row type, select the empty search field. It suggests a filter for each severity level, such as `span_attributes.log_level = 'warn'` or `span_attributes.log_level = 'error'`. Choose one to apply it.
Messages share the fields, queries, filters, and IDs used by spans. A message:
* Records a point in time, with zero duration.
* Has no children.
* Carries a severity level.
Emit a message to record an event. Open a [span](/docs/instrument/trace-application-logic) to time an operation or nest other rows under it.
## Send logs from the Python SDK
To send logs from Python, [emit messages](/docs/sdks/python/application-logs#emit-logs-from-the-sdk) with a project logger's severity methods, such as `info()` and `error()`, or [forward existing records](/docs/sdks/python/application-logs#capture-existing-python-logs) from the standard-library `logging` module with `BraintrustLogHandler`. The guide covers stored fields, message templates, and associating logs with a trace.
## Send OpenTelemetry logs
To forward OpenTelemetry logs, [configure your exporter or Collector](/docs/integrations/sdk-integrations/opentelemetry/send-traces-and-logs#send-logs).
## Inspect logs
The **Logs** row type shows SDK messages, OTLP log records, and OpenTelemetry span events. The **Traces** and **Spans** row types exclude these rows. Log rows don't offer scoring or human review actions.
1. Go to [** Logs**](https://www.braintrust.dev/app/~/logs) in your project. In the toolbar's row type selector, choose **Logs**. This loads **All logs view**, with **Dense** rows and an all-time range.
2. Choose a time range and use the search field to filter messages.
3. Select a message to inspect its contents:
* **Output**: The full message.
* **Details**: Log level, timestamp, span ID, and log ID.
* **Metadata** and **Context**: Additional fields, when present.
To query messages with [SQL](/docs/reference/sql), use the [** SQL sandbox**](https://www.braintrust.dev/app/~/sql), the [`bt sql`](/docs/reference/cli/sql) CLI, or the [API](/docs/reference/sql#api). Filter on `span_attributes.type = 'log'` to select messages, and include a range filter on `created` to bound the query.
```sql Recent messages in a project theme={"theme":{"light":"github-light","dark":"github-dark-dimmed"}}
SELECT created, output, span_attributes.log_level, metadata
FROM project_logs('') -- Replace with your project ID
WHERE span_attributes.type = 'log'
AND created > NOW() - INTERVAL 1 DAY
ORDER BY created DESC
LIMIT 100
```
### Filter by severity
In the **Logs** row type, select the empty search field. It suggests a filter for each severity level, such as `span_attributes.log_level = 'warn'` or `span_attributes.log_level = 'error'`. Choose one to apply it.
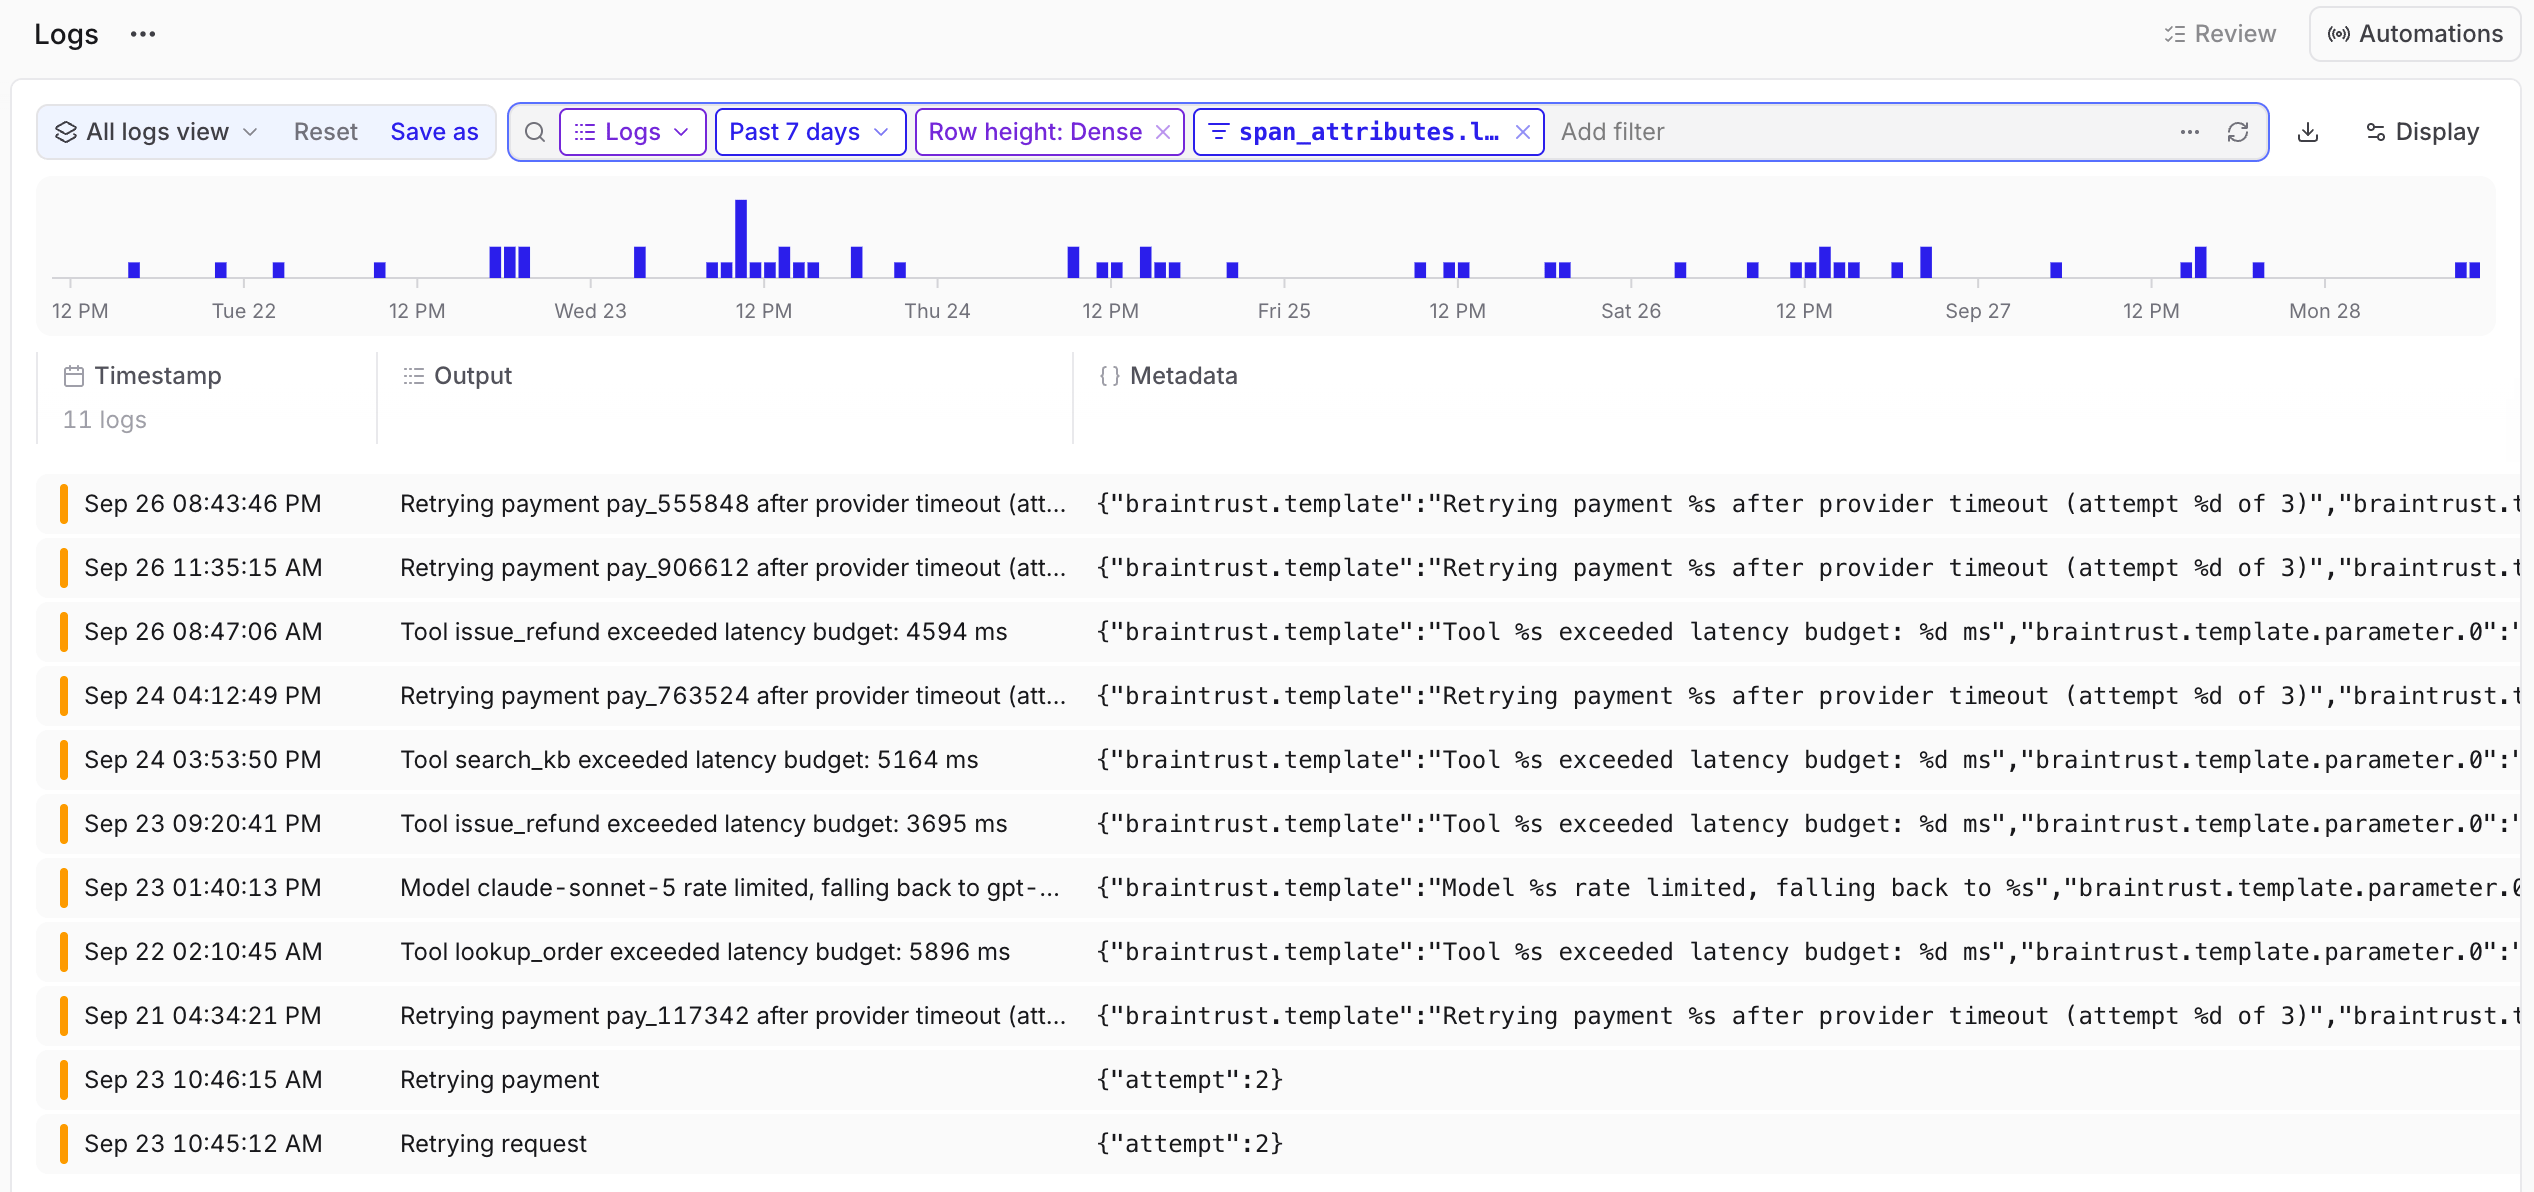 To filter on a message's own level, open the menu beside **Log level** in **Details** and select **Filter by this value**.
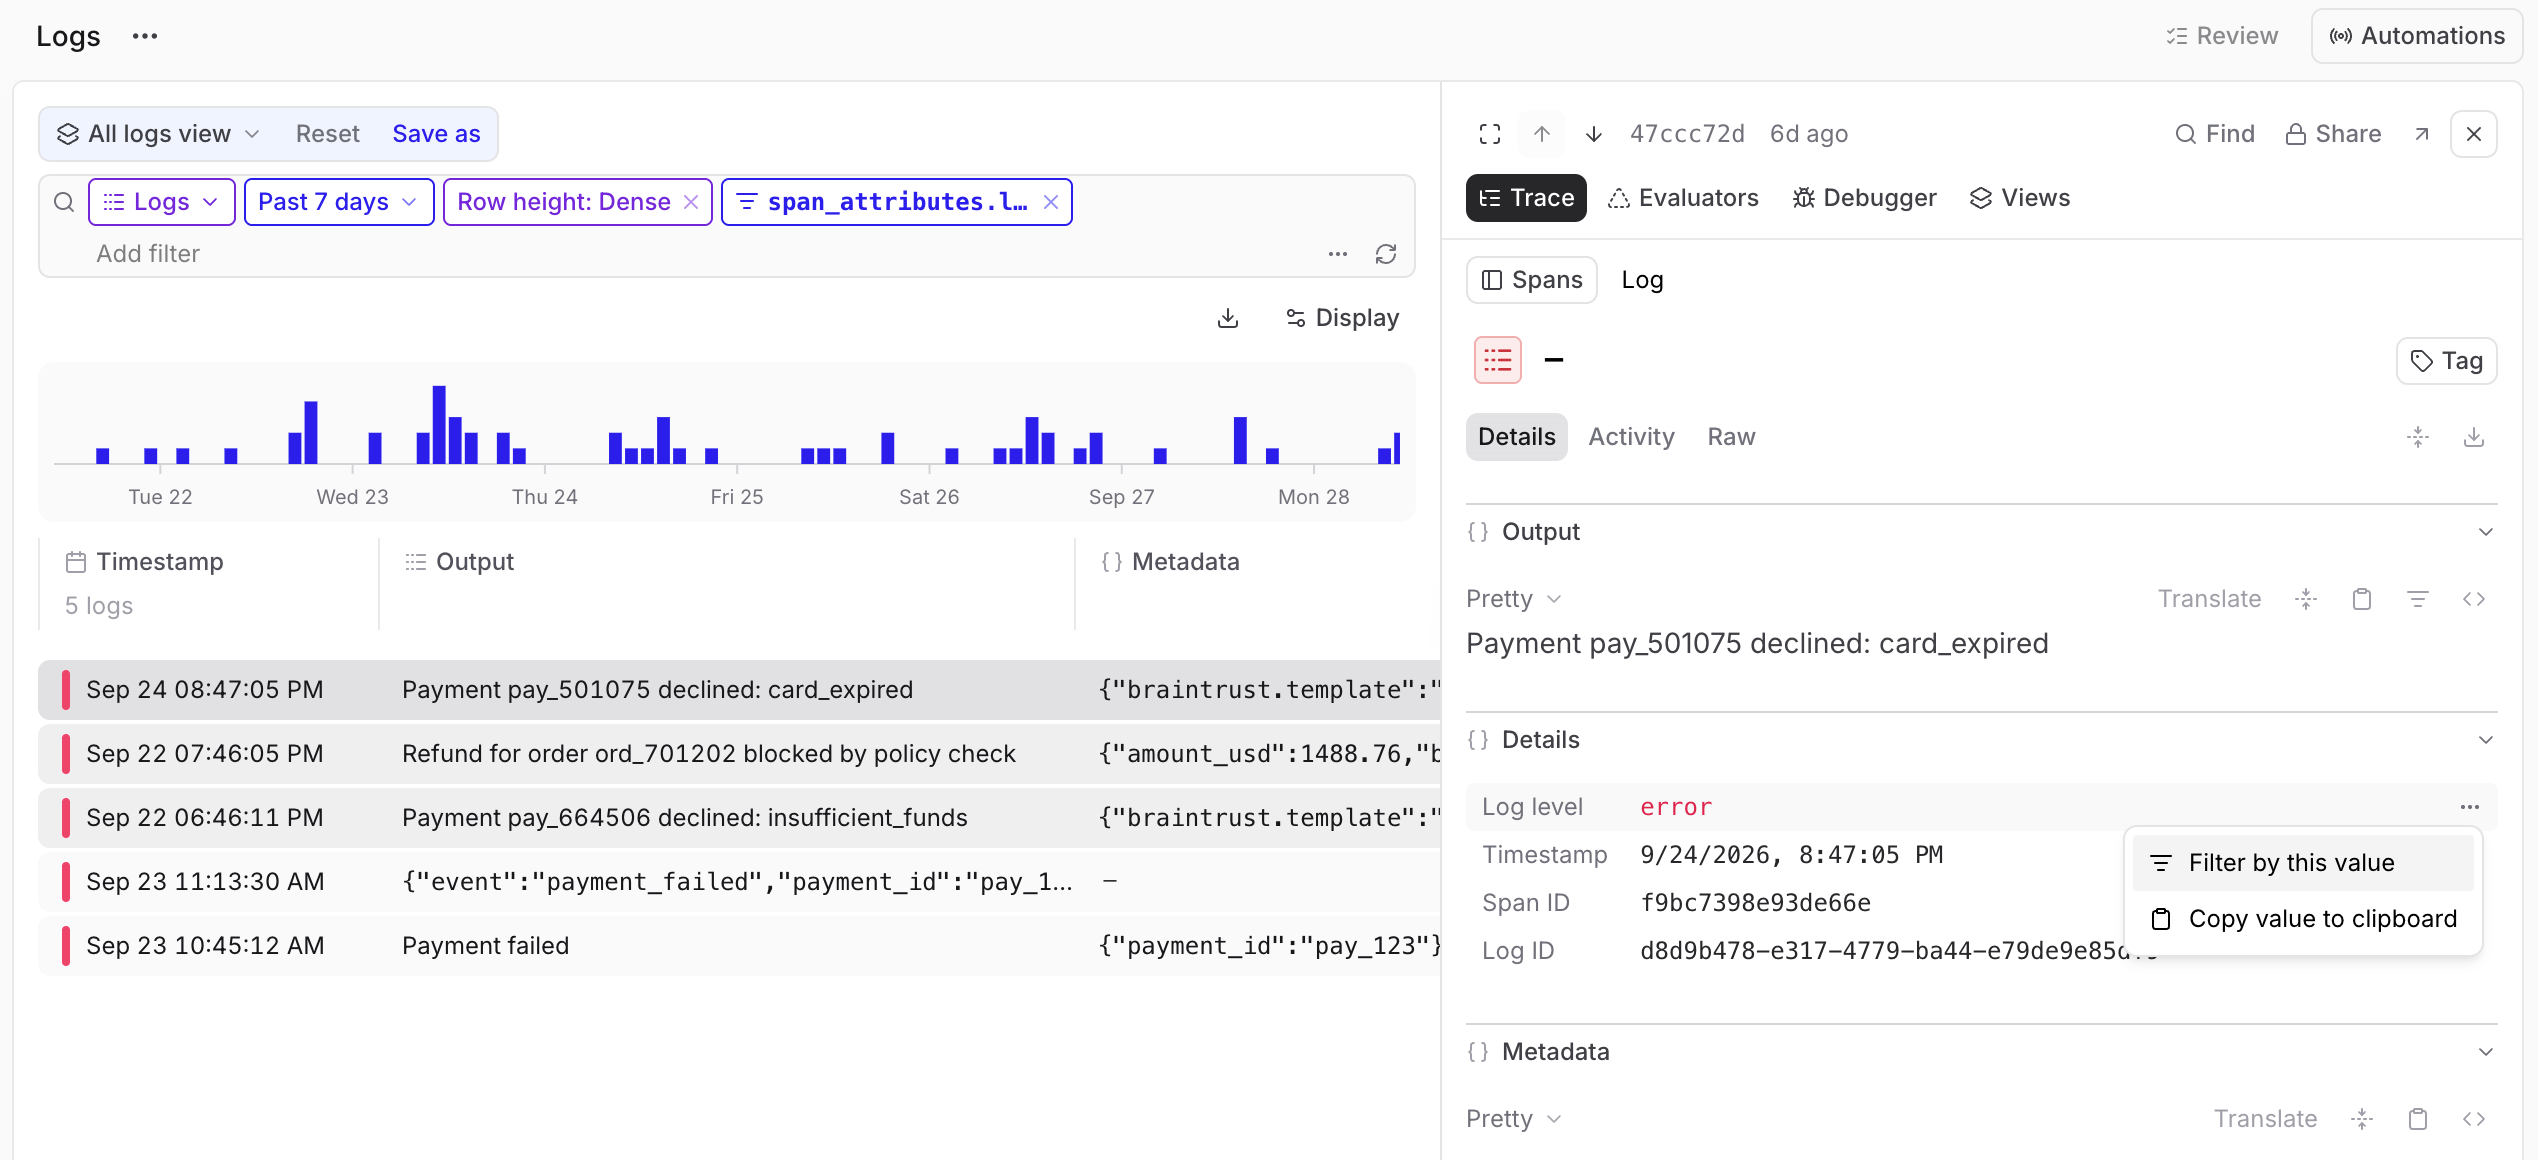 ```sql Error and fatal messages theme={"theme":{"light":"github-light","dark":"github-dark-dimmed"}}
SELECT created, output, error, metadata
FROM project_logs('') -- Replace with your project ID
WHERE span_attributes.type = 'log'
AND span_attributes.log_level IN ('error', 'fatal')
AND created > NOW() - INTERVAL 7 DAY
ORDER BY created DESC
LIMIT 100
```
Messages without a `span_attributes.log_level` value don't match a severity filter.
### View logs in a trace
To inspect a message in context, select it in its trace's hierarchy or **Timeline**. Log icons and timeline markers reflect the recorded severity, when present.
Older messages can lack a preview in the trace hierarchy until you open them. The full message remains available in **Output**.
```sql Error and fatal messages theme={"theme":{"light":"github-light","dark":"github-dark-dimmed"}}
SELECT created, output, error, metadata
FROM project_logs('') -- Replace with your project ID
WHERE span_attributes.type = 'log'
AND span_attributes.log_level IN ('error', 'fatal')
AND created > NOW() - INTERVAL 7 DAY
ORDER BY created DESC
LIMIT 100
```
Messages without a `span_attributes.log_level` value don't match a severity filter.
### View logs in a trace
To inspect a message in context, select it in its trace's hierarchy or **Timeline**. Log icons and timeline markers reflect the recorded severity, when present.
Older messages can lack a preview in the trace hierarchy until you open them. The full message remains available in **Output**.
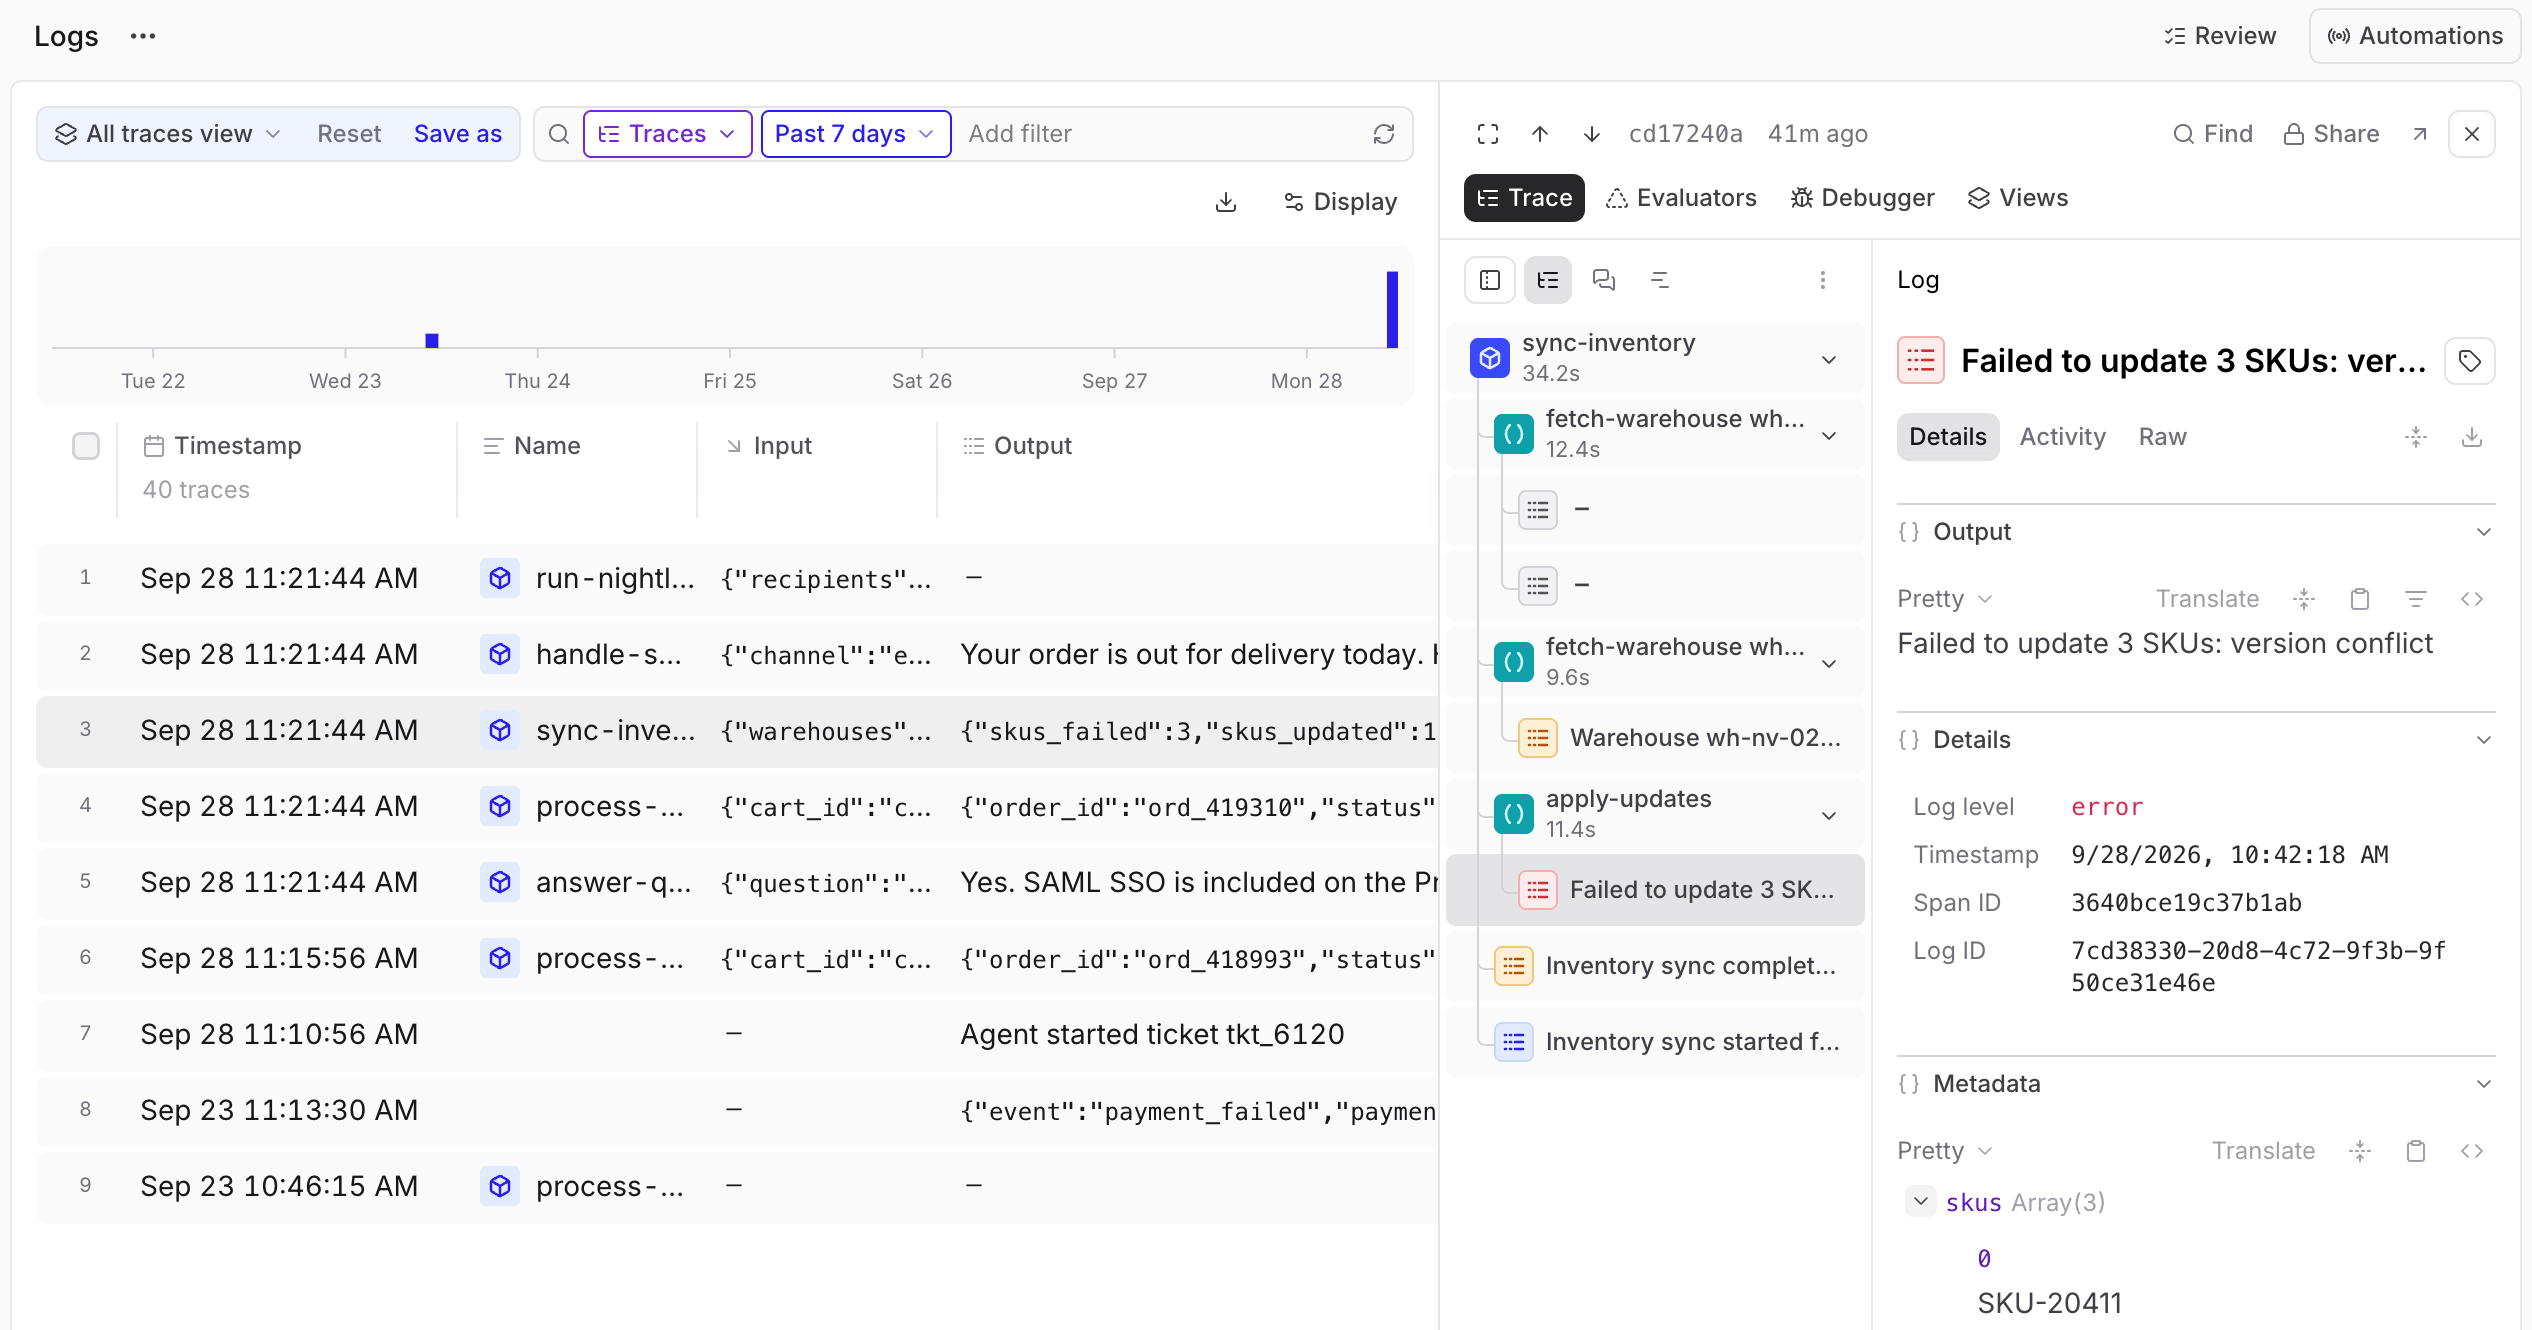 ```sql Messages emitted during one trace theme={"theme":{"light":"github-light","dark":"github-dark-dimmed"}}
SELECT created, output, span_attributes.log_level, span_id
FROM project_logs('') -- Replace with your project ID
WHERE span_attributes.type = 'log'
AND root_span_id = '' -- Replace with the trace's root span ID
ORDER BY created
```
## Next steps
* [Filter and search](/docs/observe/filter) to find records from a specific operation.
* [Examine traces](/docs/observe/examine-traces) to inspect the operations surrounding a message.
* [Send logs from the Python SDK](/docs/sdks/python/application-logs) to emit messages or forward `logging` records.
* [Configure OpenTelemetry](/docs/integrations/sdk-integrations/opentelemetry/send-traces-and-logs) to connect existing instrumentation to Braintrust.
```sql Messages emitted during one trace theme={"theme":{"light":"github-light","dark":"github-dark-dimmed"}}
SELECT created, output, span_attributes.log_level, span_id
FROM project_logs('') -- Replace with your project ID
WHERE span_attributes.type = 'log'
AND root_span_id = '' -- Replace with the trace's root span ID
ORDER BY created
```
## Next steps
* [Filter and search](/docs/observe/filter) to find records from a specific operation.
* [Examine traces](/docs/observe/examine-traces) to inspect the operations surrounding a message.
* [Send logs from the Python SDK](/docs/sdks/python/application-logs) to emit messages or forward `logging` records.
* [Configure OpenTelemetry](/docs/integrations/sdk-integrations/opentelemetry/send-traces-and-logs) to connect existing instrumentation to Braintrust.