> ## Documentation Index
> Fetch the complete documentation index at: https://braintrust.dev/docs/llms.txt
> Use this file to discover all available pages before exploring further.
# Coding Agent Insights dashboard
> Track your team's coding-agent costs, model and tool usage, and activity by user, API key, and branch, and see who is sending traces.
export const version_0 = "v2.13.0+"
export const feature_0 = "Coding Agent Insights"
export const verb_0 = "is"
{feature_0} {verb_0} in [public preview](/docs/feature-lifecycle) and can change before reaching general availability.
The Coding Agent Insights dashboard shows your team's coding-agent usage, estimated costs, and trace coverage. The [Coding Agent Insights cookbook](/docs/cookbook/recipes/CodingAgentInsights) sets up tracing and a daily Loop automation that identifies recurring problems.
## Requirements
To show data, the dashboard needs:
* **Coding-agent traces** sent by the `bt` tracing integration for Claude Code, Codex, OpenCode, Pi, Antigravity, or Grok.
* **A dedicated project.** The dashboard counts model and tool calls from every trace in the project, including traces logged with a Braintrust SDK, so keep coding-agent traces in a project of their own.
Requires data plane {version_0}
## Open the dashboard
Go to [** Dashboards**](https://www.braintrust.dev/app/~/dashboards) in the project that receives your coding-agent traces, and select **Coding agent insights**.
**Coding agent insights** is a built-in dashboard, like **Cost and quality**. It's read-only, so you can't add or edit its charts the way you can on a dashboard you [create](/docs/observe/dashboards/create). You can star it like other dashboards. See [Browse dashboards](/docs/observe/dashboards#browse-dashboards).
 ## What the dashboard shows
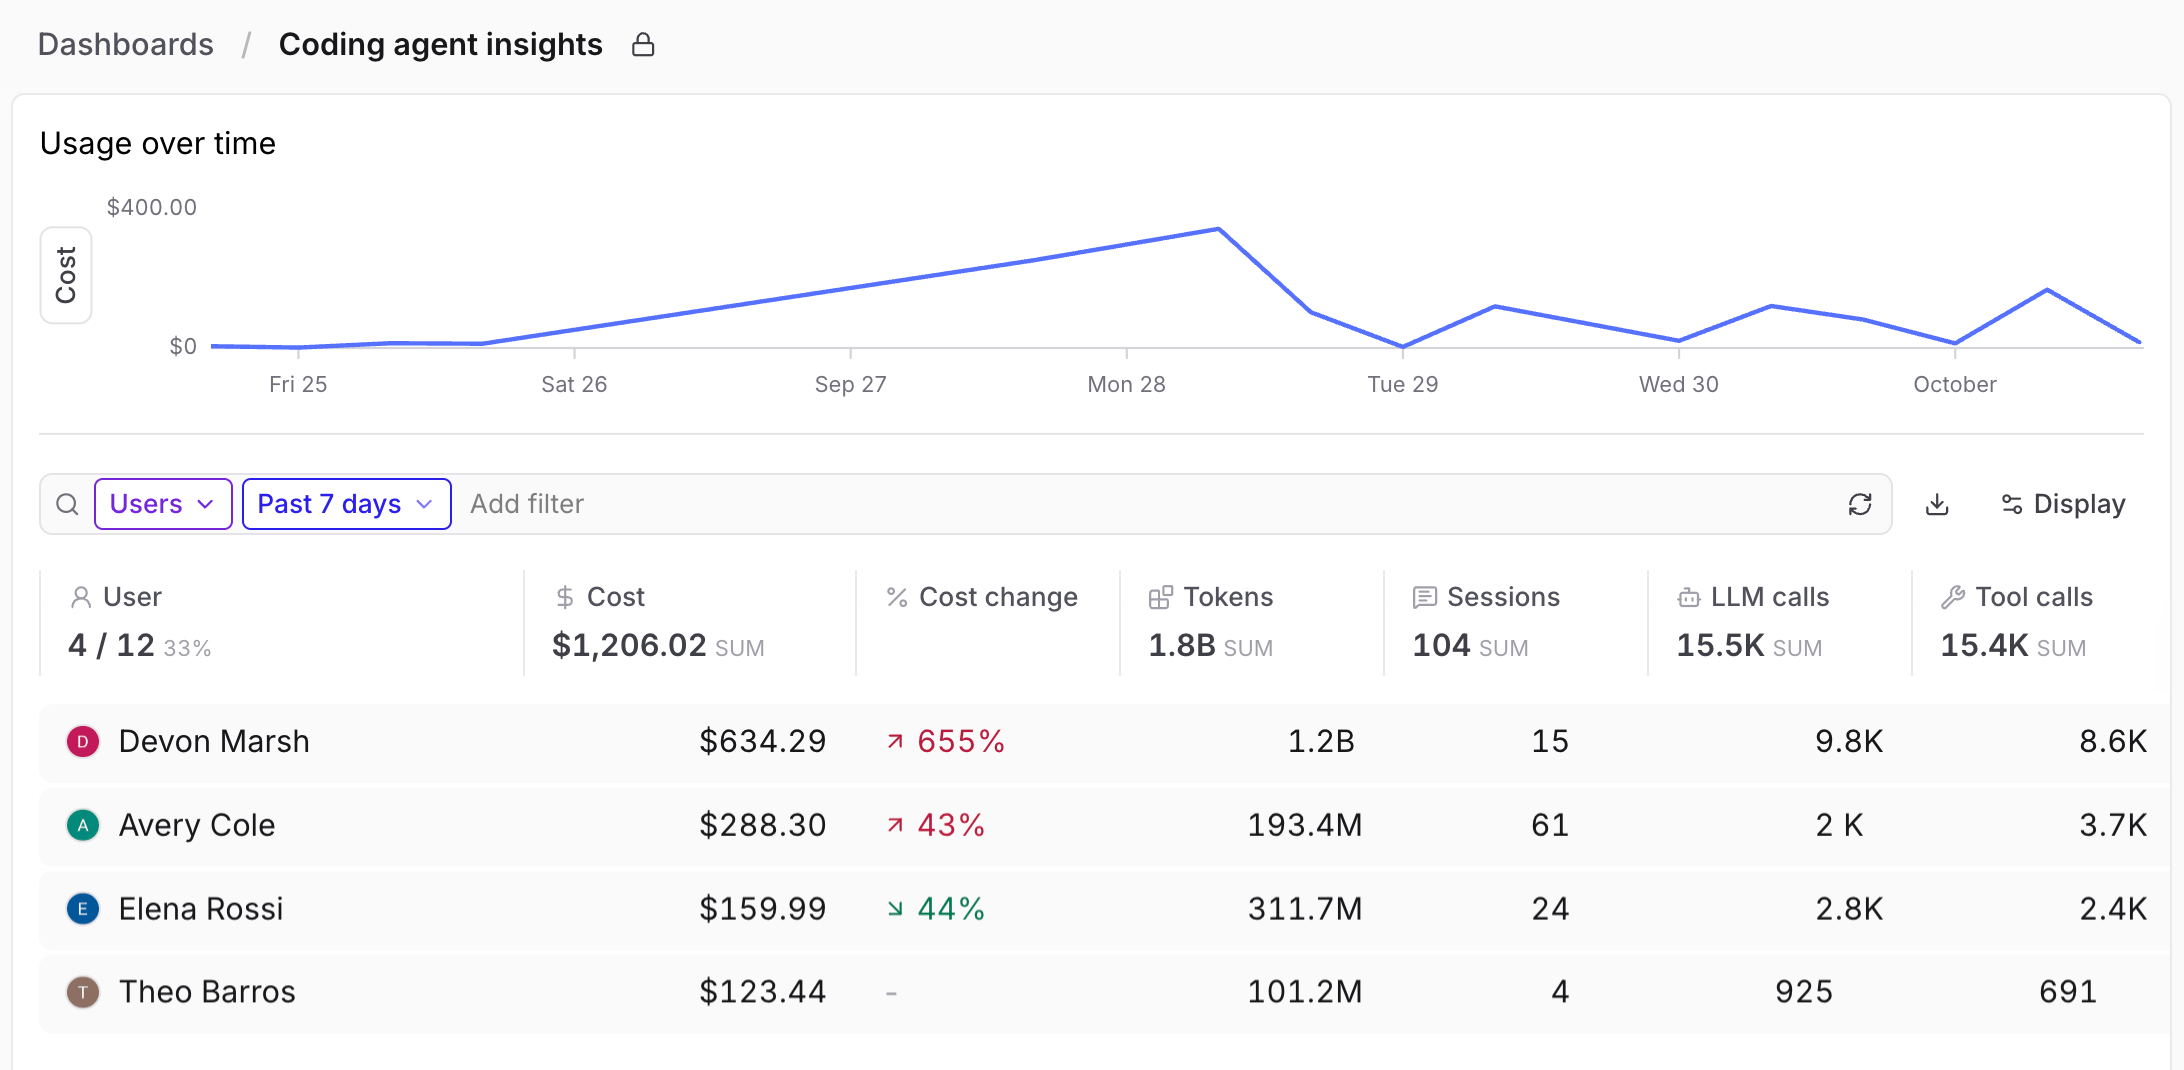
The dashboard answers three kinds of questions about your team's coding-agent work:
* **Who is sending traces.** The dashboard shows which teammates have recorded model calls matching the selected period and filters.
* **How agents are used.** The dashboard shows how many sessions, model calls, and tool calls your team's agents make, and which models and tools they use.
* **Where cost goes.** The dashboard breaks down cost by person, model, and branch. For traces sent with an API key or service token instead of an OAuth login, it can also break cost down by key. **Users** and **Keys** also show cost changes from the previous period.
Braintrust calculates cost from each model call's token counts and the model's pricing. If a span reports its own cost in `metrics.estimated_cost`, Braintrust uses that instead.
A **Usage over time** chart at the top shows cost across the selected period. To plot token counts instead, click **Cost** beside the chart and select **Tokens**.
Below the chart, a table summarizes usage for the period. The time range selector in the table toolbar, such as **Past 7 days**, sets the period for both the chart and the table. **Add filter** narrows both to a subset of traces.
## Group the table
The table shows one grouping at a time. To change it, use the grouping selector in the table toolbar, which shows **Users** by default.
## What the dashboard shows
The dashboard answers three kinds of questions about your team's coding-agent work:
* **Who is sending traces.** The dashboard shows which teammates have recorded model calls matching the selected period and filters.
* **How agents are used.** The dashboard shows how many sessions, model calls, and tool calls your team's agents make, and which models and tools they use.
* **Where cost goes.** The dashboard breaks down cost by person, model, and branch. For traces sent with an API key or service token instead of an OAuth login, it can also break cost down by key. **Users** and **Keys** also show cost changes from the previous period.
Braintrust calculates cost from each model call's token counts and the model's pricing. If a span reports its own cost in `metrics.estimated_cost`, Braintrust uses that instead.
A **Usage over time** chart at the top shows cost across the selected period. To plot token counts instead, click **Cost** beside the chart and select **Tokens**.
Below the chart, a table summarizes usage for the period. The time range selector in the table toolbar, such as **Past 7 days**, sets the period for both the chart and the table. **Add filter** narrows both to a subset of traces.
## Group the table
The table shows one grouping at a time. To change it, use the grouping selector in the table toolbar, which shows **Users** by default.
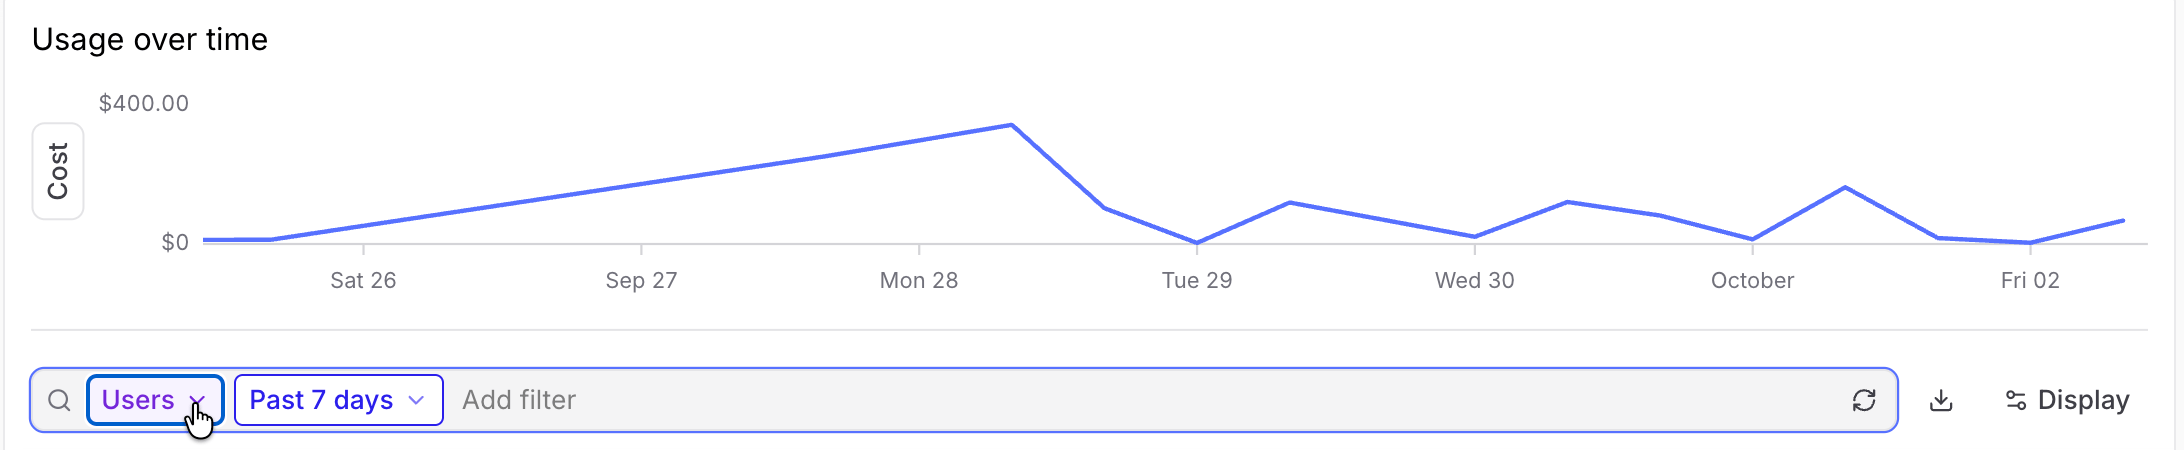 Each grouping changes what a row represents and which columns appear:
| Grouping | Each row is | Use it to see |
| - | - | - |
| **Users** | A member of your organization | Who is spending, and how each person's cost changed from the previous period |
| **Keys** | An API key or service token, shown by name | What each key cost. Traces sent through an OAuth login have no key, so they don't appear here. |
| **Models** | A model | Your team's model mix, cost per million tokens, and how much of each model's input came from cache |
| **Tools** | A tool that agents called | Which tools agents use most. This grouping has no cost columns. |
| **Branches** | A git branch | Which work cost the most, and the latest trace on each branch |
### See who is sending traces
In the **Users** grouping, the **User** column header shows how many organization members are sending traces, such as `4 / 12`. For more detail, click the count to open the **User trace coverage** display, which lists who is **Sending traces** and who is **Not sending traces**.
A member counts as sending traces if they have model calls in the selected period that match the current filters. Service accounts aren't counted.
The dashboard attributes each session to the Braintrust user whose credentials sent it. If teammates share one API key, all of their sessions appear under the key's owner. To keep per-person usage accurate, have each teammate use their own credentials: their own [OAuth login](/docs/cookbook/recipes/CodingAgentInsights#3-configure-your-coding-agents) or their own API key.
## Investigate a row
To see the traces behind a row, click the row. [** Logs**](https://www.braintrust.dev/app/~/logs) opens, filtered to that row's user, key, model, tool, or branch, and to the dashboard's period and filters. To open Logs in a new tab instead, hold Cmd or Ctrl while you click.
To ask [Loop](/docs/loop) about a row instead, hover over the row's name until the Loop icon appears, then click it. Loop opens with a prompt about that user, key, model, tool, or branch.
## When the dashboard is empty
Until the project has coding-agent traces, the dashboard shows a setup screen instead of data. It includes a command for enabling tracing in your coding agent and a link to the [Coding Agent Insights cookbook](/docs/cookbook/recipes/CodingAgentInsights). The dashboard appears as soon as the first trace arrives.
## Protect sensitive data
Coding-agent traces can contain source code, file paths, prompts, command output, and any credentials that appear during a session. Braintrust supports two ways to keep sensitive data out of stored traces, and you can use them together:
* [Ingestion redaction](/docs/admin/data-management/protect-sensitive-data#redact-during-ingestion) (private preview) replaces detected sensitive text before storage. Model-based detection can miss values.
* [Span plugins](/docs/reference/cli/trace#transform-spans-with-javascript) remove values on each computer before `bt` sends them, so those values never reach Braintrust. Span plugins require `bt` v0.21.0 or later.
## Next steps
* Set up tracing and recurring problem detection for your team with the [Coding Agent Insights cookbook](/docs/cookbook/recipes/CodingAgentInsights).
* Learn how to [review and act on patterns](/docs/observe/patterns/review).
* Read about [built-in and custom dashboards](/docs/observe/dashboards).
* Enable tracing for each coding agent with [`bt trace enable`](/docs/reference/cli/trace#bt-trace-enable).
This documentation is built and hosted on [Mintlify](https://mintlify.com), a developer documentation platform.
Each grouping changes what a row represents and which columns appear:
| Grouping | Each row is | Use it to see |
| - | - | - |
| **Users** | A member of your organization | Who is spending, and how each person's cost changed from the previous period |
| **Keys** | An API key or service token, shown by name | What each key cost. Traces sent through an OAuth login have no key, so they don't appear here. |
| **Models** | A model | Your team's model mix, cost per million tokens, and how much of each model's input came from cache |
| **Tools** | A tool that agents called | Which tools agents use most. This grouping has no cost columns. |
| **Branches** | A git branch | Which work cost the most, and the latest trace on each branch |
### See who is sending traces
In the **Users** grouping, the **User** column header shows how many organization members are sending traces, such as `4 / 12`. For more detail, click the count to open the **User trace coverage** display, which lists who is **Sending traces** and who is **Not sending traces**.
A member counts as sending traces if they have model calls in the selected period that match the current filters. Service accounts aren't counted.
The dashboard attributes each session to the Braintrust user whose credentials sent it. If teammates share one API key, all of their sessions appear under the key's owner. To keep per-person usage accurate, have each teammate use their own credentials: their own [OAuth login](/docs/cookbook/recipes/CodingAgentInsights#3-configure-your-coding-agents) or their own API key.
## Investigate a row
To see the traces behind a row, click the row. [** Logs**](https://www.braintrust.dev/app/~/logs) opens, filtered to that row's user, key, model, tool, or branch, and to the dashboard's period and filters. To open Logs in a new tab instead, hold Cmd or Ctrl while you click.
To ask [Loop](/docs/loop) about a row instead, hover over the row's name until the Loop icon appears, then click it. Loop opens with a prompt about that user, key, model, tool, or branch.
## When the dashboard is empty
Until the project has coding-agent traces, the dashboard shows a setup screen instead of data. It includes a command for enabling tracing in your coding agent and a link to the [Coding Agent Insights cookbook](/docs/cookbook/recipes/CodingAgentInsights). The dashboard appears as soon as the first trace arrives.
## Protect sensitive data
Coding-agent traces can contain source code, file paths, prompts, command output, and any credentials that appear during a session. Braintrust supports two ways to keep sensitive data out of stored traces, and you can use them together:
* [Ingestion redaction](/docs/admin/data-management/protect-sensitive-data#redact-during-ingestion) (private preview) replaces detected sensitive text before storage. Model-based detection can miss values.
* [Span plugins](/docs/reference/cli/trace#transform-spans-with-javascript) remove values on each computer before `bt` sends them, so those values never reach Braintrust. Span plugins require `bt` v0.21.0 or later.
## Next steps
* Set up tracing and recurring problem detection for your team with the [Coding Agent Insights cookbook](/docs/cookbook/recipes/CodingAgentInsights).
* Learn how to [review and act on patterns](/docs/observe/patterns/review).
* Read about [built-in and custom dashboards](/docs/observe/dashboards).
* Enable tracing for each coding agent with [`bt trace enable`](/docs/reference/cli/trace#bt-trace-enable).
This documentation is built and hosted on [Mintlify](https://mintlify.com), a developer documentation platform.