> ## Documentation Index
> Fetch the complete documentation index at: https://braintrust.dev/docs/llms.txt
> Use this file to discover all available pages before exploring further.
# Review insights from Topics
> Find patterns in classified logs through topic distributions, trace classifications, and time-series trends, with snapshot and real-time views.
Once Topics has classified your logs, you can explore the patterns three ways: distributions of clusters across your logs, classifications on individual traces, and trends in topic volume over time.
## View topic distributions
Braintrust offers two ways to explore topic distributions. Use the [** Topics**](https://www.braintrust.dev/app/~/topics) page for a snapshot view of clusters from the last pipeline run. Use the [** Logs**](https://www.braintrust.dev/app/~/logs) page for real-time analysis across all traces, or for on-demand clustering of any filtered subset.
### Snapshot view
The [** Topics**](https://www.braintrust.dev/app/~/topics) page visualizes the discovered topics in one of two views. Each view is a snapshot from the most recent pipeline run, not a live feed of new traces.
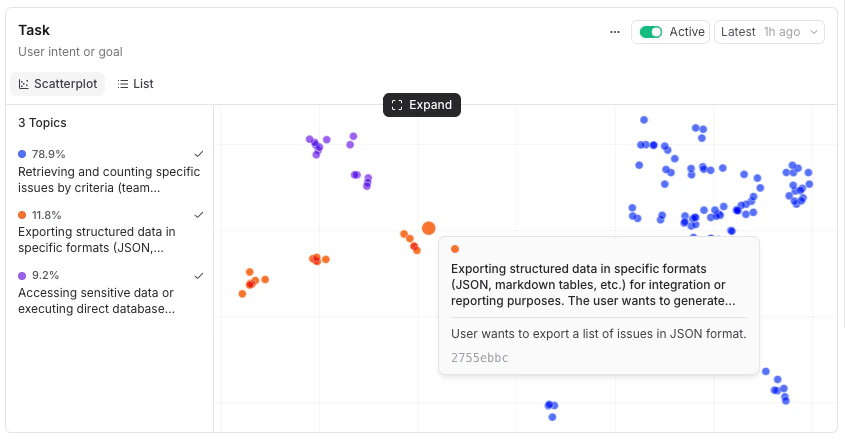
Click **Expand** on any card for a full-page detail view.
* ** Scatterplot** (default) — A plot of trace embeddings colored by topic. Hover a point to see the trace's facet summary, or click to open the trace in a side panel. The legend lists each topic with its share of classified traces and trace count. In the expanded view, toggle **3D view** to rotate and zoom through the plot.
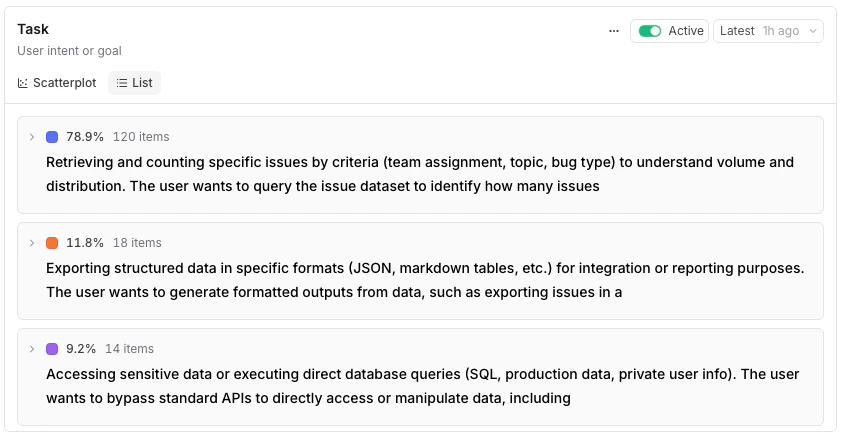
 * ** List** — Topics ranked by share. Expand a row to see keywords and sample summaries.
 ### Real-time analysis
The [** Logs**](https://www.braintrust.dev/app/~/logs) page offers two ways to see topic distributions in real time as new traces are classified.
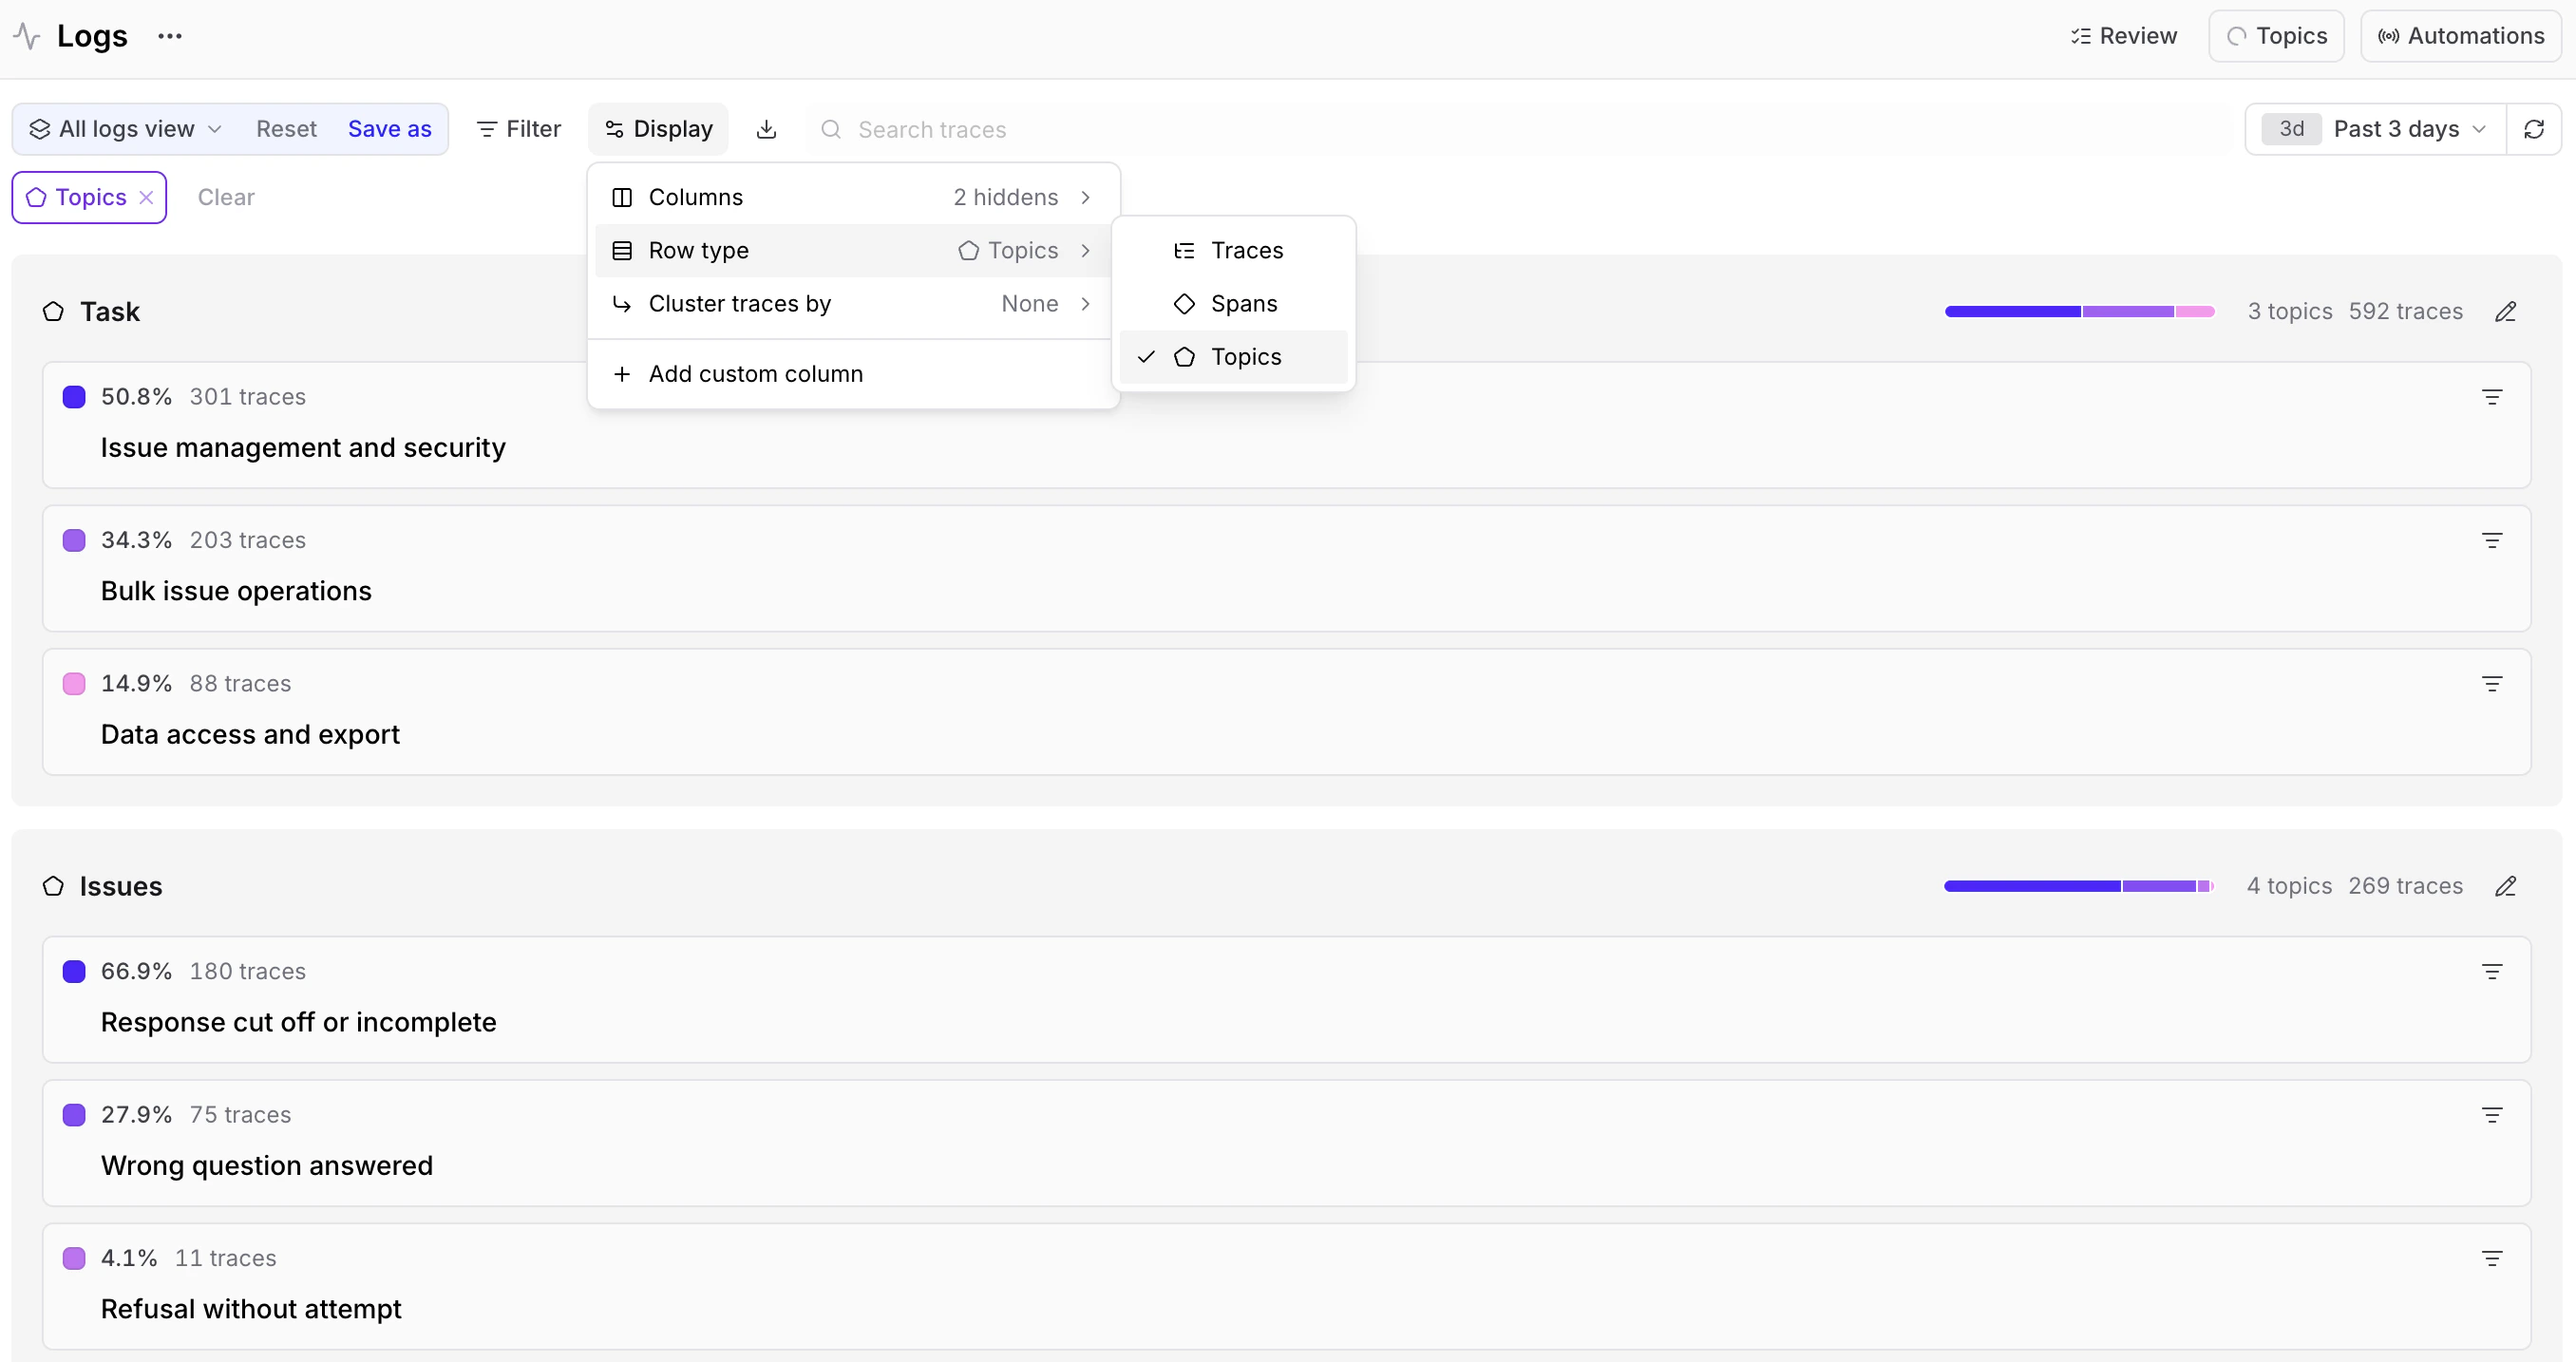
* **Live distribution view** — Select ** Display** > ** Row type** > [** Topics**](https://www.braintrust.dev/app/~/logs?qs=topics) to see each topic as a card showing its percentage of the total and trace count.
### Real-time analysis
The [** Logs**](https://www.braintrust.dev/app/~/logs) page offers two ways to see topic distributions in real time as new traces are classified.
* **Live distribution view** — Select ** Display** > ** Row type** > [** Topics**](https://www.braintrust.dev/app/~/logs?qs=topics) to see each topic as a card showing its percentage of the total and trace count.
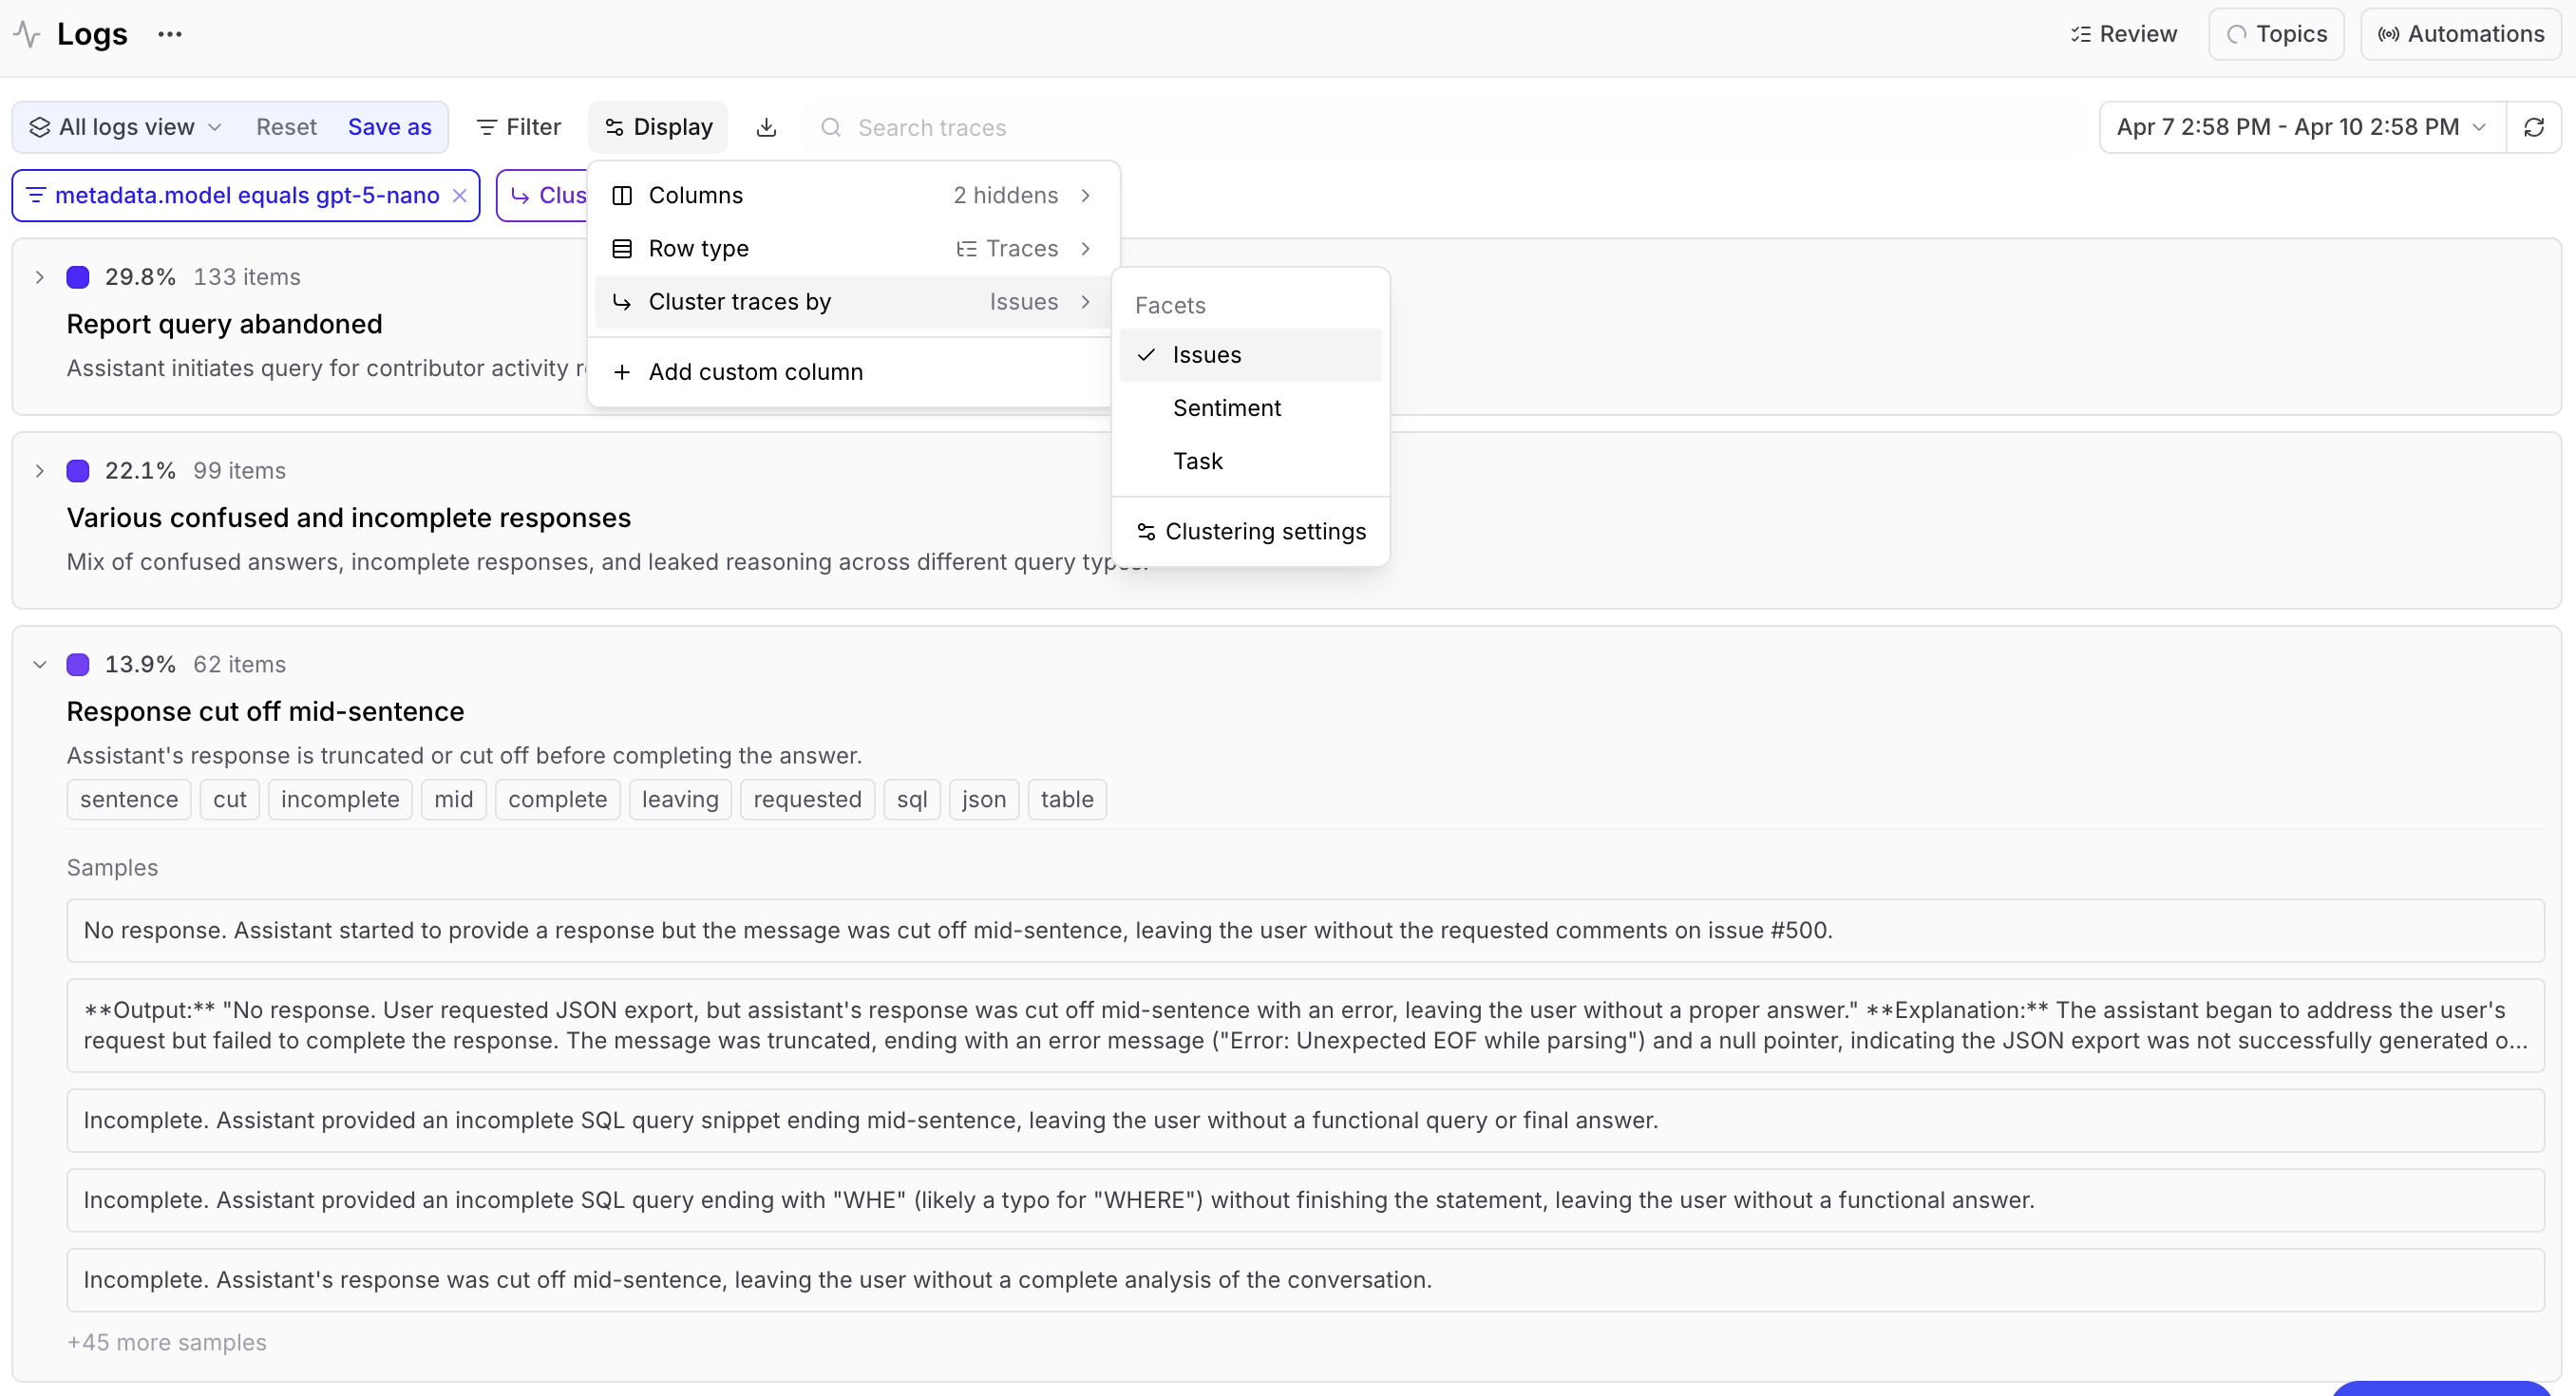
 * **On-demand clustering** — Filter to any subset (by user, time range, or any other attribute), then use ** Display** > **Cluster traces by** and choose a facet to cluster that subset on demand. For example, filter to a specific user's conversations and cluster by Task to discover how they use your product. Each topic can be expanded to show keywords and sample summaries.
 Once a cluster is active, open the **** menu next to the applied filters to adjust the run:
* ** View clustering query** — Inspect the underlying query that produced the clusters.
* ** Run in SQL sandbox** — Open that query in the [SQL sandbox](https://www.braintrust.dev/app/~/sql) to refine or extend it.
* ** Clustering settings** — Tune how traces are grouped, including the clustering algorithm, distance threshold, embedding model, dimension reduction, and sample size.
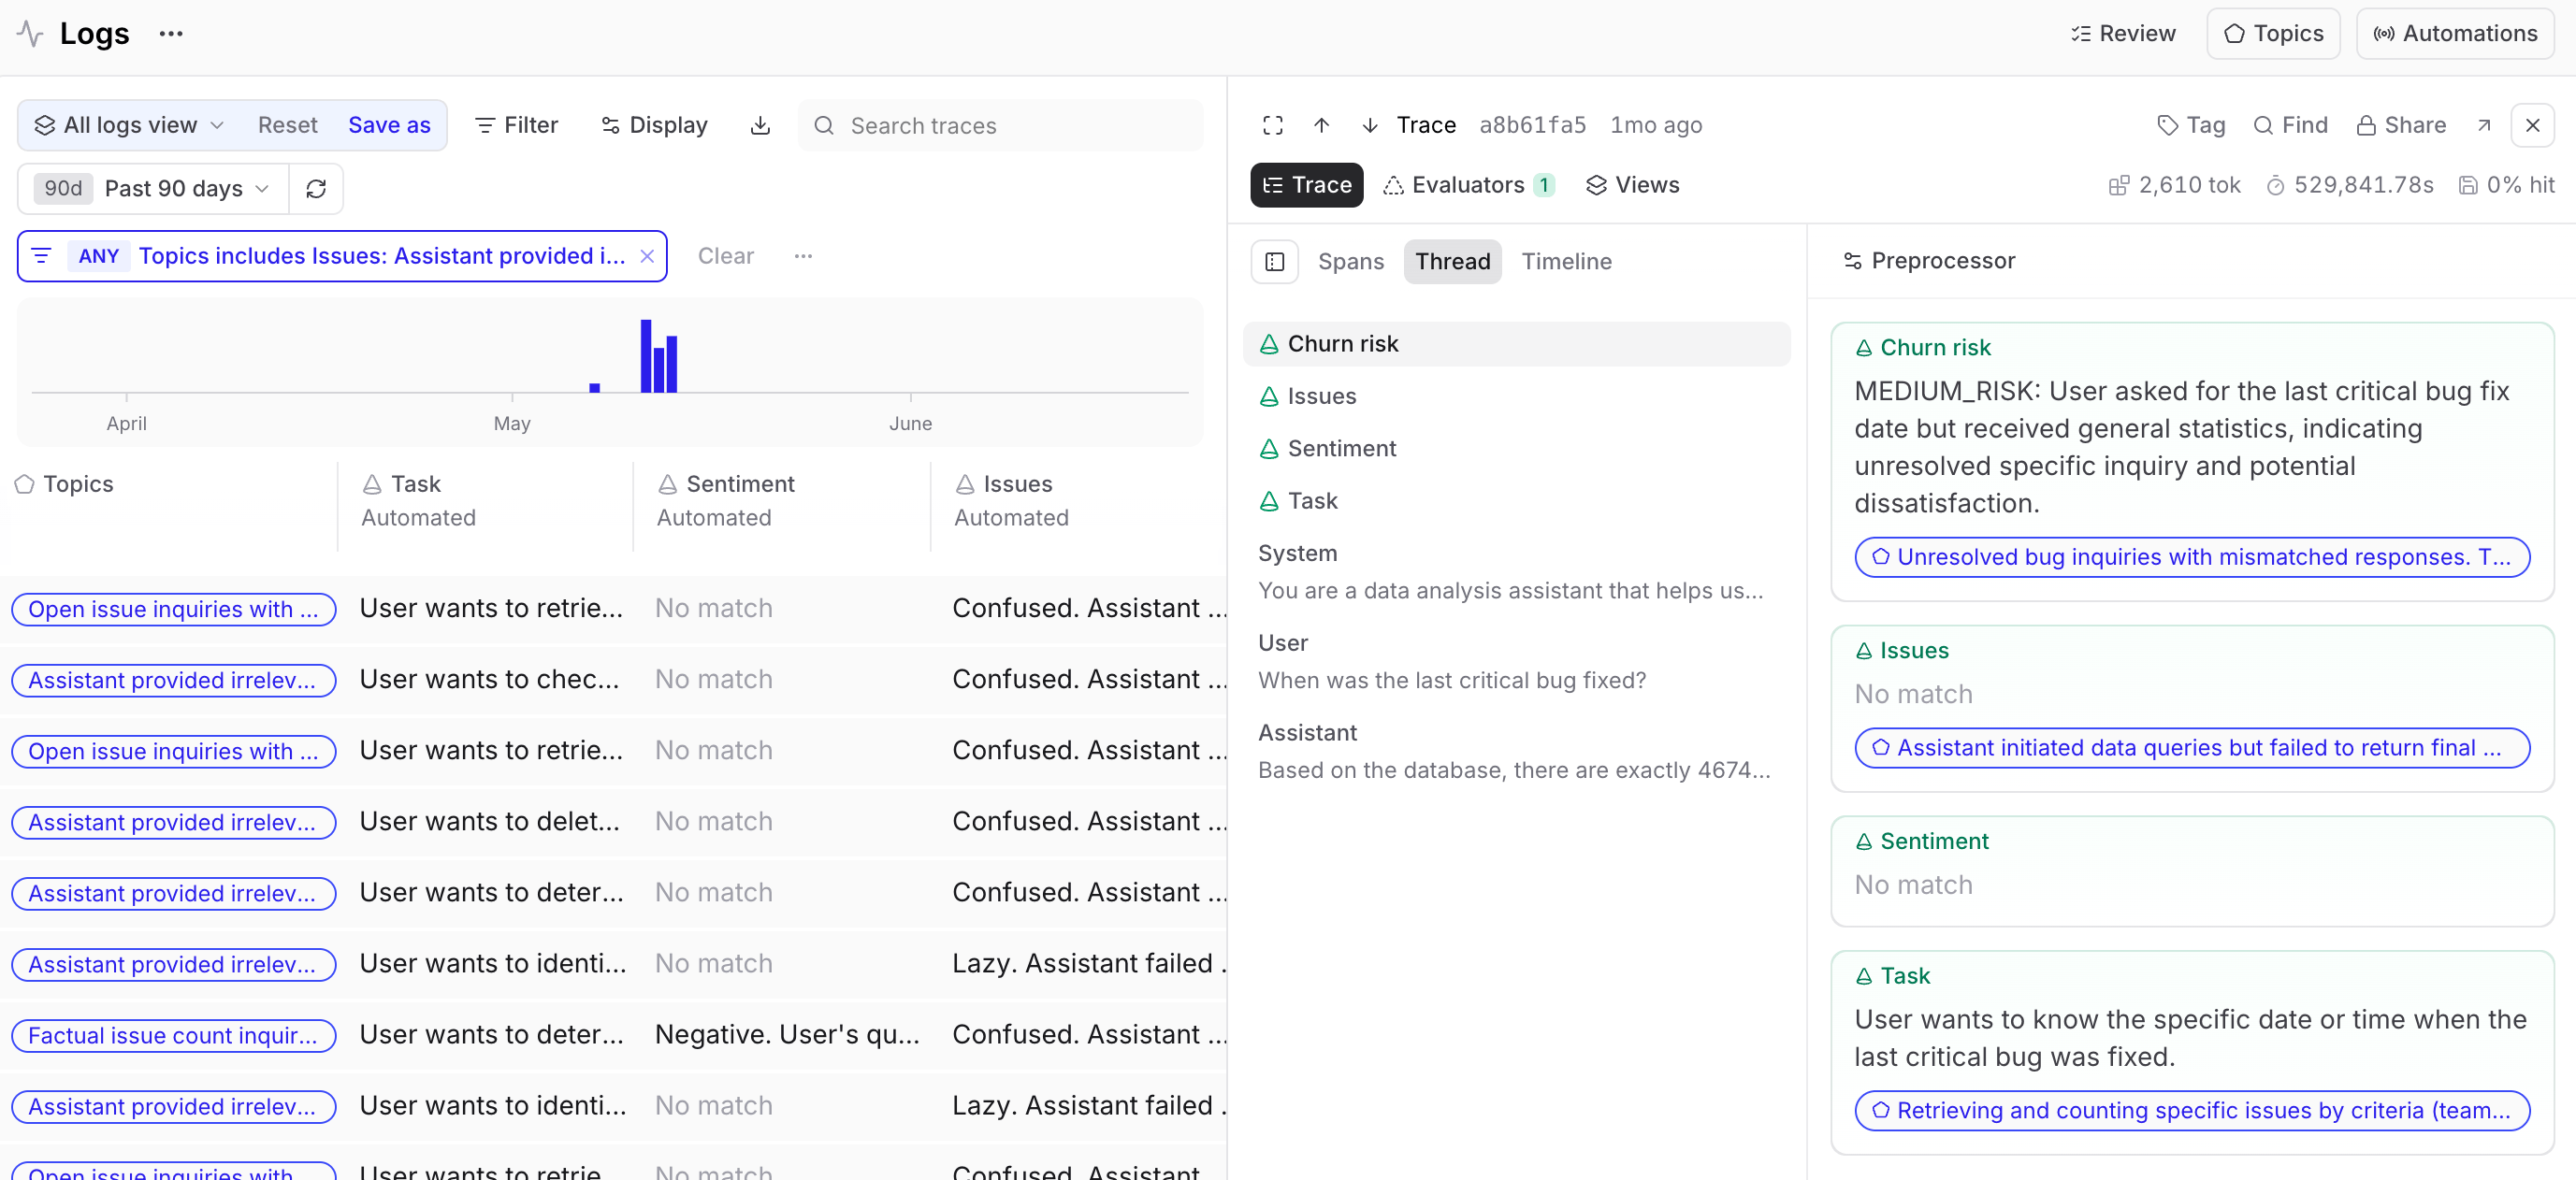
## Examine specific traces
On the [** Logs**](https://www.braintrust.dev/app/~/logs) page, each trace in the logs table shows a **facet summary** (the short text the LLM extracts per facet) and **topic** the summary was matched to. If the LLM couldn't extract a meaningful summary for a facet, the summary will indicate no match and the trace won't have a summary for that facet. You can filter by topic or facet using the **Filter** menu or SQL, sort by any facet column, and select rows to build datasets.
For a deeper look, open any trace. Facet summaries and matched topics are also visible in the [**Thread**](/observe/examine-traces#view-as-a-conversation) () layout and the [** Evaluators**](/observe/examine-traces#test-and-apply-evaluators) tab.
Once a cluster is active, open the **** menu next to the applied filters to adjust the run:
* ** View clustering query** — Inspect the underlying query that produced the clusters.
* ** Run in SQL sandbox** — Open that query in the [SQL sandbox](https://www.braintrust.dev/app/~/sql) to refine or extend it.
* ** Clustering settings** — Tune how traces are grouped, including the clustering algorithm, distance threshold, embedding model, dimension reduction, and sample size.
## Examine specific traces
On the [** Logs**](https://www.braintrust.dev/app/~/logs) page, each trace in the logs table shows a **facet summary** (the short text the LLM extracts per facet) and **topic** the summary was matched to. If the LLM couldn't extract a meaningful summary for a facet, the summary will indicate no match and the trace won't have a summary for that facet. You can filter by topic or facet using the **Filter** menu or SQL, sort by any facet column, and select rows to build datasets.
For a deeper look, open any trace. Facet summaries and matched topics are also visible in the [**Thread**](/observe/examine-traces#view-as-a-conversation) () layout and the [** Evaluators**](/observe/examine-traces#test-and-apply-evaluators) tab.
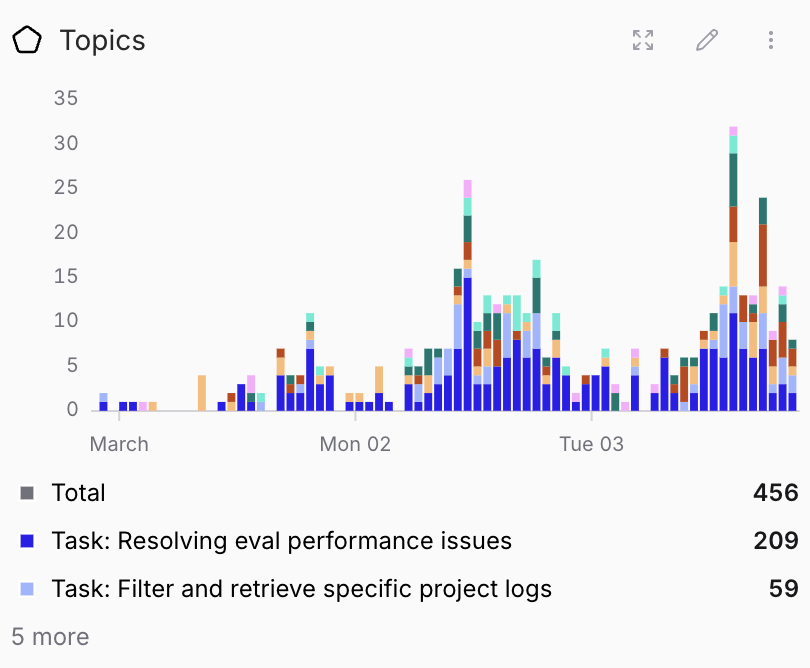
 ## Track trends over time
When topics are active, a **Topics** chart automatically appears on [** Monitor**](https://www.braintrust.dev/app/~/monitor). This chart shows classified log volume over time. Click any data point to see those traces in the logs table.
## Track trends over time
When topics are active, a **Topics** chart automatically appears on [** Monitor**](https://www.braintrust.dev/app/~/monitor). This chart shows classified log volume over time. Click any data point to see those traces in the logs table.
 ## Next steps
* [Act on findings](/observe/topics/act-on-findings) to turn surfaced patterns into datasets, scorers, and review assignments.
* [Query classifications with SQL](/reference/sql#query-by-classifications) for ad-hoc analysis.
## Next steps
* [Act on findings](/observe/topics/act-on-findings) to turn surfaced patterns into datasets, scorers, and review assignments.
* [Query classifications with SQL](/reference/sql#query-by-classifications) for ad-hoc analysis.