AI observability tools: A buyer's guide to monitoring AI agents in production (2026)
AI agents in production make thousands of decisions daily. When an agent returns a wrong answer, most teams can't trace back through the reasoning chain to find where it went wrong. When quality degrades after a prompt change, they don't know until users complain. When costs spike, they can't pinpoint which workflows are burning budget.
This is where AI observability separates winning teams from everyone else. AI observability tools trace multi-step reasoning chains, evaluate output quality automatically, and track cost per request in real time. The difference between reactive debugging and systematic improvement is what separates profitable AI products from expensive experiments.
- Braintrust - Best overall AI observability platform. Captures comprehensive agent traces with automated evaluation, real-time monitoring, cost analytics, and flexible integration options.
- Arize Phoenix - Open-source observability platform with embedded clustering and drift detection for production monitoring.
- Langfuse - Self-hosted LLM observability with trace viewing, prompt versioning, and cost tracking across deployments.
- Fiddler - Enterprise observability platform with hierarchical agent traces, real-time guardrails, and compliance monitoring.
- Galileo AI - Agent observability with Luna-2 evaluators for fast, cost-effective monitoring at scale.
- Opik by Comet - LLM observability with experiment tracking for unified ML and agent monitoring workflows.
- Helicone - Proxy-based observability for instant usage tracking, token monitoring, and cost analytics across providers.
- Datadog LLM Observability - LLM and agent tracing on the Datadog platform, with a Trace Cluster Map that groups traffic into semantic topic clusters.
Why AI observability matters for AI agents
AI observability for agents refers to the ability to monitor and understand everything an AI agent is doing. Not just whether the API returns a response, but what decisions the agent made and why. Traditional app monitoring might tell you a request succeeded. AI observability tells you if the answer was correct, how the agent arrived at it, and whether the process can be improved.
This is crucial because LLM-based agents are nondeterministic. The same prompt can return different outputs, and failures don't always throw errors. Observability data provides the evidence needed to debug such issues and continually refine your agent. Without proper observability, you're essentially flying blind, unable to explain why an agent behaved a certain way or how to fix its mistakes.
Modern AI observability is built on several key concepts:
Traces reconstruct the complete decision path for any agent interaction. Every LLM call, tool invocation, retrieval step, and intermediate decision gets captured with full context. Think of traces as the "call stack" for your AI system. They show you not just what happened, but how and why.
Sessions group related interactions together. When a user has a multi-turn conversation with your agent, or when an agent executes a complex workflow over multiple steps, sessions help you understand the complete user journey.
Spans represent individual operations within a trace. Each span captures timing, inputs, outputs, and metadata for a specific step. Spans nest inside each other, creating a hierarchy that reveals your agent's execution flow.
Evals (evaluations) measure quality systematically. Rather than manually reviewing outputs, evals use automated scoring through heuristics, LLM-as-judge, or custom logic to quantify how well your agent performs against specific criteria.
Feedback captures both automated scores and human annotations. Product managers, domain experts, and users can mark outputs as good or bad, creating training data for continuous improvement.
The best AI observability tools in 2026
1. Braintrust (best for evaluation-driven AI agent observability)
Braintrust is the only platform that integrates evaluation directly into the observability workflow. It doesn't just log what your agent does. It scores how well your agent performs using customizable metrics. This evaluation-first approach closes the feedback loop between testing and production, making it the best option for teams that need to catch regressions before they hit production.
Braintrust provides comprehensive AI observability features, including exhaustive tracing, automated evaluation, real-time monitoring, cost analytics, flexible integration options, and more.
AI agent tracing and logging
Braintrust captures comprehensive traces automatically for every request:
- Duration, LLM duration, time to first token
- LLM calls, tool calls, errors (broken down by LLM errors vs tool errors)
- Prompt tokens, cached tokens, completion tokens, reasoning tokens, estimated cost
- Full prompts with system messages, retrieved context, tool call inputs/outputs
- Intermediate reasoning steps and final answers
- Metadata including model, prompt version, parameters, custom tags
All this is presented in an expandable tree of spans.
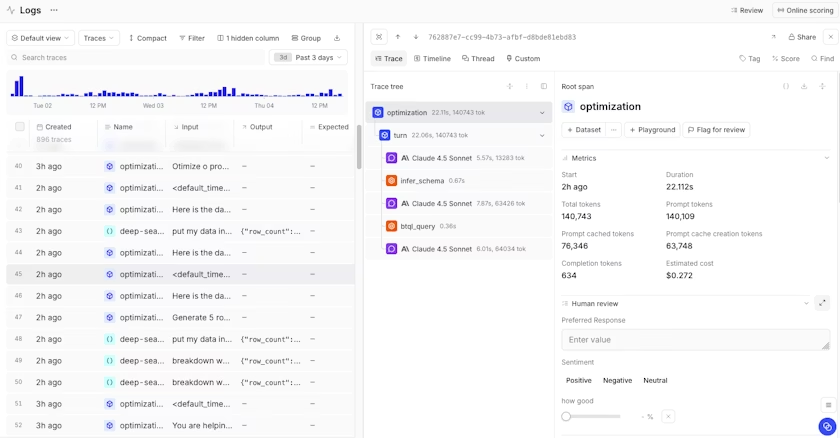
Braintrust's trace panel showing all of the spans that make up the trace
You can click on a span to see input/output details, and even view metrics per span (like tokens or errors). Braintrust's traces are consistent across both offline eval runs and production logging, so you can debug issues in the same UI where you tested your fixes.
LLM evaluation and scoring
Braintrust includes 25+ built-in scorers for accuracy, relevance, and safety. Loop, Braintrust's AI assistant, generates custom scorers from natural language descriptions in minutes. Evaluations run on-demand in CI tests or continuously on production traffic. Production traces become test cases with one click.
The Playground lets you load any trace, modify prompts or models, and rerun to see output changes. Compare different configurations side-by-side with quality scores and cost analysis.
AI agent monitoring and alerting
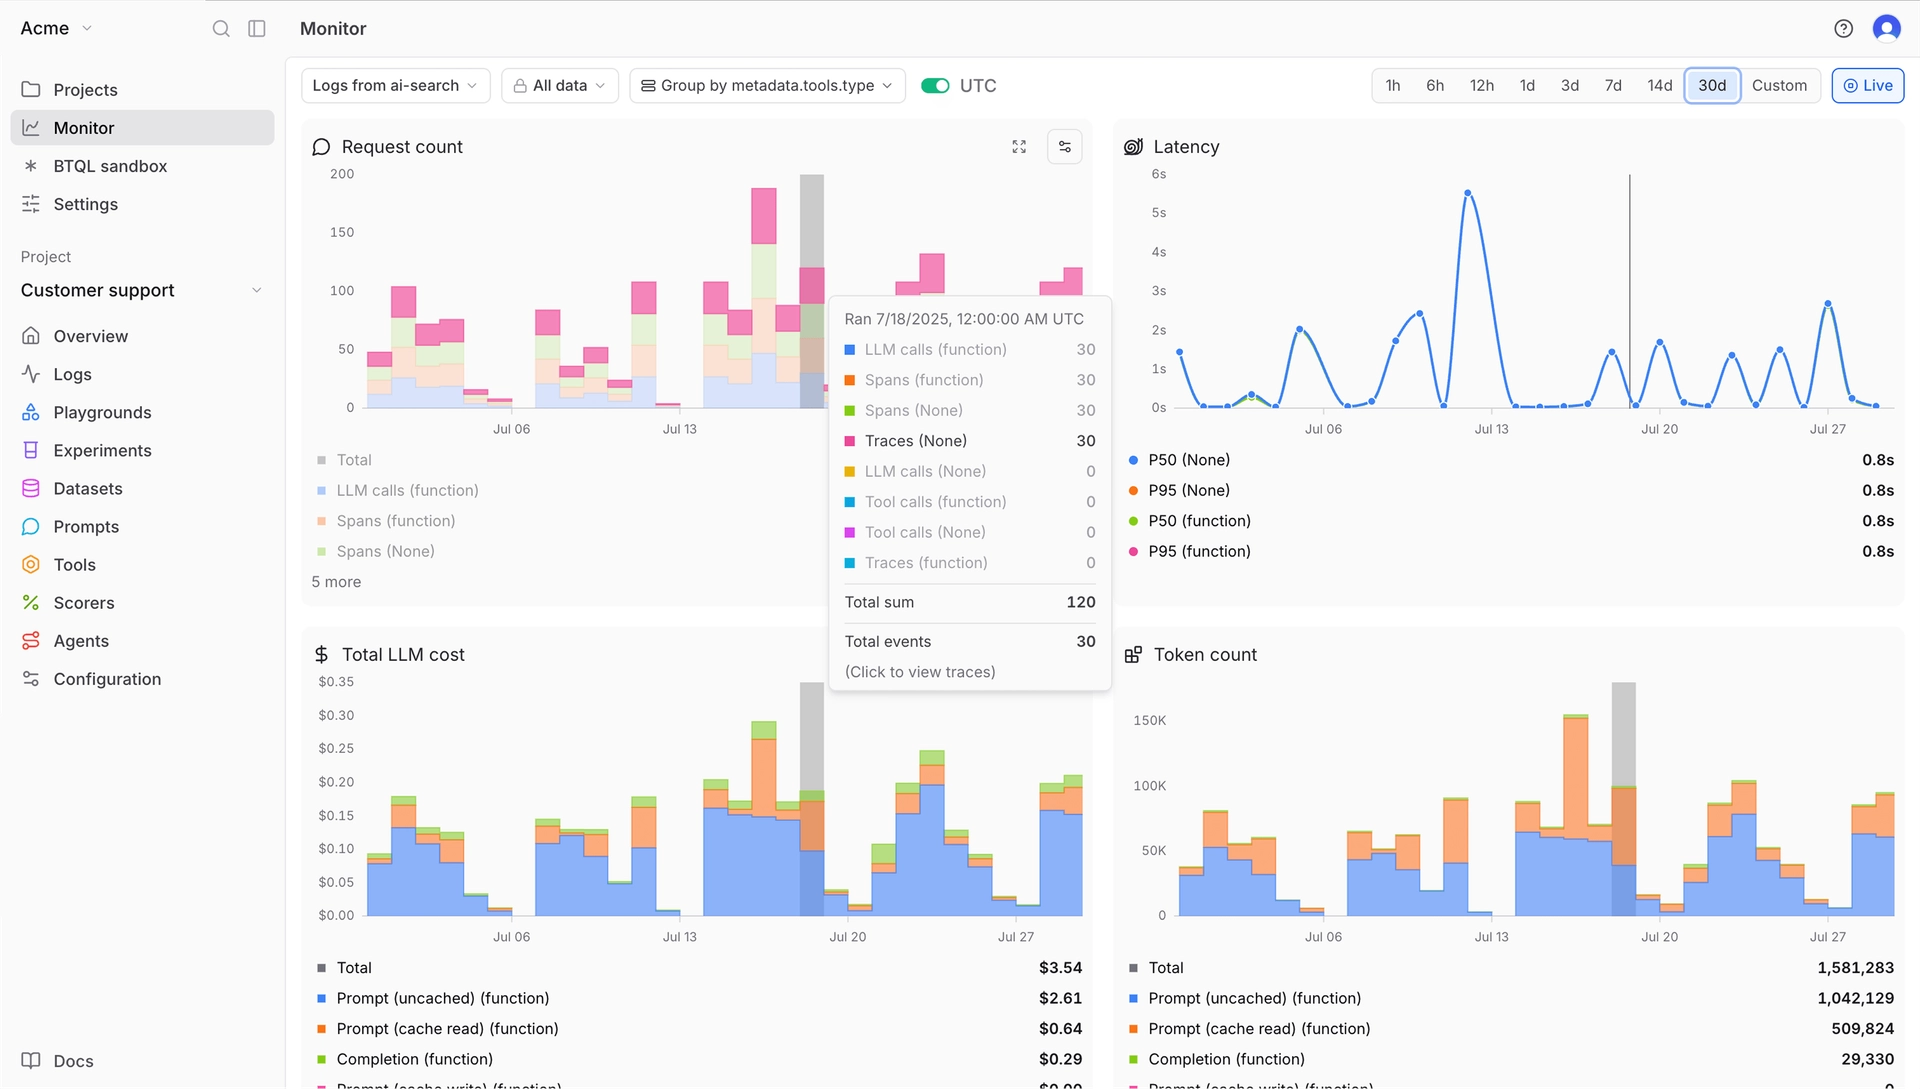
You get real-time dashboards for token usage, latency, request volume, error rates, etc. You can slice these by any metadata (e.g., view cost per each feature or user cohort). Braintrust performs online quality monitoring, so the same scorers you use in eval can run on live data, letting you monitor model quality metrics, not just technical metrics.
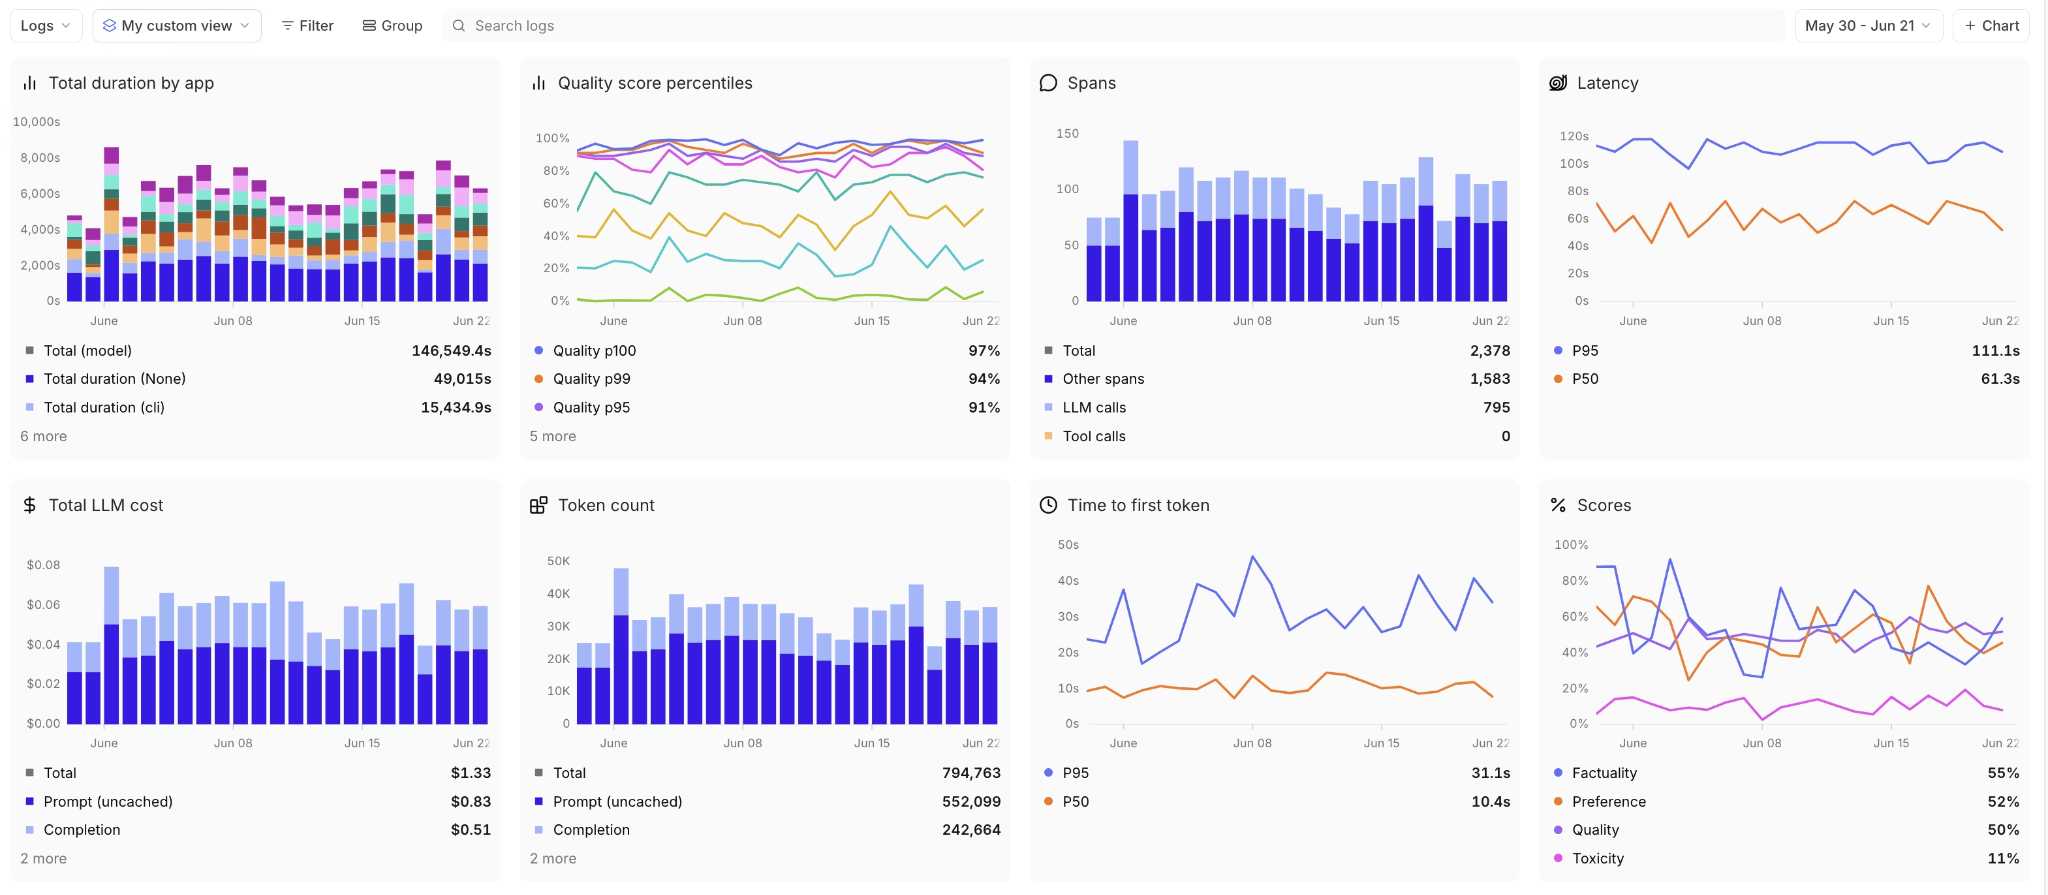
Custom view of Braintrust's monitoring dashboard
You can set up alerts based on any condition you define using BTQL. For example, you might configure: "Alert if more than 5% of responses in an hour have a relevancy score < 0.5" or "Alert if average tokens per request today > 1.5x last week's average." When conditions trigger, Braintrust can send a webhook or Slack message to notify your team.
Loop analyzes logs on request and suggests new observability metrics when it finds patterns.
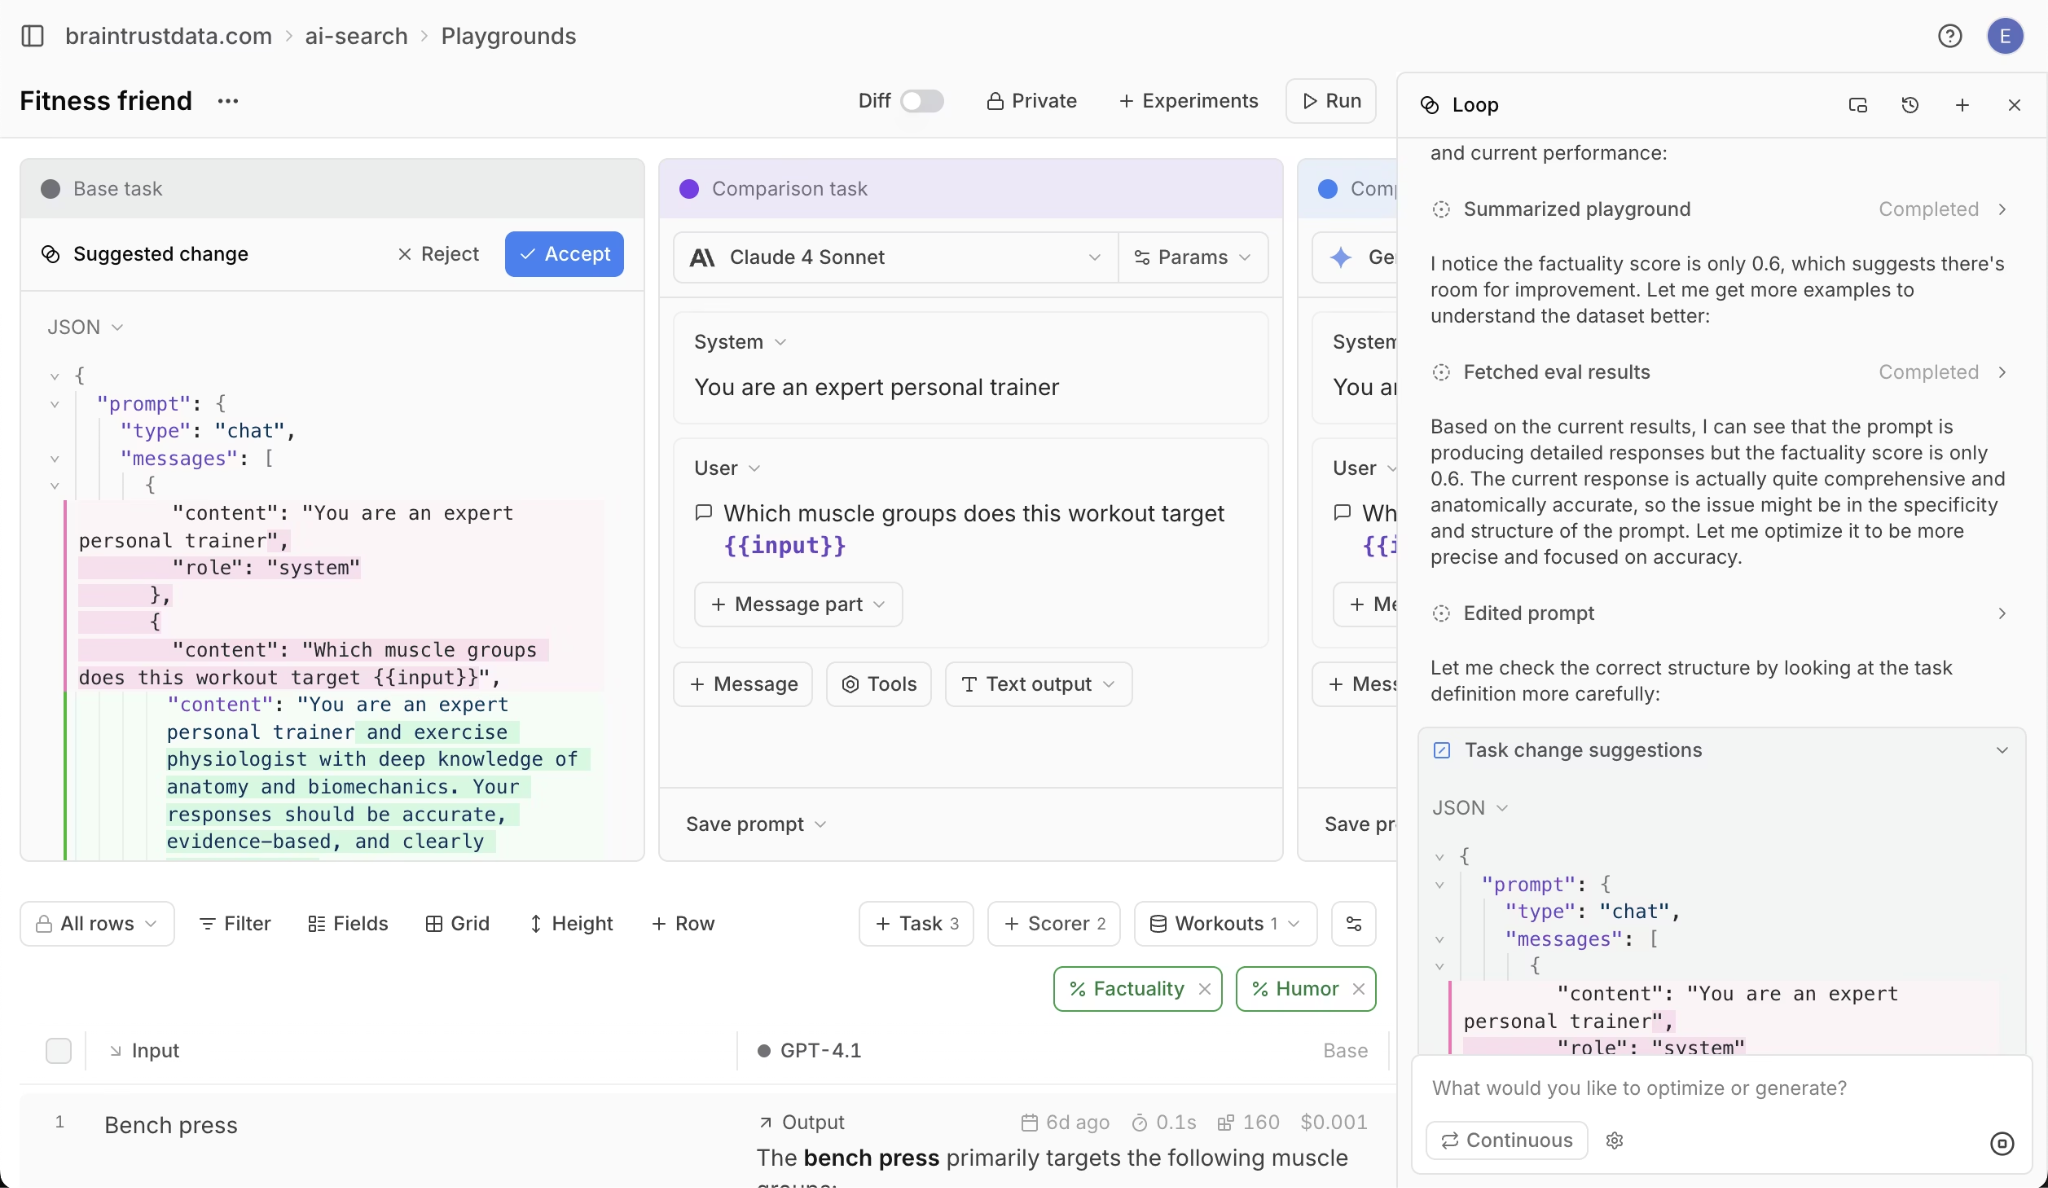
Braintrust's AI assistant, Loop, in action
You can ask Loop questions in natural language, like "Have there been more hallucinations in the past week?" and it will try to answer by examining the data.
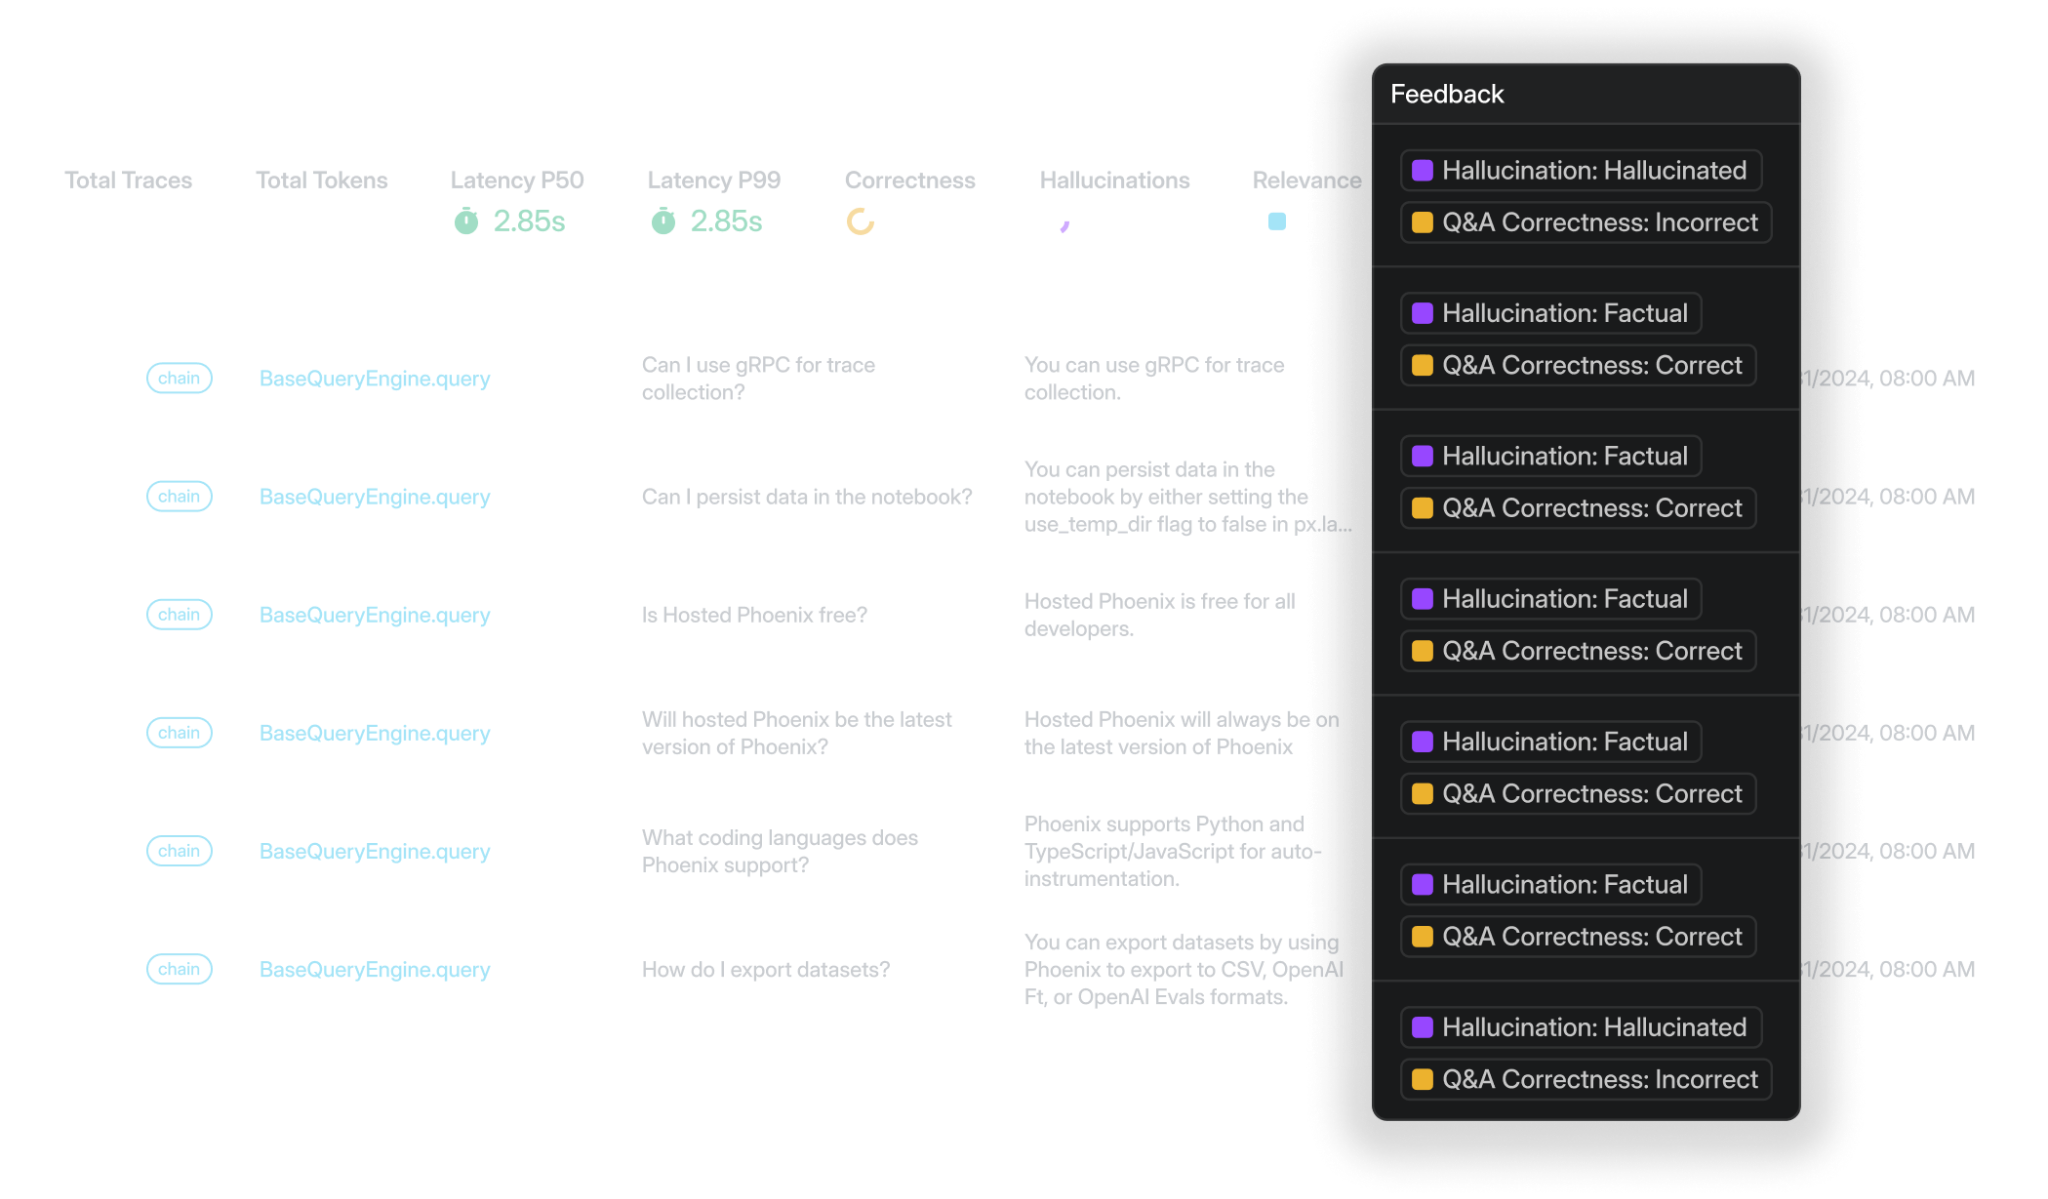
Active observability with Topics
Topics classifies every production trace by task, sentiment, and issue as it lands, then clusters similar traces so quality trends surface across all traffic instead of only the runs that trip an alert. You can add custom facets for domain-specific dimensions, filter or query the classifications in your logs, and pull them directly into eval datasets and review queues. Braintrust calls this active observability: the platform works through production data in the background rather than waiting for you to know what to search for. Other tools surface patterns through embedding clusters (Arize Phoenix and Fiddler), failure clustering (Galileo AI), semantic topic clusters (Datadog), or manual tags (Langfuse and Helicone); Topics instead assigns intent, sentiment, and issue labels to every trace and feeds them back into evaluation.
LLM cost and latency analytics
Granular cost analytics break down per request, by prompt and completion tokens, for each model. Track cost per user, per feature, or custom groupings. Identify which 5% of requests consume 50% of tokens. Latency analytics pinpoint slow spans to optimize agent efficiency.
Integration methods
Braintrust supports three integration approaches:
- SDK integration: Native support for 13+ frameworks, including LangChain, LlamaIndex, Vercel AI SDK, OpenAI Agents SDK, Instructor, Google ADK, Mastra, Pydantic AI, DSPy, LiteLLM, Autogen, CrewAI, and more. Minimal configuration required.
- OpenTelemetry: Auto-converts OTEL spans to Braintrust traces with full LLM-specific context. Works out of the box with Vercel AI SDK and other frameworks.
- AI gateway: Unified access to models from OpenAI, Anthropic, Google, AWS, Mistral, and third-party providers. Automatically caches results (under 100ms for cached requests) and logs calls.
The native GitHub Action runs evaluation suites on every pull request, gating releases that would reduce quality. The web interface works for cross-functional teams. Engineers, product managers, and QA collaborate without handoffs.
Security and governance
SOC 2 Type II certified with multiple deployment modes. Cloud SaaS is convenient and secure with encrypted data and configurable retention. Enterprise customers choose hybrid deployment: dedicated data plane in your AWS/GCP/Azure while using the managed Braintrust UI. Fully self-hosted option available.
Fine-grained access controls restrict who can view or search projects. Audit logs track data access.
Pros
- Comprehensive trace logging with zero setup: Every trace automatically captures duration, LLM duration, time to first token, LLM calls, tool calls, errors (separated by LLM vs tool errors), prompt tokens, cached tokens, completion tokens, reasoning tokens, and estimated cost. No manual instrumentation needed.
- Query performance built for AI scale: Analyze millions of production traces in seconds with 80x faster performance than traditional databases. The Brainstore database is designed specifically for AI workload patterns.
- Real-time and batch evaluation: Run automated scorers against live production traffic or test datasets. Configure LLM-as-judge metrics, custom evaluators, or deterministic checks with minimal setup.
- Three integration methods for flexibility: SDK support for 13+ frameworks, including LangChain and Vercel AI SDK. OpenTelemetry for existing infrastructure. AI gateway for instant setup with automatic caching.
- Collaborative observability interface: Engineers explore traces and debug with complete context. Product managers test prompts in the playground against real production data. Quality scores and traces are visible to the entire team without handoffs.
- Loop for instant custom metrics: Generate observability scorers from natural language descriptions in minutes. No code required to define new quality metrics.
- Active observability with Topics: Automatically classifies every production trace by task, sentiment, and issue, then clusters similar runs so patterns surface across all traffic, not just flagged failures.
- Managed SaaS with zero infrastructure: Sign up, integrate via SDK or the AI gateway, start capturing traces immediately. No servers to manage or databases to provision.
- AI gateway with unified model access: Single OpenAI-compatible API for models from OpenAI, Anthropic, Google, AWS, and others. Automatic caching and trace logging included. Free to use even without a Braintrust account.
- Generous free tier for production use: 1 GB of processed data, 10k evaluation scores, unlimited team members monthly.
Cons
- Self-hosting option available only on the enterprise pricing tier.
- Pro tier at $249/month may not fit bootstrapped budgets.
Pricing
- Free: 1 GB of processed data, 10k scores, unlimited users.
- Pro Plan: $249/month (advanced features).
- Enterprise Plan: Custom pricing (self-hosting, hybrid deployment, dedicated support). See pricing details here.
Best for
Teams building production AI agents who need to catch issues before customers do, not just analyze what already happened.
Start with Braintrust's free tier to see value first. You can instrument your AI agent and start catching issues in under an hour. Braintrust is trusted by leading companies globally, including Notion, Stripe, Vercel, Airtable, Instacart, and Zapier.
2. Arize Phoenix
Arize Phoenix is an open-source observability platform with tracing and embedding clustering. Vendor and language agnostic with support for LlamaIndex, LangChain, DSPy, and Haystack. For pattern discovery, Phoenix runs HDBSCAN clustering over embeddings with UMAP visualizations and orders clusters by drift, which surfaces groups of traces that are degrading or diverging from a baseline rather than labeling each trace by intent or sentiment.
Pros
- Open-source platform with paid SaaS option
- OpenTelemetry-based tracing
- Embedding clustering identifies failure patterns
- Dataset management for versioned test cases
- Self-hosting with complete data control
Cons
- UI is less polished than commercial alternatives
- Self-hosting needs DevOps knowledge
Pricing
Free and open-source for self-hosting. Managed cloud pricing starts at $50/month, and custom pricing for Enterprise.
Best for
Teams with strict data residency requirements and engineering resources for managing infrastructure.
Read our guide on Arize Phoenix vs. Braintrust.
3. Langfuse
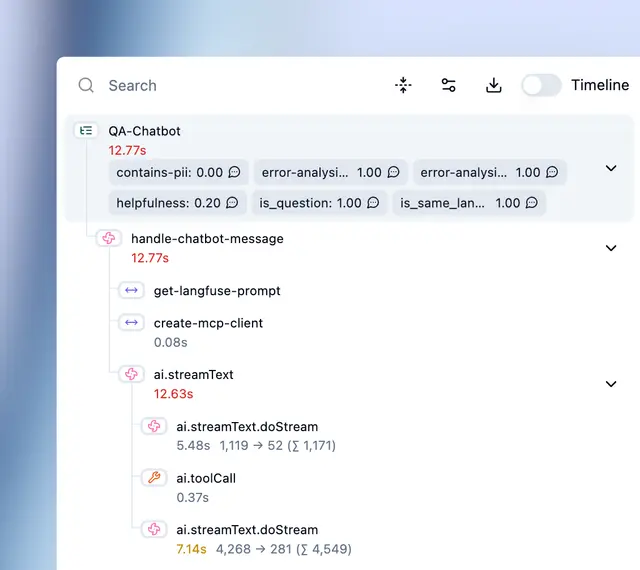
Langfuse is an open-source LLM engineering platform with observability, metrics, evaluation, and prompt management. Built on ClickHouse and PostgreSQL. Langfuse does not classify traces by topic automatically. It provides manual tags for categorizing and filtering traces, plus a cookbook for building your own intent-classification pipeline that embeds messages, clusters them, and labels the clusters.
Pros
- Tracing for all LLM interactions, including retrieval and agent actions
- Prompt management with version control
- Experiments compare configurations systematically
- Python instrumentation with @observe() decorator
- Cost tracking across model types
- BigQuery integration for SQL-based analysis
Cons
- Best features in the cloud version. Open-source is more limited for LLM use cases
- Self-hosting requires DevOps expertise
Pricing
Self-hosted: free with all features. Cloud Hobby: free with core features. Paid plan starts at $29/month.
Best for
Data science teams that need SQL access to trace data and detailed cost analytics.
Read our guide on Langfuse vs. Braintrust.
4. Fiddler
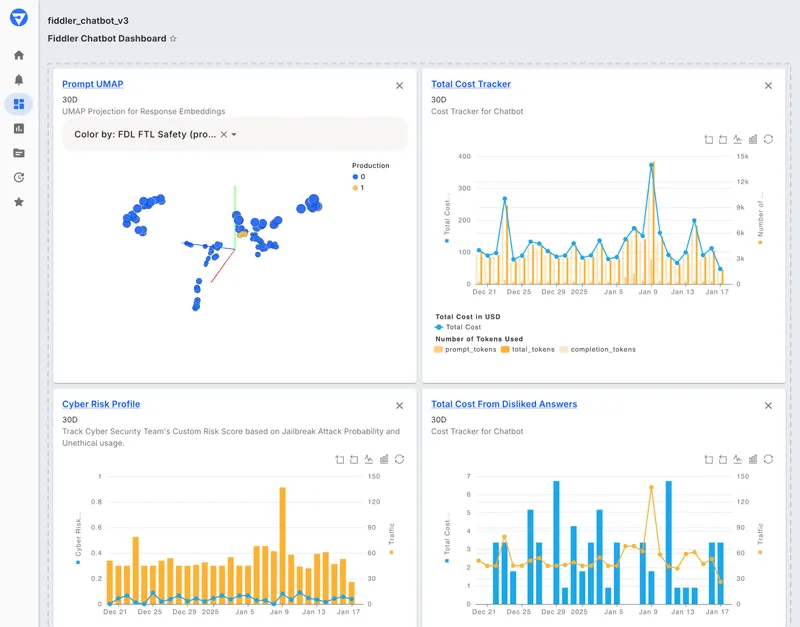
Fiddler is an enterprise AI observability platform that covers traditional ML models and generative AI through a single interface. Its LLM Enrichments add metrics to traces, including TextEmbedding enrichments that power 3D UMAP cluster visualizations and topic-drift detection, plus sentiment analysis, so teams can group similar prompts and responses and watch how themes shift over time.
Pros
- Monitoring for traditional ML, LLMs, and agents
- Sub-100ms guardrails for hallucinations, toxicity, PII detection, and prompt injection
- Feature attribution and root cause analysis
- Model performance tracking, drift detection, bias assessment
- SOC 2 compliance and audit trails
- Cloud, VPC, and on-premises deployment
Cons
- Enterprise pricing requires a sales discussion
- Steeper learning curve given feature breadth
Pricing
Custom enterprise pricing.
Best for
Regulated industries like finance, healthcare, and defense require explainability and bias detection.
5. Galileo AI
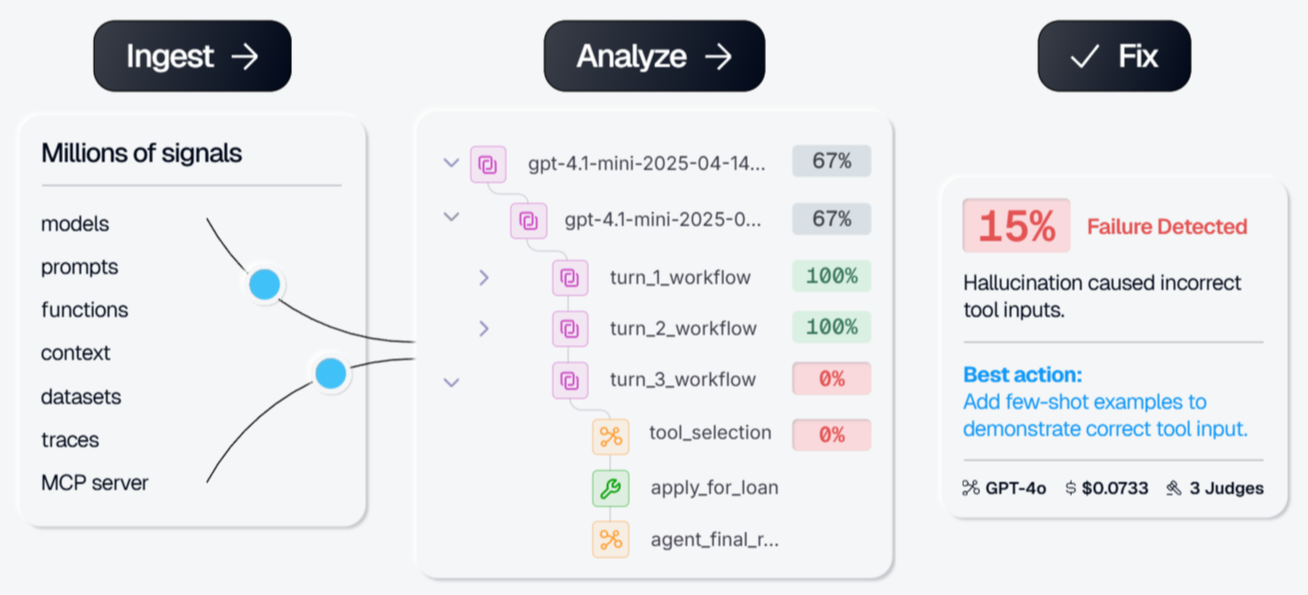
Galileo AI is an AI reliability platform with Luna-2 small language models, evaluators that run at sub-200ms latency and ~$0.02 per million tokens. Its Insights Engine (also called Signals) automatically clusters similar failures across production traces and surfaces the underlying patterns, focused on finding and grouping problems rather than classifying all traffic by intent and sentiment.
Pros
- Agent observability with end-to-end visibility
- Luna-2 models for fast, cost-effective evaluation
- 20+ evaluators for RAG, agents, safety, security
- Eval-to-guardrail lifecycle converts evaluations into production safety checks
- Real-time guardrails intercept risky actions before execution
- Monitors production traffic at a lower cost than LLM-as-judge
Cons
- Newer platform with a smaller community
- Some features are still in development
Pricing
Free tier: 5,000 traces/month. Pro: starts at $100 for 50,000 traces/month. Custom enterprise pricing.
Best for
Production agents requiring real-time safety checks at scale without excessive LLM-as-judge API costs.
6. Opik by Comet
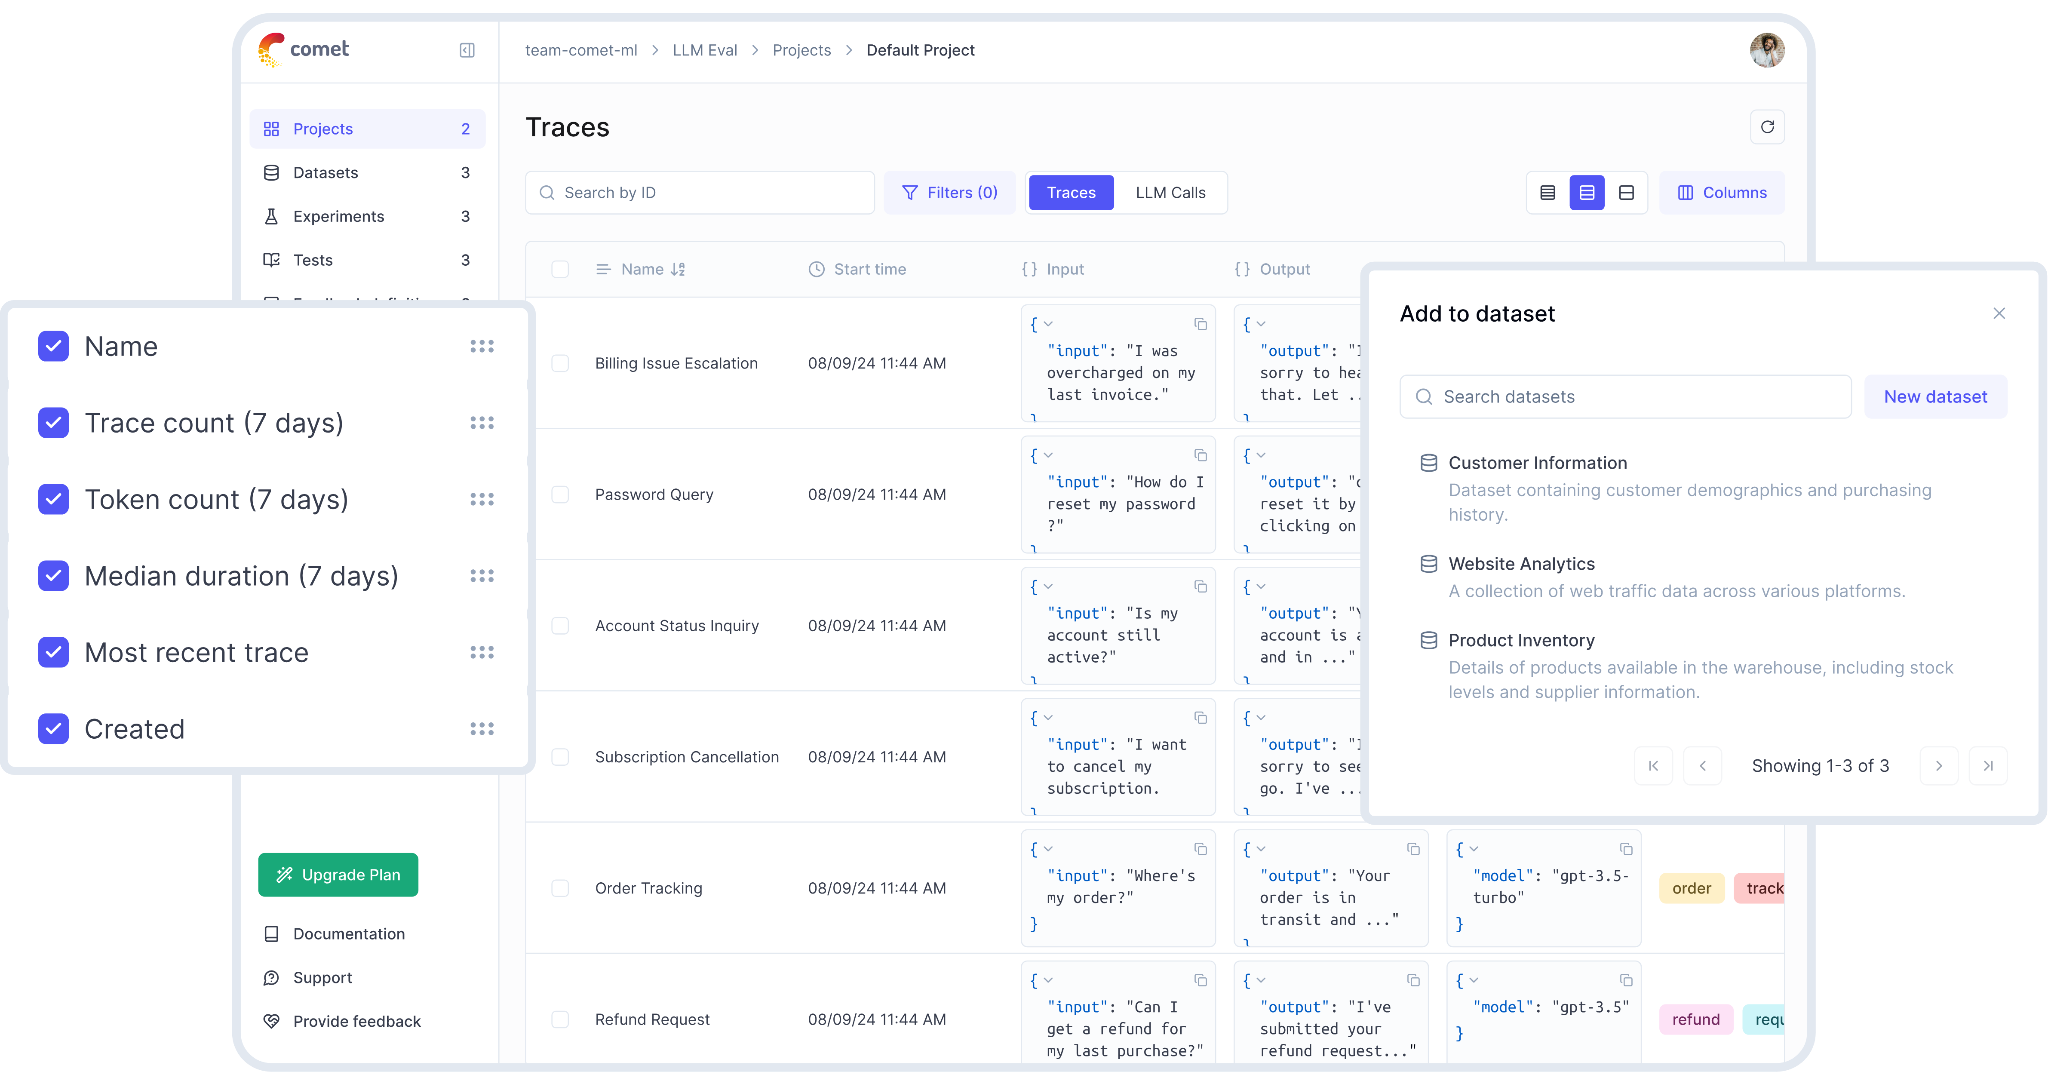
Comet Opik is an open-source LLM observability and evaluation platform that combines observability with ML experiment management. It does not group traces into topics, but online evaluation rules can run LLM-as-judge metrics automatically across production traces to score them for issues like hallucination or answer relevance.
Pros
- Open-source platform with end-to-end tracing
- Experiment tracking compares prompts, models, and configurations
- Dataset management for systematic testing
- PyTest integration for LLM unit tests
- TypeScript SDK and OpenTelemetry support
Cons
- Best experience requires existing Comet usage
- Less compelling if not using a broader ML platform
Pricing
Free open source and self-hosting options. Cloud plan has a free tier, with paid plans starting at $19/month.
Best for
Teams using Comet for ML experiment tracking who need unified observability.
7. Helicone
Helicone is an open-source AI gateway and observability platform with proxy-based integration. It organizes traffic through custom properties and sessions, which let you tag and filter requests by attributes you define, rather than classifying traces by topic automatically.
Pros
- API gateway accesses 100+ models from multiple providers
- Proxy-based integration requires only a URL change
- Semantic caching reduces costs and latency
- Automatic failover and load balancing
- SOC 2 and HIPAA compliance
Cons
- Shallow tracing depth compared to SDK-based tools
- No visibility into internal agent logic or multi-step workflows
Pricing
Free plan with 10,000 requests/month. Paid plan starts at $20/seat/month.
Best for
Teams that need immediate visibility across 100+ models with minimal engineering effort.
Read our guide on Helicone vs. Braintrust.
8. Datadog LLM Observability
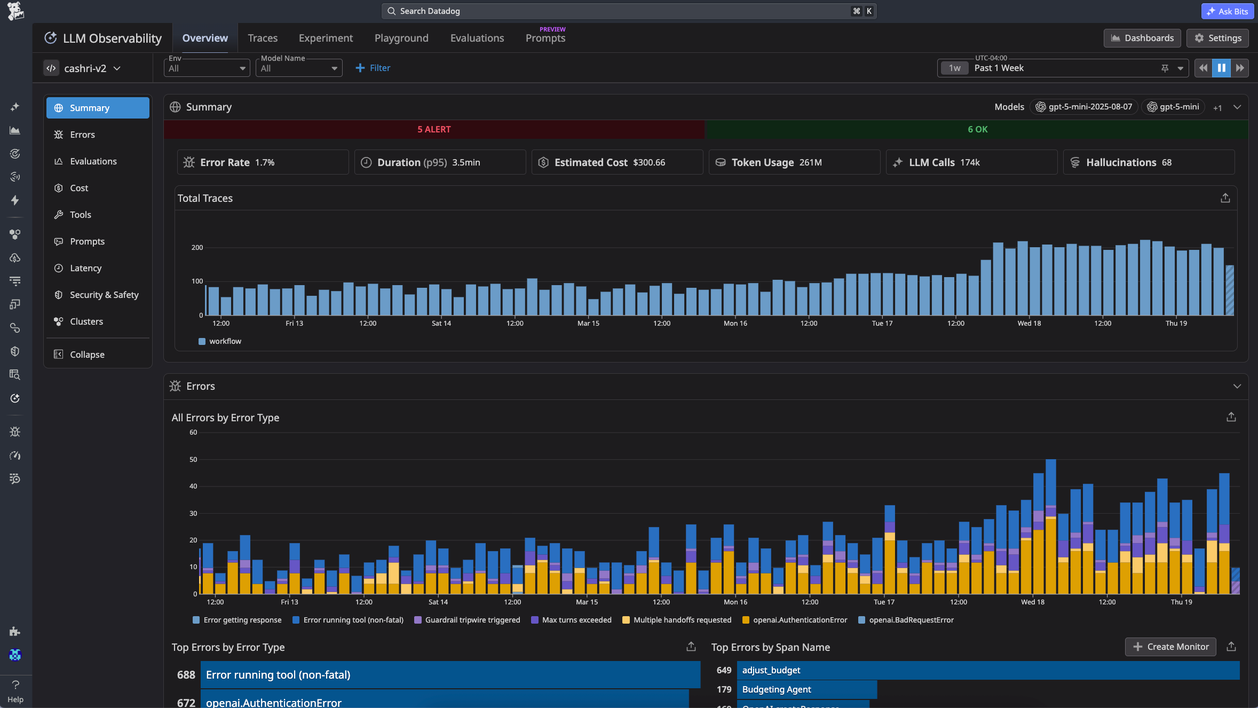
Datadog LLM Observability extends Datadog's monitoring platform to LLM and agent applications, with end-to-end tracing, cost and latency metrics, quality and security evaluations, and prompt tracking that sit alongside the rest of your infrastructure telemetry.
Its Trace Cluster Map automatically groups prompts and responses into topic clusters by semantic similarity, then color-codes them by evaluation scores such as output sentiment. This lets you see how specific topics perform and spot topic drift across production traffic. Clustering can take up to 24 hours to process after ingestion.
Pros
- End-to-end LLM and agent tracing integrated with Datadog APM, logs, and infrastructure metrics
- Trace Cluster Map groups traces into semantic topic clusters, color-coded by evaluations to surface topic drift
- Out-of-the-box and custom evaluations for quality and security
- Prompt tracking and experiments in the same platform
- Natural fit for teams already standardized on Datadog
Cons
- Observability-first, so evaluation and the production-to-test-case loop are less central than in eval-first platforms
- Topic clusters can take up to 24 hours to appear after ingestion
- Usage-based pricing on top of an existing Datadog contract can be hard to predict
Pricing
Usage-based as part of the Datadog platform, billed per LLM trace, and requires a Datadog account. Contact Datadog for current per-trace rates.
Best for
Teams already running Datadog across their infrastructure that want LLM and agent observability in the same place, with topic clustering to track quality by theme.
Read our guide on Braintrust vs. Datadog for LLM observability.
Comparison: Best AI observability platforms
| Platform | Pricing | Best for | Integration method |
|---|---|---|---|
| Braintrust | Free tier: 1 GB processed data, unlimited users; Paid: $249/month for advanced features | Teams that need to catch regressions before they hit production | SDK (13+ frameworks), OpenTelemetry, and AI gateway |
| Arize Phoenix | Free (open-source), managed cloud plans start at $50/month | Teams with strict data residency requirements and engineering resources for self-hosting | OpenTelemetry-based |
| Langfuse | Free (self-hosted), paid Cloud plans start at $29/month | Data science teams that need SQL access to trace data | SDK with @observe() decorator |
| Fiddler | Custom enterprise pricing | Regulated industries requiring explainability, bias detection, and compliance | Enterprise integrations with major cloud platforms |
| Galileo AI | Free: 5K traces/month, paid plans start at $100/month | Production agents requiring real-time safety checks without excessive API costs | SDK-based with Luna-2 evaluators |
| Opik by Comet | Free tier, paid plans start at $19/month | Teams using Comet for ML experiment tracking | SDK with TypeScript support and OpenTelemetry |
| Helicone | Free: 10K requests/month, paid plans start at $20/seat/month | Teams that need immediate visibility with minimal engineering effort | Proxy-based (URL change only) |
| Datadog LLM Observability | Usage-based, part of the Datadog platform | Teams already standardized on Datadog that want LLM tracing and topic clustering in one place | SDK and OpenTelemetry |
Ship your AI products with confidence. Start free with Braintrust
Platform deployment: Open source vs SaaS vs hybrid
Open source AI observability platforms
Self-hosting makes sense when you have strict data residency requirements, need complete control over infrastructure and costs, or have existing DevOps capabilities.
Self-hosted platforms require ongoing maintenance: updates, security patches, scaling infrastructure, and ensuring uptime. Platform expertise takes time to build. Issues rely on community support or internal debugging rather than vendor support.
Self-host is the right choice when: Data must stay in your infrastructure. You have DevOps resources to manage additional services. You need deep platform customization.
Commercial SaaS AI observability platforms
SaaS is the only scalable way for product managers to iterate on prompts. Managed platforms work when you want to focus on building AI features rather than managing infrastructure.
The second you want five people using observability, you're paying for hosted SaaS or doing the work of self-hosting infrastructure, routing, and interface setup. That's a significant lift just to start experimenting with AI models. For a minimal monthly cost, you eliminate that overhead entirely. Managed platforms charge based on usage, typically per trace, span, or API request.
SaaS is the right choice when: You're shipping features fast. You lack a dedicated DevOps team. You need guaranteed uptime with vendor support. You want product managers updating prompts without infrastructure barriers.
Hybrid and enterprise AI observability solutions
Hybrid deployments make sense when you need managed control plane simplicity but must keep sensitive data in your infrastructure. Enterprise solutions offer dedicated support, custom SLAs, SAML SSO, advanced RBAC, and compliance certifications.
Hybrid and enterprise deployments take weeks to months for procurement, security reviews, and infrastructure setup. Costs are higher, and enterprise contracts often start in tens of thousands annually. For organizations at scale, the support, reliability, and compliance features justify the investment.
Hybrid is the right choice when: You need SaaS convenience with data residency. Compliance requires sensitive data stay in your environment.
SaaS is the only practical option for cross-functional teams shipping production AI. Product managers iterate on prompts directly. Data scientists run experiments immediately. Engineers build AI products rather than manage observability infrastructure.
Braintrust's cloud offering gets you production observability in 15 minutes. For teams that require data residency, Braintrust's hybrid deployment keeps sensitive data in your infrastructure while maintaining the velocity of managed SaaS.
Integration approaches: Proxy vs SDK vs OpenTelemetry
The integration method determines whether you only see model inputs and outputs or truly understand how your agents think and act.
Proxy-based integration
Setup: Very fast (minutes).
Depth: Shallow.
Captures prompts, responses, tokens, latency, and cost at the API level. No visibility into internal agent logic, tool calls outside the LLM, or multi-step workflows.
Braintrust's AI gateway provides unified access to models from OpenAI, Anthropic, Google, AWS, and more through a single API. The gateway automatically caches results and logs every call to Braintrust for observability.
SDK-based integration
Setup: Moderate.
Depth: Deep.
Captures full agent behavior, internal steps, tool calls, custom metadata, and structured traces. Requires code changes and ongoing maintenance.
Braintrust provides native SDK integrations for 13+ frameworks, including LangChain, LlamaIndex, Vercel AI SDK, OpenAI Agents SDK, and more. SDK integration captures your entire application flow (LLM calls, vector searches, tool invocations, retrieval pipelines, and business logic) with complete context for each decision.
OpenTelemetry-based integration
Setup: Moderate.
Depth: Deep with a standardized format.
Captures traces across services, correlated with existing system telemetry.
Braintrust provides robust OpenTelemetry support through BraintrustSpanProcessor, automatically converting OTEL spans to Braintrust traces with full LLM-specific context. This works out of the box with frameworks like the Vercel AI SDK and CrewAI. OpenTelemetry integration lets you instrument your systems once and route traces to Braintrust alongside existing observability infrastructure.
Critical features in AI observability platforms
LLM prompt and LLM response management
Prompts are code in AI applications. The platform needs version control for prompts, tracking which version produced which output, and performance comparison across iterations. Braintrust lets you test prompt changes against production data before deployment, with integrations via SDK, OpenTelemetry, or AI gateway.
AI agent tracing and AI session replay
Observe the exact sequence: retrieved context, tool calls, step duration, failure points. Braintrust captures nested spans with complete context for replaying complex workflows across multi-turn interactions. Choose SDK integration for maximum depth, OpenTelemetry for existing infrastructure, or AI gateway for quick setup.
AI agent tool calls and workflow visibility
Agents use external APIs, databases, web searches, and code execution. Capture which tool was called, parameters passed, return values, and success/failure status. Braintrust logs every tool call with timing data to identify slow external dependencies through SDK, OpenTelemetry, or AI gateway integration.
LLM cost, latency, and token analytics
Track cost per request, per user, and by feature. Identify expensive patterns before they scale. Monitor latency at each step to find bottlenecks. Braintrust breaks down costs by prompt and completion tokens across models.
LLM evaluation workflows
Automated evaluations run continuously in development and production. LLM-as-judge metrics detect hallucinations and assess quality. Braintrust's Loop generates custom evaluators from natural language descriptions in minutes, then runs them automatically on every change.
AI quality alerting and regression detection
Set alerts for error rate spikes, latency increases, cost anomalies, or evaluation score regressions. Braintrust uses statistical methods to distinguish real regressions from normal variation.
AI security, privacy, and governance
Enterprise AI requires role-based access control, audit logs, data retention policies, and compliance certifications. Braintrust offers SOC 2 Type II certification with cloud, VPC, and self-hosted deployment options.
How to choose the right AI observability tool
AI agent debugging and tracing: Braintrust captures complete execution context with timing breakdowns for every agent decision through SDK, OpenTelemetry, or AI gateway integration. Production traces load in seconds with 80x faster query performance than alternatives. Open-source options like Phoenix and Langfuse offer basic tracing but lack the speed and integrated evaluation workflow.
LLM evaluation and scoring: Braintrust's evaluation-first approach with Loop generates custom scorers from natural language in minutes. Production traces become test cases with one click. Evaluations run automatically on every change. Competitors require manual eval setup or lack tight integration between observability and testing.
Prompt iteration and experimentation: Braintrust's playground connects directly to production traces with side-by-side comparison showing how changes affect quality scores. Test against real production data before deployment. Other platforms separate experimentation from production observability, creating friction.
LLM cost controls and optimization: Braintrust provides real-time granular tracking showing cost per run, per user, and by feature with hotspot identification. No surprises at month-end. Semantic caching through the AI gateway reduces costs further. Self-hosted alternatives require infrastructure overhead that eliminates cost savings.
AI governance and enterprise needs: Braintrust offers cloud, VPC, and self-hosted deployments with SOC 2 compliance and access controls. The flexibility to start with cloud and migrate to hybrid or self-hosted as compliance needs grow beats platforms locked into single deployment models.
Budget: Braintrust's free tier provides 1 GB of processed data with all core features, including Loop, evaluations, and the playground, plus unlimited users with no per-seat charges. Usage-based pricing scales with your needs. Self-hosting alternatives like Phoenix and Langfuse require fixed infrastructure costs plus engineering time for maintenance, eliminating cost advantages.
Team structure: Braintrust works for every team structure. Founder-led teams get instant setup with the AI gateway. Product teams use Loop for no-code evaluation creation. Platform teams leverage OpenTelemetry integration. ML teams get unified workflows. Competitors optimize for one persona at the expense of others.
Timeline: Braintrust delivers value at every stage. Today: the AI gateway provides instant visibility. This sprint: SDK integration plus Loop-generated evaluations establish baseline quality. This quarter: Automated quality gates, production monitoring, and cross-functional workflows. Other platforms require choosing between speed and depth, but Braintrust provides both.
Why Braintrust is the best AI observability tool
Most observability platforms log what happened. Braintrust shows you what happened, why it happened, and how to prevent it from happening again.
Production traces convert directly into test cases. Engineers and product managers collaborate in one interface. Problems found in production become permanent guardrails with one click. No exports, no handoffs, no switching between tools.
Three integration methods (SDK, OpenTelemetry, AI gateway) give you flexibility. Start with the gateway for immediate visibility. Add SDK integration when you need depth. Use OpenTelemetry if you have existing infrastructure. The platform scales with your needs.
Braintrust is the only observability platform where catching issues, diagnosing root causes, and preventing recurrence happen in the same system.
Start building reliable AI with Braintrust. Get 1 GB of free processed data per month and Loop-powered evaluations.
FAQ: Best AI observability tools
How does AI observability differ from traditional application monitoring?
Traditional monitoring tracks system health like CPU, memory, request rates, error rates, and latency. AI observability tracks semantic quality and behavior, including whether the agent understood the query, whether the retrieved context was relevant, whether tool calls succeeded, and whether the output was accurate and aligned with policies. An agent can return HTTP 200 with confidently wrong content, which is why AI observability requires new primitives like traces showing multi-step reasoning, evaluations measuring output quality, and session analysis tracking coherence across interactions.
Braintrust integrates AI-specific observability with traditional monitoring through SDK, OpenTelemetry, or AI gateway integration, letting you monitor technical metrics alongside quality scores from automated evaluations.
What's the difference between monitoring and evaluation in AI observability?
Monitoring observes what happens in production by tracking metrics, detecting anomalies, and alerting on issues, while evaluation measures quality systematically using predefined criteria. Monitoring tells you when something went wrong, and evaluation tells you if outputs are good or bad according to specific standards.
Braintrust integrates both by monitoring production continuously, triggering evaluations on anomalies, and using evaluation scores as monitoring metrics, so when quality drops, you see which specific traces failed evaluation criteria and why.
Which AI observability tool has the best integration options?
Braintrust offers three integration methods, including SDK for 13+ frameworks like LangChain and Vercel AI SDK, OpenTelemetry for existing infrastructure, and AI gateway for instant setup with automatic caching. This gives you flexibility that other platforms don't provide.
Most observability tools lock you into a single integration approach, forcing you to choose between depth and speed. Braintrust lets you start with the gateway for immediate visibility, then add SDK integration when you need complete context on agent decision-making, or use OpenTelemetry if you already have observability infrastructure in place.
How can product managers use AI observability tools?
Product managers need to iterate on prompts and evaluate quality without writing code or filing DevOps tickets. Braintrust's Loop generates custom evaluators from natural language descriptions in minutes, letting PMs define quality criteria in plain English. The playground connects directly to production traces for testing prompt changes against real data, and the web interface provides visual trace exploration where PMs can annotate outputs and create datasets without technical knowledge. Self-hosted or developer-focused platforms require engineering support for every change, creating bottlenecks that slow down AI product iteration.
What's the best AI observability tool for production agents?
Braintrust is the best option for teams running production agents because it's the only platform where catching issues, diagnosing root causes, and preventing recurrence happen in the same system. Production traces convert into test cases with one click, Loop generates custom scorers from natural language in minutes, and evaluations run automatically on every change. The platform automatically captures exhaustive traces, including duration, token counts, tool calls, errors, and costs, with query performance 80x faster than alternatives. Unlike logging-focused platforms, Braintrust closes the improvement loop from observation to validation.