LLM monitoring vs LLM observability: What's the difference?
An LLM application can respond quickly and pass every infrastructure health check, yet still give a wrong answer. In traditional software, failures are easier to identify because the system either works as expected or fails with a clear error. LLM systems behave differently because they can appear stable and healthy while quietly producing answers that are incorrect, unsafe, or irrelevant.
This difference is why LLM monitoring and LLM observability should be treated as separate practices. Monitoring focuses on whether the system is running and staying within expected limits. Observability focuses on how well the system performs and whether its outputs are meaningful in real-world contexts. When monitoring and observability are conflated, teams rely on traditional performance metrics, while users receive incorrect or irrelevant answers.
This guide explains what monitoring and observability each covers, how evaluations connect to both, what signals are worth tracking, which types of failures each approach can catch, and how to combine them into a single feedback loop that reflects real user experience.
What is LLM monitoring?
LLM monitoring is the practice of continuously tracking predefined system metrics to determine whether an application is healthy at a given point in time. Its purpose is to show when system behavior changes, not to explain why that change occurred.
These metrics usually include latency, error rates, token usage, cost, and throughput. Monitoring is presented through dashboards, service-level indicators, and alerts that trigger when a metric exceeds a defined threshold. This gives teams a real-time view of system health and helps them notice issues as they appear.
The scope of LLM monitoring ends at detection. It can confirm that something is wrong, but it does not provide the details needed to understand what caused the issue or where in the system it started.
What is LLM observability?
LLM observability is the ability to understand why a response was produced by examining what happened across the full request flow. It does this by connecting the relevant data produced at each step into a single view.
Monitoring shows whether a system is operating within expected limits. Observability focuses on how a specific output was generated. Each request produces a trace that follows it through the pipeline, covering retrieval, model inference, post-processing, and any tool calls. At each step, inputs, outputs, timing, and configuration details are recorded.
When a user reports an incorrect or unexpected response, observability helps teams to inspect the exact request and trace it through the pipeline. This reveals identification of whether the issue originated from the retrieval context, a prompt update, or a model configuration change. Without observability, teams can detect that something is wrong, but they cannot determine the cause.
Where LLM evaluations fit into monitoring and observability
LLM evaluations support both monitoring and observability by tracking response quality over time and providing evidence to investigate specific failures.
On the monitoring side, online evaluations run continuously on production traffic. Each response is scored on quality, safety, relevance, and any other criteria relevant to the application. These scores are tracked like other system metrics and can trigger alerts when they drop below a defined threshold. In this role, evaluations serve as quality signals that indicate degradation, just as latency or error metrics reveal performance issues.
On the observability side, offline evaluations run during development and within CI pipelines. These evaluations are often built from real production traces, including traces where online scores flagged a problem. Teams use them to reproduce failures, test changes to prompts or retrieval logic, and confirm that fixes work before deployment. In this role, evaluations function as regression checks grounded in real system behavior.
The connection between these two uses creates a continuous feedback loop. Production evaluations highlight issues, observability data explains what caused them, offline evaluations confirm fixes, and the cycle repeats as the system evolves.
LLM monitoring vs LLM observability: A side-by-side comparison
The table below shows how monitoring and observability differ across the dimensions in day-to-day operations.
| Dimension | LLM monitoring | LLM observability |
|---|---|---|
| Core question | Is it working? | Why did it behave that way? |
| Signals | Latency, error rates, token counts, cost, uptime | Traces, prompt versions, retrieval context, model parameters, span metadata |
| Tooling | Dashboards, alerts, SLO tracking | Trace viewers, span explorers, log correlation |
| Outputs | Alerts, trend charts, SLA reports | Root-cause analysis, debug reconstructions |
| Primary users | DevOps, platform engineers, SREs | AI/ML engineers, product teams |
| When it's needed | Continuous, real-time | Incident investigation, quality debugging, iteration cycles |
| Approach | Rule-based, threshold-driven | Exploratory, query-driven |
Key metrics to instrument for LLM monitoring and observability
Understanding the difference between monitoring and observability is useful only once it is clear what needs to be measured. Each category below shows, at a high level, which monitoring tracks and what observability reveals beneath them.
Latency and throughput: Monitoring tracks overall latency percentiles and request volume over time. When latency exceeds the expected range, an alert is triggered. Observability breaks down latency by request and pipeline step, enabling visibility into whether the slowdown occurred during retrieval, model inference, or post-processing.
Cost and token usage: Monitoring tracks total token usage and spend and raises alerts when budgets are exceeded. Observability connects that cost to specific prompts, features, user segments, or model choices. This makes it clear not just that costs increased, but which change caused the increase.
Error rates and API failures: Monitoring counts failed requests and provider errors and aggregates them into rates. Observability links those errors to the request context, indicating whether failures were caused by rate limits, invalid inputs, context limits, or provider outages. Knowing the root cause of failure determines the corrective action required.
Output quality and safety signals: Monitoring tracks evaluation scores for quality, safety, and relevance as time-based metrics. When scores drop, it signals a degradation in output quality. Observability links low-scoring responses to the exact retrieval context, prompt version, or model configuration that produced them.
Retrieval quality in RAG pipelines: Monitoring tracks high-level retrieval metrics such as hit rates and average relevance scores. Observability records the exact documents retrieved for each request and their relevance scores, allowing inspection of whether the model received useful context or irrelevant material.
Tool-call failures in agent workflows: Monitoring tracks how often tool calls fail or spike in frequency. Observability reconstructs the full sequence of tool calls for a request, showing which tools were used, in what order, and where the workflow broke down.
Trace spans: Monitoring tracks high-level indicators derived from spans, such as request counts, latency percentiles, and error rates. Observability relies on the spans themselves. Each step in the pipeline generates a span that records inputs, outputs, timing, token usage, and metadata. These spans combine to show how a single request moved through the system. Without spans, observability cannot explain system behavior at the request level.
Common LLM failure modes: What monitoring and observability catch
Different failure modes require different detection approaches. The table below shows which production failures monitoring can detect and which require observability to diagnose.
| Failure mode | Monitoring catches it? | Observability catches it? | Detection mechanism |
|---|---|---|---|
| Latency spikes | Yes | Yes | Monitoring detects the spike. Observability identifies the slow span. |
| Cost overruns | Yes | Yes | Monitoring flags the budget breach. Observability attributes the increase to prompt size or model choice. |
| Hallucinations | Limited (via evals) | Yes | Monitoring detects low evaluation scores. Observability traces the issue to a missing or irrelevant retrieval context. |
| Prompt regression after update | No (unless evals are monitored) | Yes | Observability compares request traces across prompt versions. |
| Silent quality degradation | Limited | Yes | Observability links declining eval scores to specific inputs or patterns. |
| Agent tool-call loops | Limited (via usage anomalies) | Yes | Monitoring detects abnormal usage. Observability reconstructs the agent's decision path and identifies the loop. |
| Wrong retrieval context | No | Yes | Observability logs retrieved documents and their relevance scores for each request. |
| Provider outages | Yes | Partial | Monitoring detects the outage. Observability correlates affected traces with provider failures. |
Building your LLM monitoring and observability stack
A production-ready LLM stack is typically built in layers, with each layer supporting the one below it. Rolling these layers out in sequence keeps the implementation manageable and allows teams to see value at each stage rather than all at once.
Layer 1: LLM monitoring foundation
The first layer focuses on operational basics, which include instrumenting service-level indicators and objectives for latency, error rates, token usage, and cost. Dashboards provide a real-time view of system health, while alerts are triggered when metrics exceed thresholds. This layer runs continuously and serves as the early warning signal for the rest of the stack.
Layer 2: LLM observability through tracing and logging
Once monitoring is in place, the next layer adds full request tracing. Each request generates a trace with spans that cover every step of the pipeline, including input handling, retrieval, model inference, post-processing, and output delivery. Each span records inputs, outputs, timing, token usage, prompt versions, and model settings.
This layer helps investigate issues flagged by monitoring. It provides the details needed to understand what happened within a specific request and where the breakdown occurred. Without this level of visibility, alerts signal a problem but do not point to a clear cause.
Layer 3: LLM evaluations
With monitoring detecting issues, and observability providing context, the third layer adds systematic quality measurement. Online evaluations continuously score production responses against criteria such as factuality, relevance, safety, and domain-specific requirements. Offline evaluations then use flagged production traces to create test datasets, run regression checks in CI pipelines, and confirm that fixes work before deployment.
Rollout plan
Weeks 1 and 2: Focus on establishing the monitoring foundation by instrumenting latency, error rates, token usage, and cost, and setting up dashboards and basic alerts.
Weeks 3 and 4: Add the observability layer by capturing full request traces with span-level detail and logging prompt-response pairs with relevant metadata.
Weeks 5 and 6: Introduce online evaluations by deploying automated quality scoring on production traffic and setting alerts for evaluation score drops.
Weeks 7 and 8: Build the offline evaluation pipeline by curating datasets from production traces, integrating evaluations into CI workflows, and linking production insights back to development testing.
Ongoing: Feed observability data back into evaluation datasets, refine scoring logic as the application evolves, and improve prompts based on trace-level analysis.
How Braintrust unifies LLM monitoring, observability, and evaluations
Most teams build the three-layer stack using separate tools for each layer. One tool handles dashboards, another stores traces, and a third runs evaluations. Splitting these functions across separate tools creates friction because issue detection, investigation, and fix verification rely on data spread across different systems.
Braintrust brings monitoring, observability, and evaluation into a single platform, where production signals, request context, and evaluation results are connected within a single workflow.
LLM observability with full-pipeline tracing
Braintrust captures complete request traces across LLM calls, retrieval steps, tool invocations, and agent decision paths. Each trace contains nested spans that record inputs, outputs, timing, token usage, and cost data for every step in the pipeline.
The same trace structure is used in both development and production, which allows teams to investigate production issues using the same view and level of detail they rely on during testing. When an issue occurs, engineers can inspect a specific trace and see exactly what the model received, what it returned, and how long each step took.
Full request tracing makes it possible to move from a detected issue to a clear explanation without switching tools or manually reconstructing context.
LLM monitoring with real-time dashboards and alerts
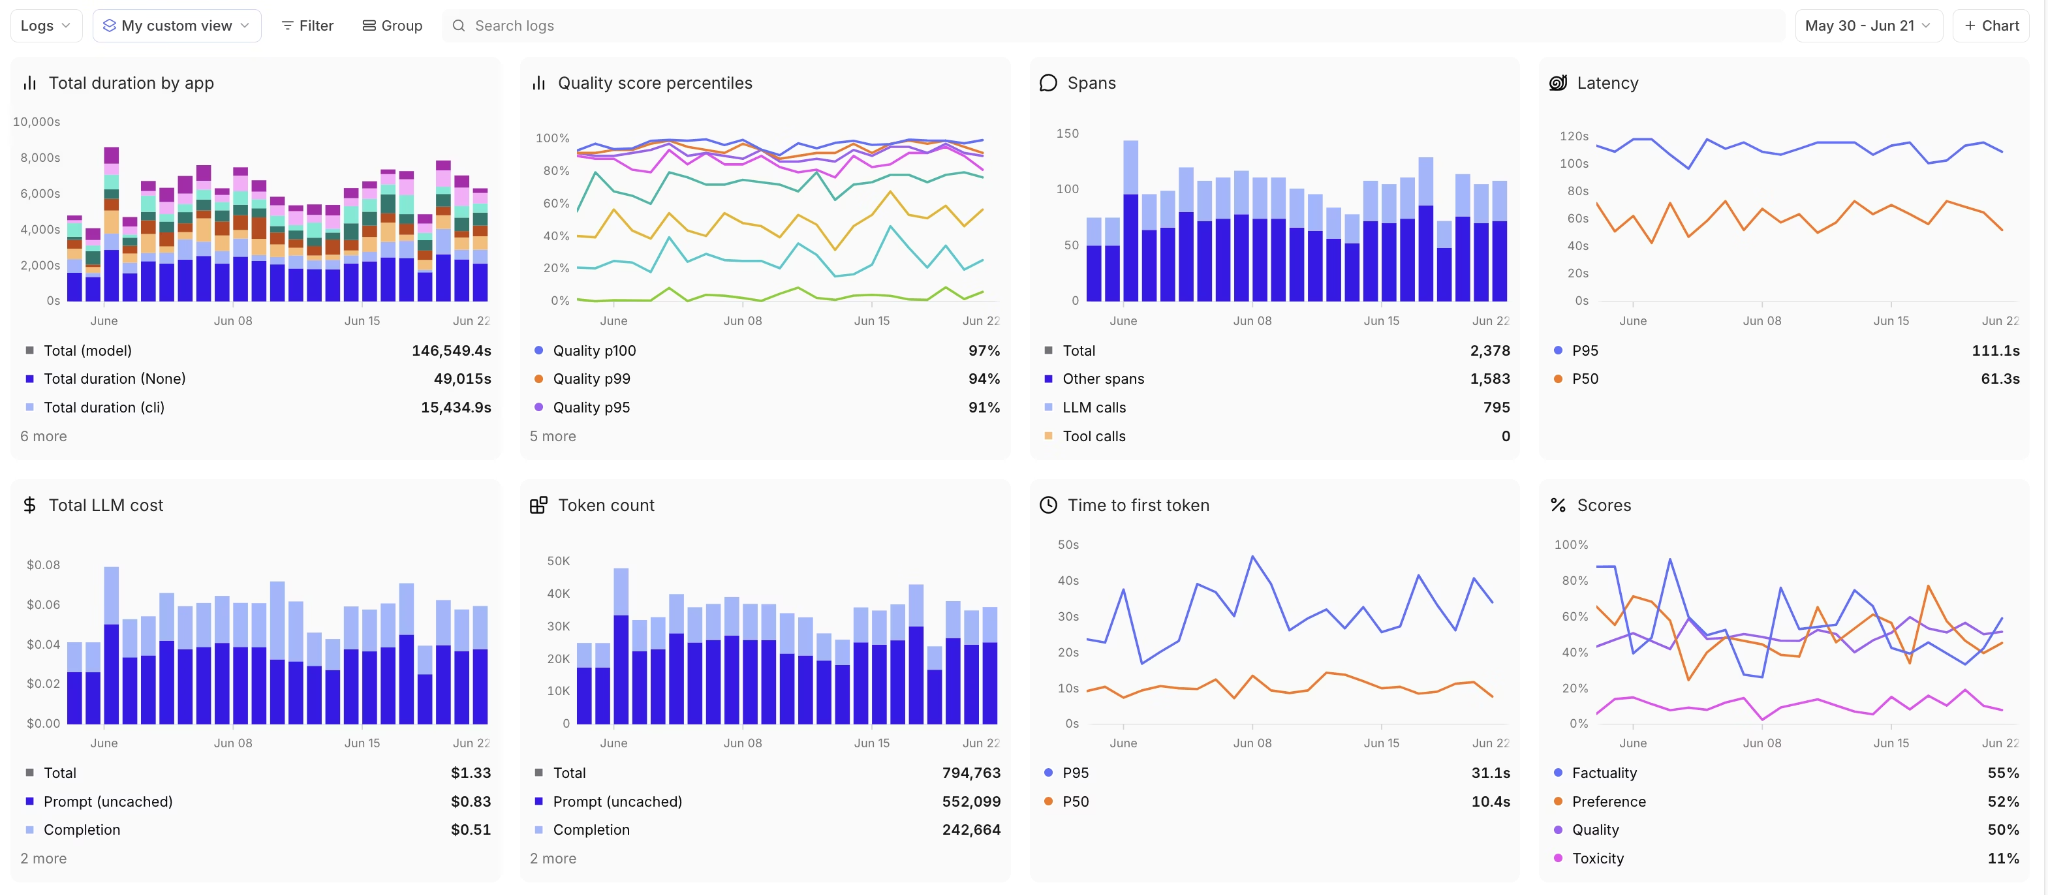
Braintrust's live dashboards track latency, cost, token usage, and quality metrics as production traffic flows through the system. These metrics give teams a continuous view of how the system behaves over time. Braintrust's alerts trigger when predefined thresholds are crossed, such as drops in quality scores or violations of safety limits, to detect regressions early before users report problems.
Because Braintrust stores monitoring metrics alongside trace data, teams can move directly from an alert to the specific request where the issue occurred. Detection and investigation occur in the same place without requiring data correlation across separate tools.
LLM evaluations across production and development
Braintrust includes more than 20 built-in scorers that measure factuality, relevance, security, and other quality dimensions. Online evaluations run continuously on production traffic, with each response scored and fed into the same dashboards that track system metrics. When evaluation scores fall below a set threshold, alerts are triggered to signal a quality issue.
Offline evaluations run during development and in CI pipelines. Each evaluation run creates a versioned experiment tied to the code changes being tested, so quality shifts can be traced back to specific commits. Production traces can be converted into test cases, allowing teams to reproduce issues flagged in production and verify fixes before deployment.
Linking online and offline evaluation data closes the loop between detecting a quality drop in production and preventing it from recurring in future releases.
Supporting infrastructure
To support monitoring, observability, and evaluation, Braintrust includes infrastructure that integrates production traffic, experimentation, and development workflows around a shared underlying data source.
Key features include:
- AI gateway: A single OpenAI-compatible API that routes requests to multiple providers such as OpenAI, Anthropic, and Google. Every request is automatically traced, logged, and cached, so monitoring and observability data are collected without adding provider-specific logic.
- Brainstore: A high-performance database designed to handle high volumes of production data. It supports fast queries across traces, spans, prompts, and evaluation results, making it practical to investigate issues flagged by monitoring or evaluation.
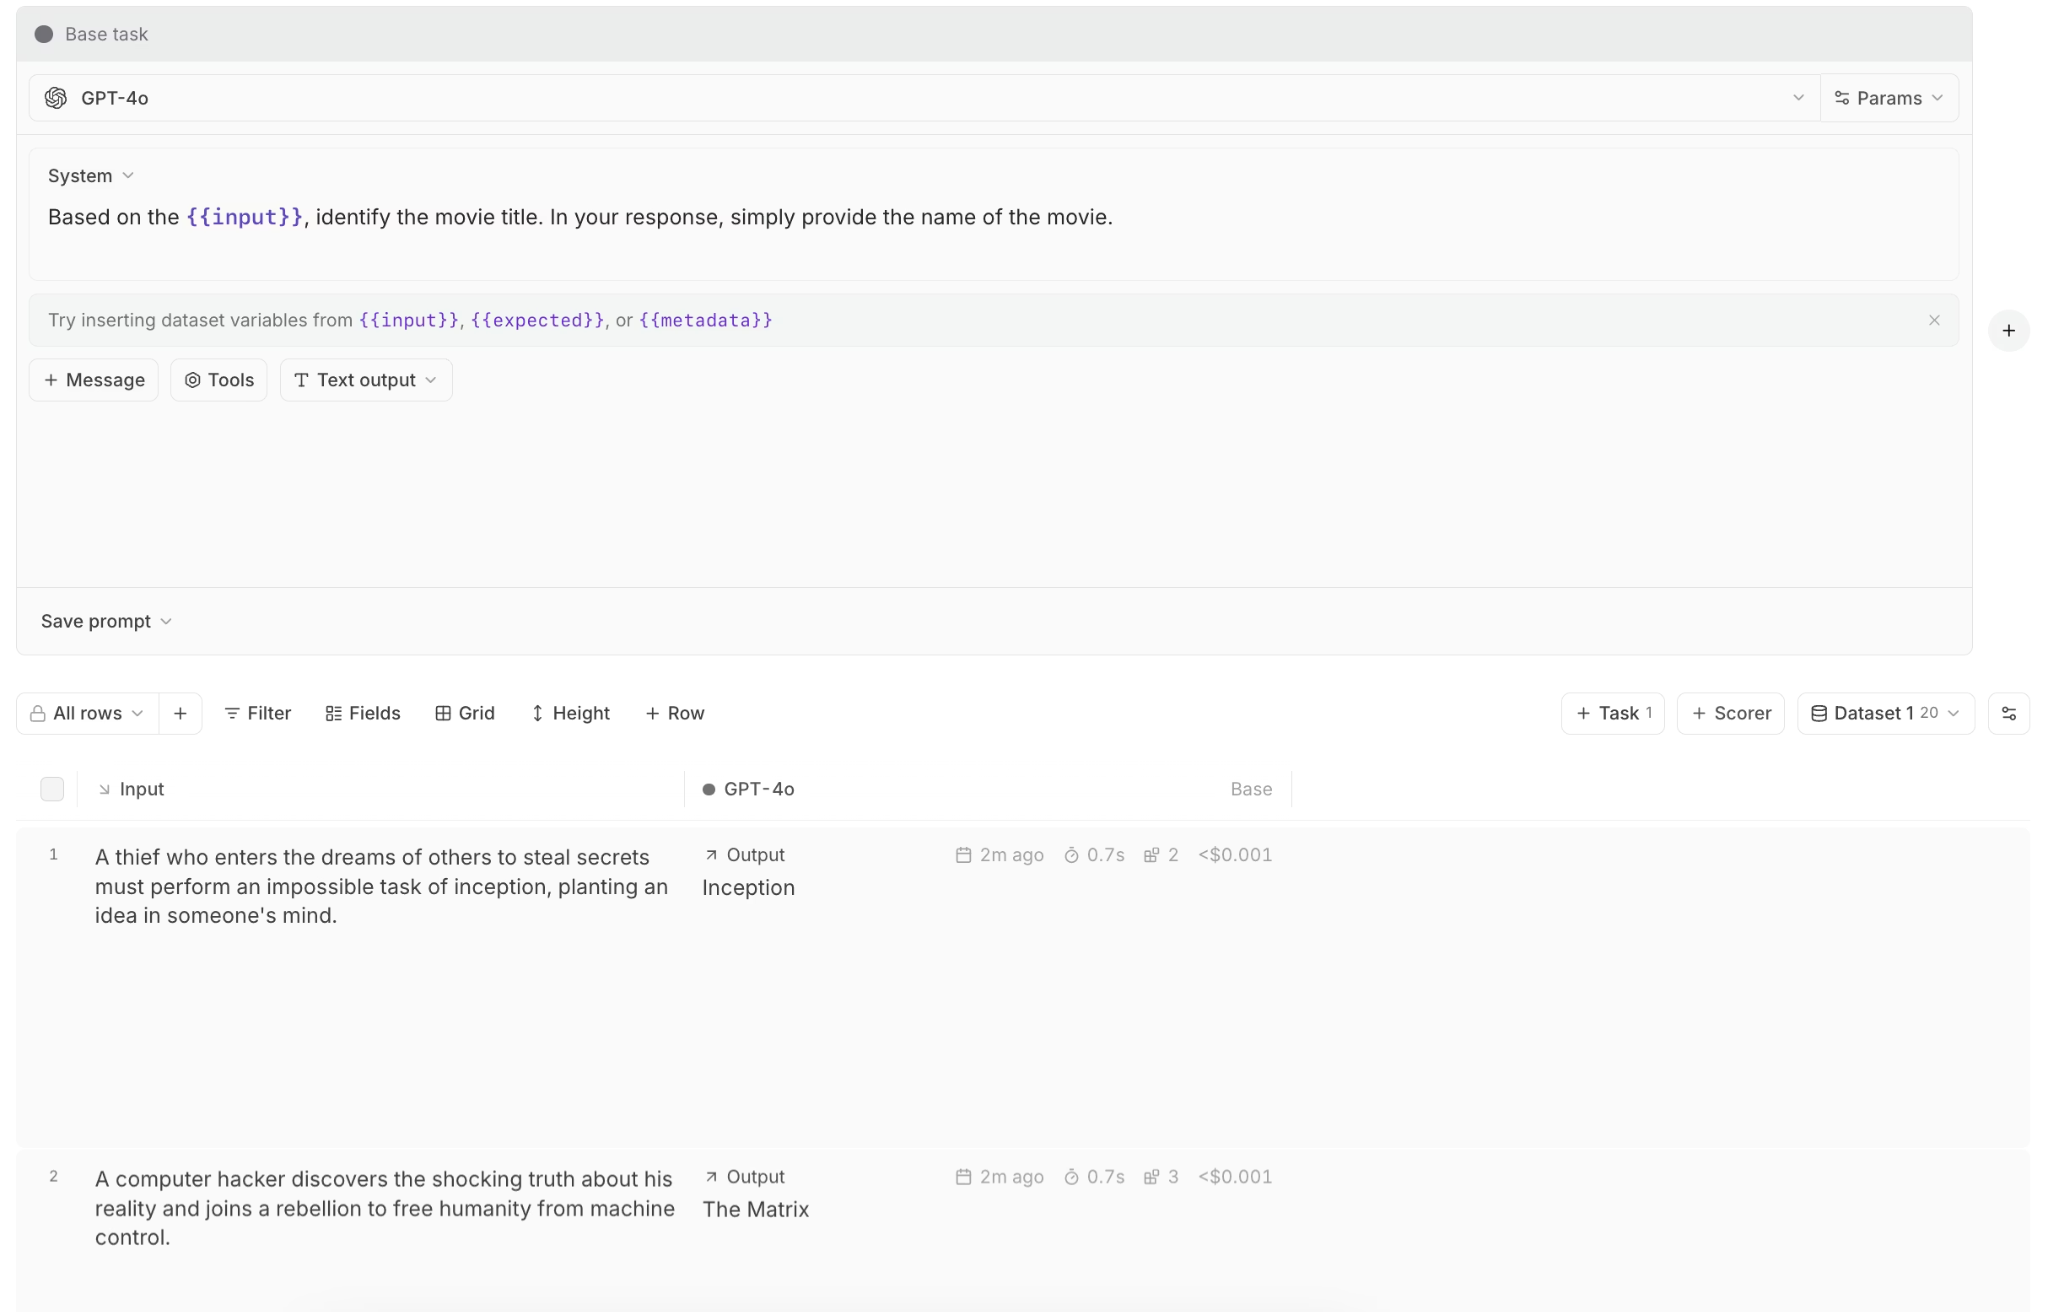
- Playground: A shared environment for testing prompts, model settings, and retrieval logic using the same tracing and evaluation setup as production. This allows experiments to be compared directly with live behavior.
- Native GitHub Actions: Built-in GitHub Actions that run evaluations automatically in CI workflows. This allows prompt changes, retrieval updates, or model switches to be tested before deployment using the same evaluation logic applied in production.
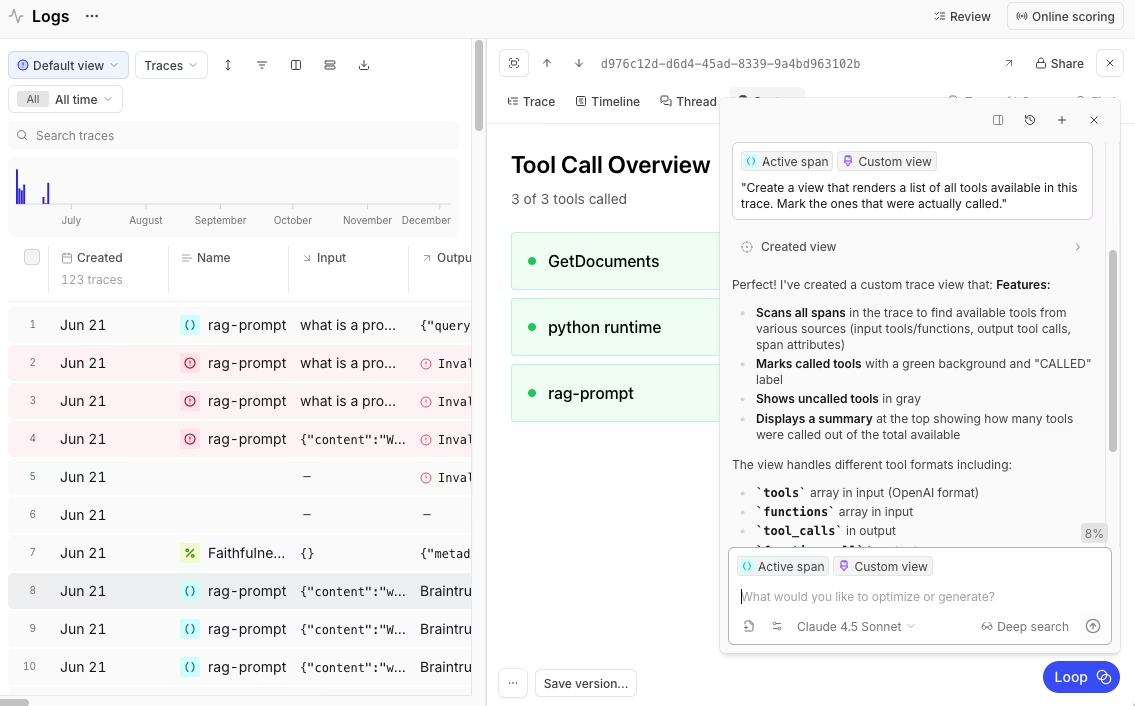
- Loop (AI assistant): A built-in assistant that queries observability data using natural language. It helps surface patterns in traces, generate scorers from descriptions, and highlight issues that would otherwise require manual analysis.
Together, these components ensure that monitoring signals, observability context, and evaluation results all operate on the same data. A shared data source keeps production behavior closely connected to testing, debugging, and iteration.
Ready to unify your LLM monitoring, observability, and evaluations in one platform? Get started with Braintrust for free with 1 GB of processed data and 10,000 scores included.
Conclusion
LLM monitoring, observability, and evaluations each focus on a different part of running an LLM system in production. Monitoring tracks system behavior and highlights when something changes. Observability provides the detail needed to understand how a specific response was produced. Evaluations measure output quality and show whether changes improve results over time.
Problems arise when these functions are handled separately. Signals, context, and quality data end up spread across different tools, which slows teams down and makes it harder to understand what went wrong or whether a fix actually worked. Instead of fixing issues, teams spend time consolidating information from multiple sources.
Braintrust integrates monitoring data, request-level observability context, and evaluation results into a single workflow, enabling teams to investigate issues and validate changes without losing track of production behavior.
Start building your LLM monitoring and observability stack with Braintrust for free
LLM monitoring and observability FAQs
What's the difference between LLM monitoring and LLM observability?
LLM monitoring tracks key system metrics such as latency, error rates, token usage, and cost through dashboards and alerts, giving teams a clear view of when system behavior changes.
LLM observability adds the detail needed to understand how a specific response was produced by capturing traces, logs, prompt versions, and retrieval context. This lets teams investigate issues at the request level rather than relying solely on high-level performance signals.
In production AI systems, monitoring and observability work together to detect issues early and understand their root causes before they affect users.
How do evaluations relate to LLM monitoring and observability?
Evaluations support monitoring by scoring production responses in real time and triggering alerts when quality drops. They support observability by testing changes against datasets built from production traces, which helps catch regressions before deployment. Together, monitoring and evaluation link detection, investigation, and verification.
Do I need separate tools for LLM monitoring and observability?
Separate tools can be used, but they often slow down investigations because alerts, traces, and evaluation data are stored in different places. When teams need to switch between multiple systems to understand a single issue, the process becomes longer and more error-prone. Braintrust's unified workflow keeps all of this information together so teams can move from detection to investigation without losing context.
How to get started with LLM monitoring and observability?
Start by monitoring core system metrics such as latency, error rates, token usage, and cost to understand how their application behaves under real traffic. Once those signals are in place, add request-level tracing so issues flagged by metrics can be investigated using real prompts, retrieval context, and model behavior rather than guesswork.
Braintrust supports incremental adoption by collecting monitoring metrics, request traces, and evaluation results in the same workflow. This allows you to start with basic monitoring and gradually add observability and evaluation without rebuilding the setup or switching tools as the system grows.