- Versioned: Every change is tracked, so experiments can pin to specific versions
- Integrated: Use directly in evaluations and populate from production
- Scalable: Stored in a modern data warehouse without storage limits
Dataset structure
Each record has four top-level fields:- input: Data to recreate the example in your application (required).
- expected: Ideal output or ground truth (optional but recommended for evaluation).
- metadata: Key-value pairs for filtering and grouping (optional).
- tags: Labels for organizing and filtering records (optional).
Create datasets
Upload CSV/JSON
The fastest way to create a dataset is uploading a CSV or JSON file:- Go to Datasets.
- If there are existing datasets, click + Dataset. Otherwise, click Upload CSV/JSON.
- Drag and drop your file in the Upload dataset dialog.
-
Columns automatically map to the
inputfield. Drag and drop them into different categories as needed:- Input: Fields used as inputs for your task.
- Expected: Ground truth or ideal outputs for scoring.
- Metadata: Additional context for filtering and grouping.
- Tags: Labels for organizing and filtering individual records. When you categorize columns as tags, they’re automatically added to your project’s tag configuration. These are per-record tags, distinct from dataset-level tags that organize datasets in the list.
- Do not import: Exclude columns from the dataset.
- Click Import.
If your data includes an
id field, duplicate rows will be deduplicated, with only the last occurrence of each ID kept.Create via SDK
Create datasets programmatically and populate them with records. The approach varies by language:- TypeScript/Python: Use the high-level
initDataset()/init_dataset()method which automatically creates datasets and provides simpleinsert()operations. - Go/Ruby: Use lower-level API methods that require initializing an API client and explicitly managing dataset creation and record insertion.
Generate with Loop
Ask Loop to create a dataset based on your logs or specific criteria: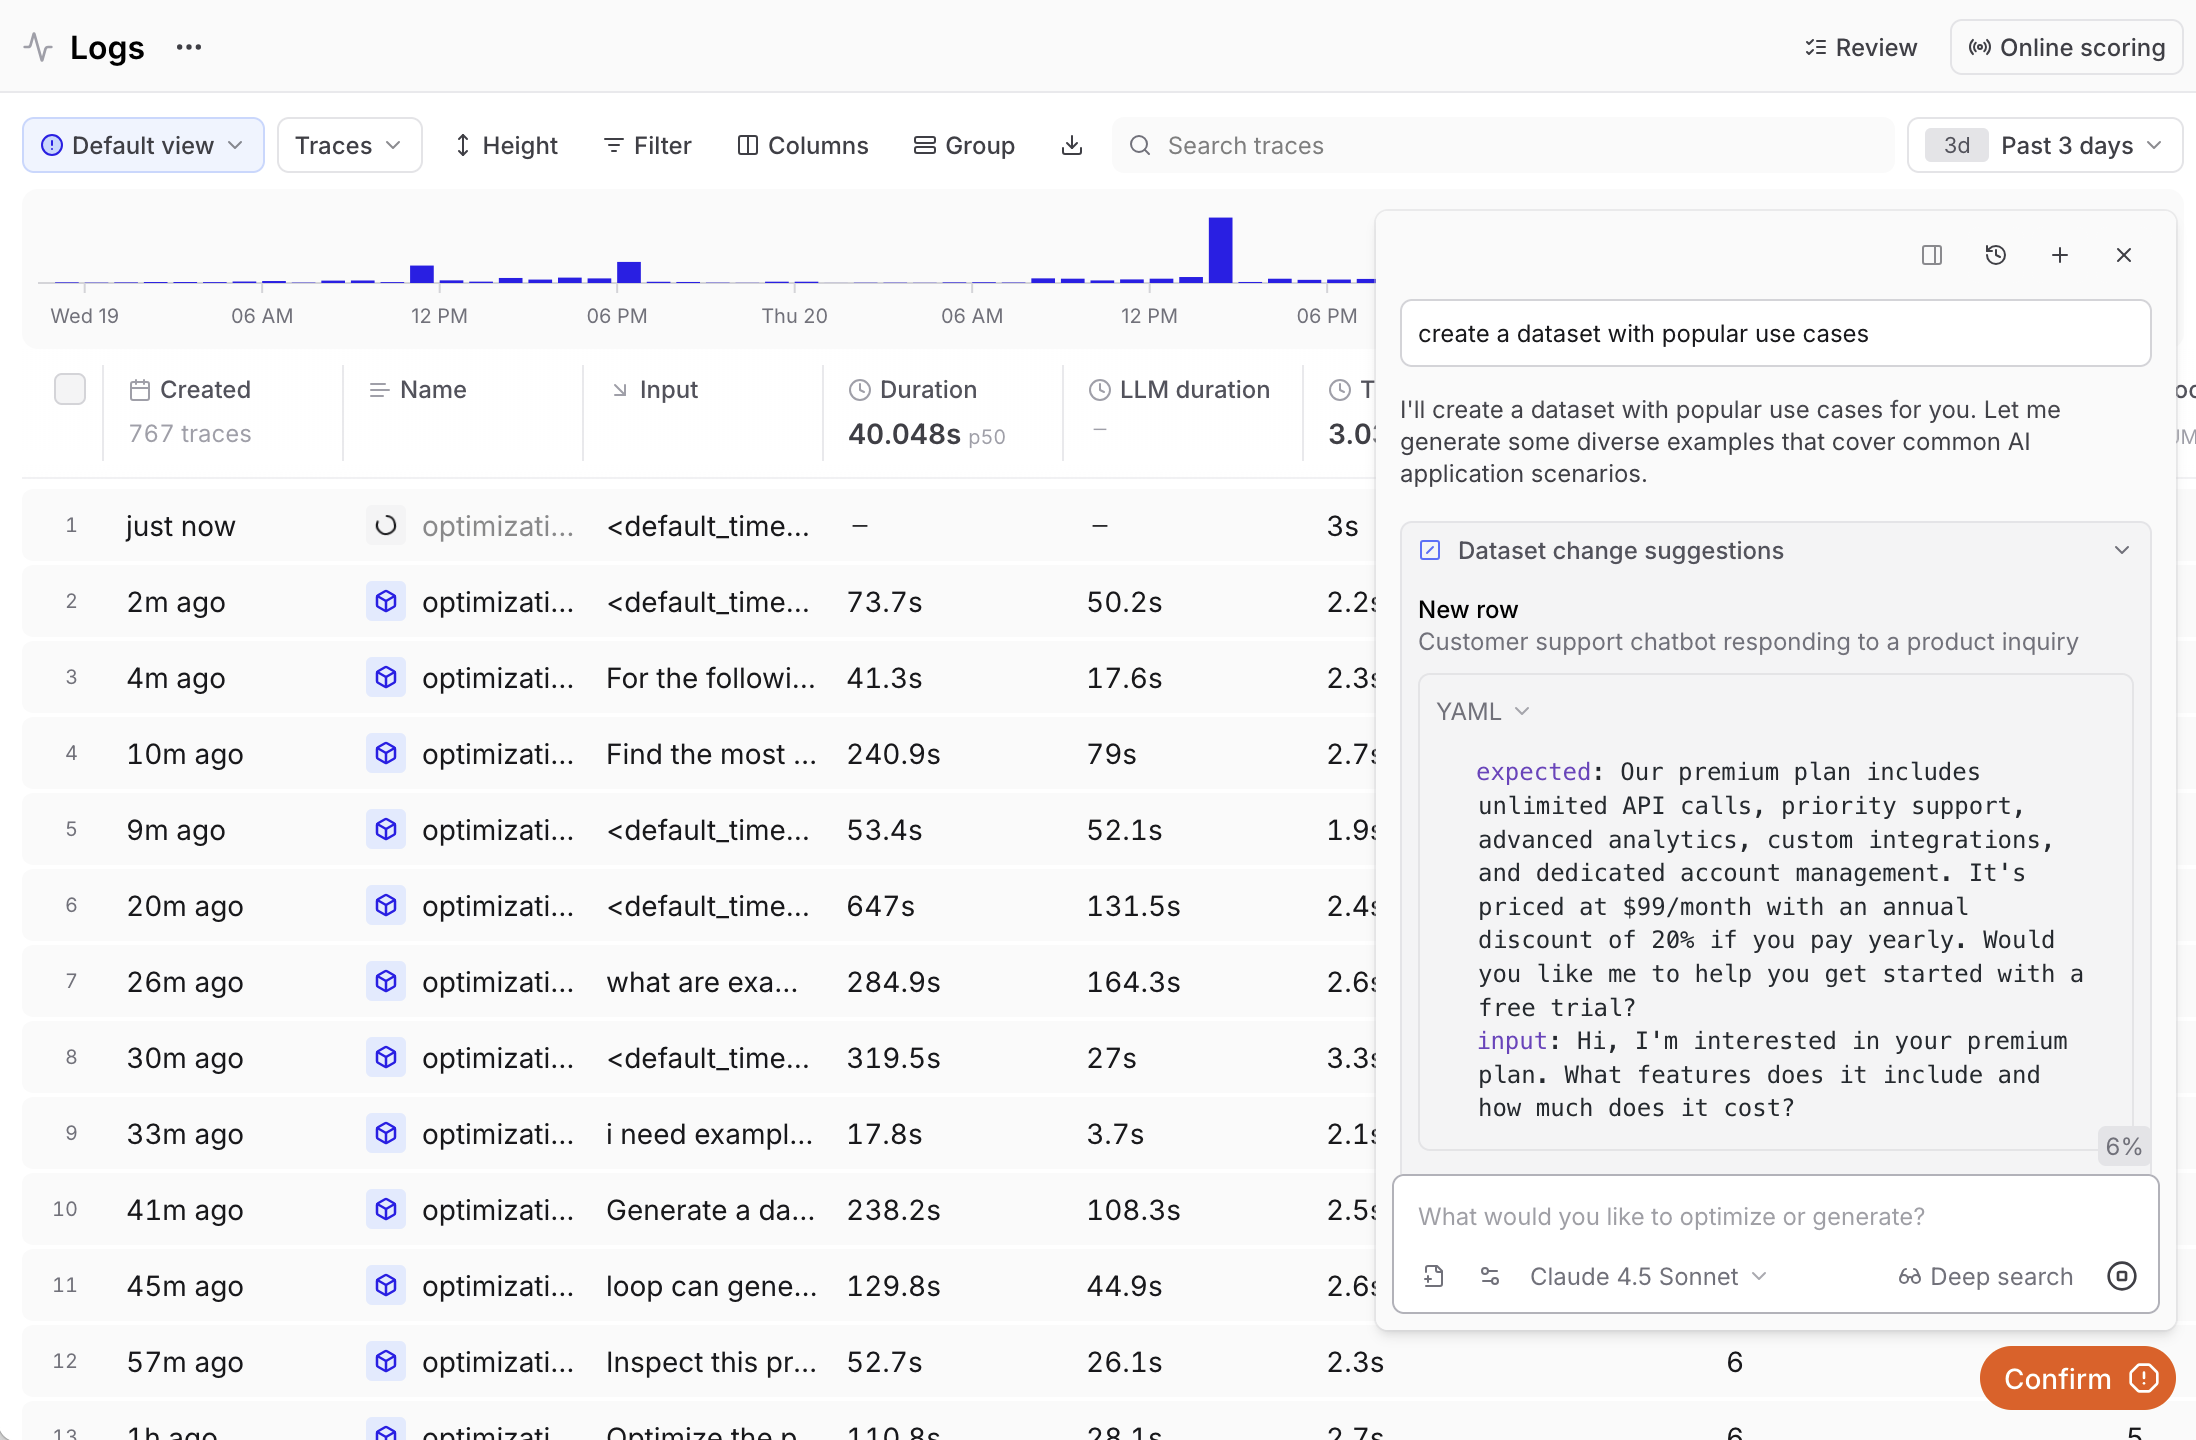
- “Generate a dataset from the highest-scoring examples in this experiment”
- “Create a dataset with the most common inputs in the logs”
From user feedback
User feedback from production provides valuable test cases that reflect real user interactions. Use feedback to create datasets from highly-rated examples or problematic cases. See Capture user feedback for implementation details on logging feedback programmatically. To build datasets from feedback:- Filter logs by feedback scores using the Filter menu:
scores.user_rating > 0.8(SQL) orfilter: scores.user_rating > 0.8(BTQL) for highly-rated examplesmetadata.thumbs_up = falsefor negative feedbackcomment IS NOT NULL and scores.correctness < 0.5for low-scoring feedback with comments
- Select the traces you want to include.
- Select Add to dataset.
- Choose an existing dataset or create a new one.
Log from production
Track user feedback from your application:Manage datasets
Tag and star datasets
You can tag and star datasets to organize and find them in the datasets list. Tagging a dataset adds metadata that can be used to filter and group records, while starring a dataset causes it to sort first in the datasets table and dataset picker dropdowns. To tag datasets:- Go to Datasets.
- Select one or more datasets.
- Click Tag in the toolbar.
- Select or create tags to apply.
Tags are configured at the project level and shared across all objects — logs, experiments, dataset records, and entire datasets. See project tag settings.
Filter records
Read and filter datasets using_internal_btql to control which records are returned:
Update records
Update existing records byid:
update() method applies a merge strategy: only the fields you provide will be updated, and all other existing fields in the record will remain unchanged.
Delete records
Remove records programmatically byid:
Flush records
The Braintrust SDK flushes records asynchronously and installs exit handlers, but these hooks are not always respected (e.g., by certain runtimes or when exiting a process abruptly). Callflush() to ensure records are written:
Create custom columns
Extract values from records using custom columns. Use SQL expressions to surface important fields directly in the table.Create custom table views
To create or update a custom table view:- Apply the filters and display settings you want.
- Open the menu and select Save view… or Save view as….
Custom table views are visible to all project members. Creating or editing a table view requires the Update project permission.
Set default table views
You can set default views at two levels:- Organization default: Visible to all members when they open the page. This applies per page — for example, you can set separate organization defaults for Logs, Experiments, and Review. To set an organization default, you need the Manage settings organization permission (included by default in the Owner role). See Access control for details.
- Personal default: Overrides the organization default for you only. Personal defaults are stored in your browser, so they do not carry over across devices or browsers.
- Switch to the view you want by selecting it from the menu.
- Open the menu again and hover over the currently selected view to reveal its submenu.
- Choose Set as personal default view or Set as organization default view.
- Open the menu and hover over the currently selected view to reveal its submenu.
- Choose Clear personal default view or Clear organization default view.
Use in evaluations
Use datasets as the data source for evaluations. You can pass datasets directly or convert experiment results into dataset format.Pass datasets directly
Pass datasets directly toEval():
Convert experiment results
Convert experiment results into dataset format usingasDataset()/as_dataset(). This is useful for iterative improvement workflows where you want to use the results of one experiment as the baseline for future experiments:
Review datasets
You can configure human review workflows to label and evaluate dataset records with your team.Configure review scores
Configure categorical scores to allow reviewers to rapidly label records. See Configure review scores for details.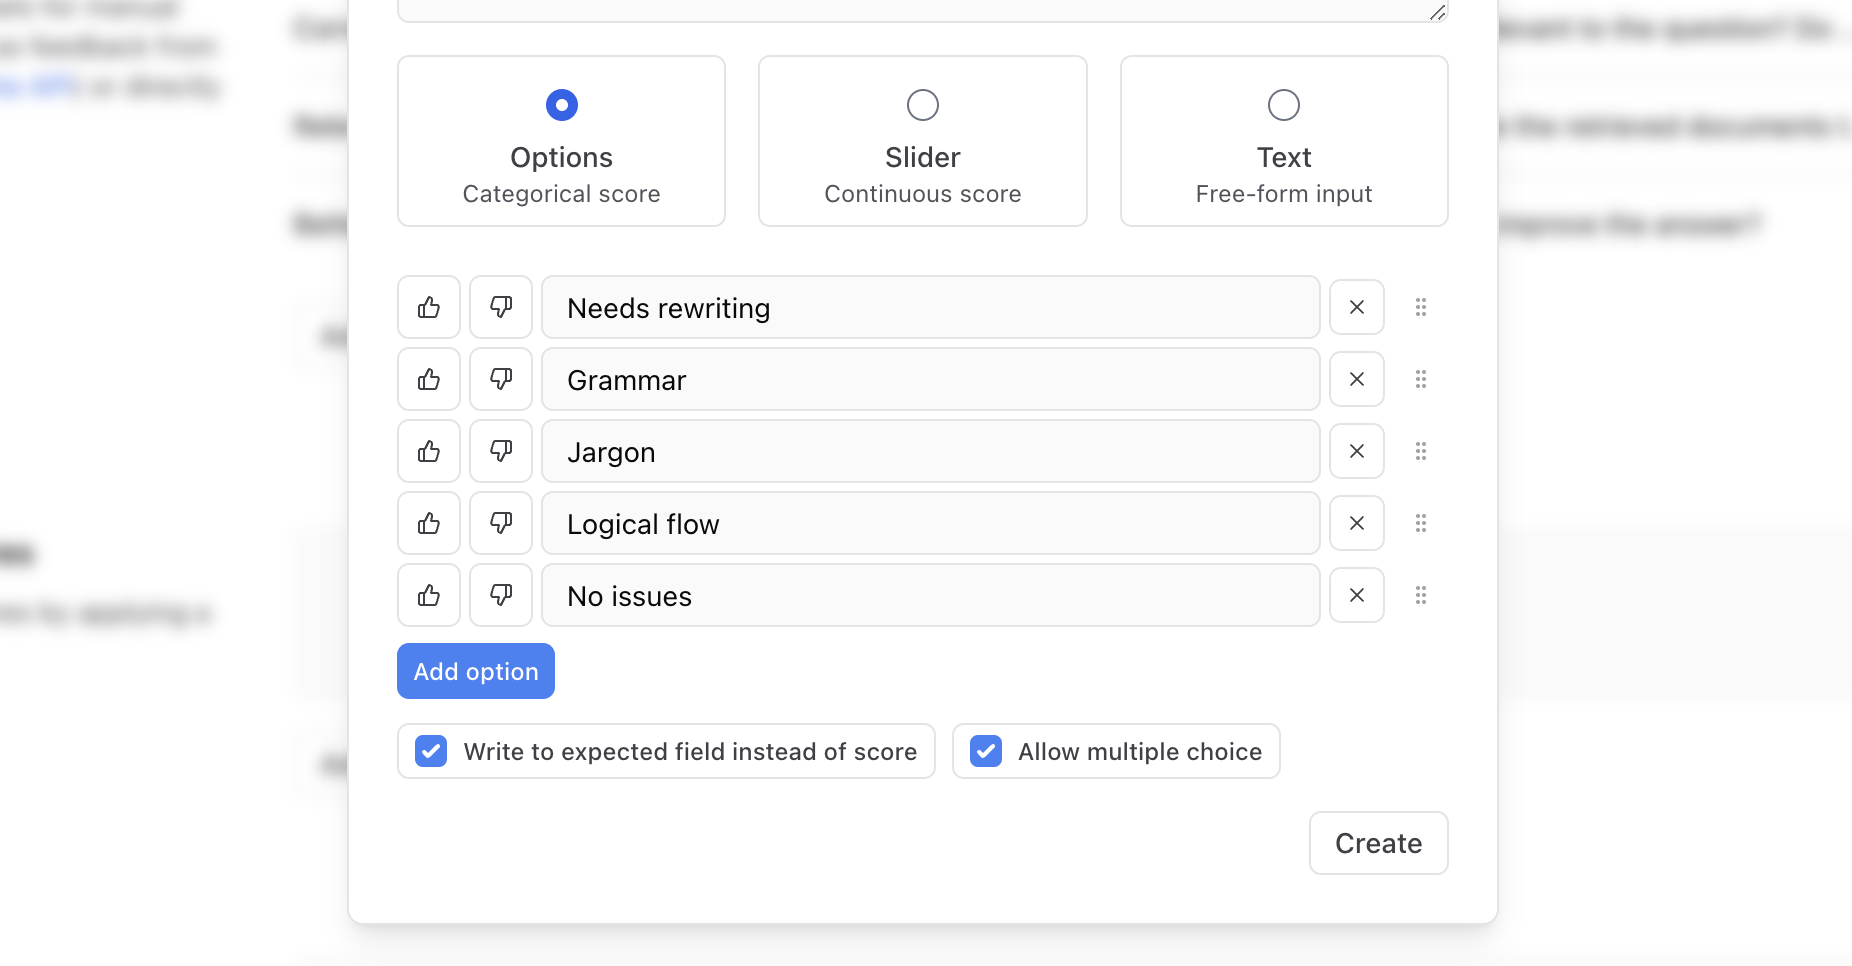
Assign rows for review
Assign dataset rows to team members for review, analysis, or follow-up action. Assignments are particularly useful for distributing review work across multiple team members. See Assign rows for review for details.Define schemas
If you want to ensure all records have the same structure or make editing easier, define JSON schemas for your dataset fields. Schemas are particularly useful when multiple team members are manually adding records or when you need strict data validation. Dataset schemas enable:- Validation: Catch structural errors when adding or editing records.
- Form-based editing: Edit records with intuitive forms instead of raw JSON.
- Documentation: Make field expectations explicit for your team.
- Go to your dataset.
- Click Field schemas in the toolbar.
- Select the field you want to define a schema for (
input,expected, ormetadata). - Click Infer schema to automatically generate a schema from the first 100 records, or manually define your schema structure.
- Toggle Enforce to enable validation. When enabled:
- New records must conform or show validation errors.
- Existing non-conforming records display warnings.
- Form editing validates input as you type.
Enforcement is UI-only and doesn’t affect SDK inserts or updates.
Track performance
Monitor how dataset rows perform across experiments.View experiment runs
See all experiments that used a dataset:- Go to your dataset page.
- In the right panel, select Runs.
- Review performance metrics across experiments.
Filter experiment runs
To narrow down the list of experiment runs, you can filter by time range or use SQL. Filter by time range: Click and drag across any region of the chart to select a time range. The table below updates to show only experiments in that range. To clear the filter, click clear. This helps you focus on specific periods, like recent experiments or historical baselines. Filter with SQL: Select Filter and use the Basic tab for common filters, or switch to SQL to write more precise SQL queries based on criteria like score thresholds, time ranges, or experiment names. Common filtering examples:Filter states are persisted in the URL, allowing you to bookmark or share specific filtered views of experiment runs.
Analyze per-row performance
See how individual rows perform:- Select a row in the dataset table.
- In the right panel, select Runs.
- Review the row’s metrics across experiments.
This view only shows experiments that set the
origin field in eval traces. Look for patterns:
- Consistently low scores suggest ambiguous expectations.
- Failures across experiments indicate edge cases.
- High variance suggests instability.
Multimodal datasets
You can store and process images and other file types in your datasets. There are several ways to use files in Braintrust:- Image URLs (most performant) - Keep datasets lightweight with external image references.
- Base64 (least performant) - Encode images directly in records.
- Attachments (easiest to manage) - Store files directly in Braintrust.
- External attachments - Reference files in your own object stores.
Next steps
- Add human feedback to label datasets.
- Run evaluations using your datasets.
- Use the Loop to generate and optimize datasets.
- Read the SQL reference for advanced filtering.