What is LLM observability? (Tracing, evals, and monitoring explained)
An LLM application can return a successful response while still producing incorrect, harmful, or low-quality output. Traditional observability tracks signals like uptime, error rates, and latency, but these metrics only confirm that the system executed without failure. They do not indicate whether the model's response was grounded, relevant, or appropriate for the user. As a result, an application can appear healthy on standard dashboards while consistently delivering bad answers.
LLM observability addresses this limitation by instrumenting AI applications to capture how a response is produced across the full execution path, which includes the initial user input, retrieval steps, prompt construction, tool calls, and the final generated output. Instead of answering whether the system is running, LLM observability tracks output quality and the steps that led to failures.
This guide provides a framework for implementing LLM observability in production. It explains how LLM requests are traced across execution steps, how outputs are evaluated against quality criteria, and how monitoring and regression checks prevent failures from reaching users.
Why LLM observability is essential for production AI
LLM applications run multiple steps per user request. These steps can include retrieval, prompt construction, model calls, and tool execution. A problem in any one step can affect the final response, even if the request completes successfully and no system errors occur. Traditional monitoring cannot show where these problems happen or how they affect output quality. The points below explain the main production issues teams face without LLM observability.
Debuggability: When an output is wrong, the cause can come from any step in the request. Retrieved documents may be irrelevant, prompts may be incomplete, or tool calls may return unexpected results. Without visibility into each step, engineers have to rely on logs and assumptions instead of seeing exactly what happened.
Reliability: LLMs can produce different outputs for the same input. Behavior that looks correct in testing can change in production as real user inputs vary. Without measuring quality on live traffic, teams cannot detect these changes early or confirm that fixes actually improve results.
Cost control: LLM costs scale quickly for extra model calls, large context windows, repeated retries, and inefficient agent behavior. Without observability data, teams cannot see which parts of the system are driving usage or where changes would reduce spend.
Safety and compliance: Production systems must handle risks such as prompt injection, sensitive data in outputs, and policy violations. These issues are not visible through latency or error metrics. Teams need records of inputs, outputs, and execution steps to detect problems and investigate incidents.
LLM observability provides the visibility needed to identify how requests run and understand why outputs fail in production.
Understanding tracing in LLM applications
Tracing records how a single request runs through an LLM application. It captures each model call, retrieval step, tool invocation, and intermediate operation that contributes to the final response. Instead of treating a request as a single black box, tracing shows the full sequence of steps that executed.
Each step in that sequence is recorded as a span. Spans are linked in a parent-child structure that reflects execution order. Together, these spans form a trace that shows how the request progressed from the initial input to the final output.
What a trace looks like in practice
Consider an assistant that answers questions using internal documents. When a user submits a query, the application embeds the input, runs a vector search, builds a prompt from the retrieved content, sends the prompt to a model, executes a tool call if required, and then generates a final response. Each of these operations is recorded as a span. Viewed together, they show exactly how the request was handled.
Each span records key data needed for debugging. This includes inputs and outputs, latency and token usage, model parameters, error states, and identifying metadata such as user or session IDs. When a user reports a bad response, an engineer can inspect the trace to see which documents were retrieved, what prompt was sent, and which step caused the output to degrade.
Why LLM tracing requires different infrastructure
Traditional distributed tracing systems are built for small payloads. In LLM applications, spans often include full prompts, retrieved documents, and model outputs, which are much larger. Complex agent workflows can generate traces that grow quickly in size. Many existing APM backends are not designed to store or query this kind of data efficiently, which limits their usefulness for LLM debugging. LLM tracing relies on infrastructure that can handle large trace payloads and query them efficiently across many requests.
The OpenTelemetry standard
OpenTelemetry provides a common way to instrument LLM applications for tracing. Its GenAI Semantic Conventions define a consistent schema for capturing model-specific data such as model name, provider, token usage, and finish reason. Instrumenting with OpenTelemetry allows teams to collect tracing data once and route it to different backends without changing application code, which helps keep observability setups flexible as systems evolve.
Tracing makes it possible to see how a request failed. Evaluation builds on this by measuring whether the output was acceptable in the first place.
How evals measure LLM output quality
LLM behavior cannot be validated through code inspection alone. The same input can produce different outputs across runs, and output quality depends on prompts, model versions, retrieved context, and system state. Because of this, teams have to measure behavior directly rather than assume correctness from implementation details.
Evals provide a structured way to measure output quality. They run the application against defined inputs and score the results using repeatable criteria. These scores make it possible to compare behavior across prompt changes, model updates, and system revisions.
Offline evals
Offline evals run before changes reach production. Teams build datasets of representative inputs with expected outcomes and run their application against those datasets. Automated checks score each output for criteria such as factual accuracy, relevance, safety, or domain-specific requirements.
Offline evals act as regression tests. When prompts, models, or retrieval logic change, eval results show which cases improved, which degraded, and by how much. Changes that fail to meet quality thresholds can be blocked before deployment.
Online evals
Online evals run against live production traffic. Automated scorers assess real user interactions as they occur, without adding noticeable latency to measure quality under real usage conditions rather than relying only on test datasets.
Online evals surface issues that offline tests cannot cover. Real user inputs vary widely, and production behavior often reveals failure patterns that do not appear in controlled test cases.
Scoring methods
Most eval systems rely on a small set of scoring approaches.
- LLM-as-a-judge uses one model to assess another model's output against defined criteria, such as whether a response is grounded in the provided context.
- Rule-based checks use deterministic logic such as format validation, pattern matching, or keyword detection for outputs that must follow strict rules.
- Human review adds expert judgment for edge cases and for validating that automated scores match real quality expectations.
The eval feedback loop
Evals are most effective when offline and online results are connected. Online evals identify failure patterns in production, such as a class of queries that consistently score poorly. Those cases are added to offline datasets, where fixes can be tested and verified before deployment.
Over time, this loop expands test coverage and reduces repeat failures. Quality improvements made in development can be confirmed in production, and production issues can be translated into concrete test cases.
Monitoring LLM performance and quality over time
Tracing explains what happened in individual requests, and evals assign quality scores to specific outputs. Monitoring looks at these signals over time to show whether the system is stable, degrading, or changing in ways that require attention.
Monitoring aggregates data across many requests to spot trends that are not visible when inspecting single traces, such as gradual quality drops, rising costs, or increasing latency in specific parts of the system.
Key metrics to track
Latency should be tracked across percentiles rather than averages. Token-based generation often creates long-tail delays that average latency hides. Monitoring higher percentiles helps teams identify slow paths that affect user experience.
Cost should be tracked by token usage across requests, features, and user segments. This makes it easier to see where spend is concentrated and which parts of the system contribute most to usage growth.
Errors should be separated by type. Infrastructure issues such as timeouts or rate limits need different handling than model-level problems such as malformed outputs or refusals.
Quality scores from evals should be tracked in aggregate. Teams often define thresholds for acceptable quality and monitor whether responses stay within those bounds over time.
Input and output patterns should also be monitored. Changes in user queries, retrieved content, or model behavior can indicate drift that affects output quality.
Alerting and response
Monitoring is useful only if it leads to action. Thresholds and alerts help teams detect latency spikes, cost increases, quality drops, and safety issues early.
When an alert fires, teams can use tracing to inspect affected requests and eval results to understand the scope and cause of the issue. This shortens investigation time and reduces reliance on user reports.
Monitoring connects individual request data to system-wide behavior. It provides the context needed to decide when an issue is isolated and when it represents a broader production problem.
How tracing, evaluation, and monitoring work together
Tracing, evals, and monitoring are used together as a single observability workflow in production systems. Monitoring shows when system behavior changes across many requests, such as shifts in latency, cost, error rates, or quality scores. These signals indicate that a problem may exist, but they do not explain how the issue occurred.
Tracing is used to investigate those changes at the request level. Teams inspect individual executions to see how retrieval, prompts, tool calls, and model outputs contributed to a response. Inspecting individual executions makes it possible to identify where a request deviated from expected behavior and which step caused the failure.
Evals are used to measure impact and validate fixes. They assign quality scores to outputs so teams can confirm whether changes improve results. Offline evals help test fixes before deployment, and online evals confirm that quality holds under real production traffic.
Together, these steps form a continuous workflow from detection to investigation to validation, allowing teams to find issues, understand their cause, and confirm that fixes prevent the same problems from recurring.
Common LLM failure modes and what catches them
LLM failures in production tend to follow recurring patterns. Some affect output quality, others affect cost, latency, or safety, and many are not visible through traditional monitoring alone. The table below shows how observability helps detect common failure modes.
| Failure mode | Observability signal |
|---|---|
| Hallucinated or fabricated responses | Online evals that score factual grounding against retrieved context, supported by human review for ambiguous cases |
| Retrieval returning irrelevant or outdated content | Tracing to inspect retrieved documents per request, combined with monitoring for retrieval drift over time |
| Prompt regressions after updates | Offline evals in CI that detect quality drops across a fixed test dataset before deployment |
| Rising token usage and unexpected cost growth | Monitoring of token usage and per-request cost, with alerts when thresholds are exceeded |
| Slow or inconsistent response times | P99 latency monitoring paired with tracing to identify slow steps in request execution |
| Prompt injection or unintended data exposure | Safety evals on production traffic with alerts when flagged outputs exceed defined limits |
Observability provides the context teams need to investigate these issues in production systems and suggests fixes that prevent the same failures from recurring.
How to get started with LLM observability
Getting started with LLM observability is easier when done in stages. Each step builds on the data collected in the previous one, allowing teams to improve visibility without changing everything at once.
Step 1: Add tracing
Start by instrumenting all LLM calls to capture inputs, outputs, latency, token usage, and errors for each request. This includes retrieval steps, tool calls, and intermediate model responses.
Tracing alone provides immediate value. It allows teams to inspect individual requests end to end and understand how a response was produced, which shortens debugging time even before evals or dashboards are in place.
Step 2: Add evaluation
Once tracing is in place, add automated evals. Begin with a small set of checks focused on factuality, relevance, and safety. Run these evals on production traffic and build a small offline dataset using real requests collected from traces to establish a baseline for output quality. Teams can now measure whether changes improve results and catch regressions before they reach users.
Step 3: Add monitoring and alerts
Next, aggregate tracing and eval data into monitoring views. Track latency, cost, error rates, and quality scores over time. Define thresholds for acceptable behavior and configure alerts for deviations.
Monitoring helps teams detect issues early and understand whether a problem is isolated or affecting a broader set of requests.
Step 4: Close the loop
Use production failures to expand offline eval datasets. When an issue is detected, add the affected cases to regression tests and validate fixes before deployment. Continue monitoring after release to confirm that quality remains stable.
Over time, this process improves coverage and reduces repeat failures by turning production incidents into test cases.
Why Braintrust is the best choice for LLM observability
When tracing, evaluation, and monitoring are handled separately, production failures are harder to debug. Braintrust provides tracing, evals, monitoring, and iteration in a single system, using shared data and a consistent workflow.
Tracing built for LLM applications
Braintrust records complete traces for every request. Each trace captures model calls, retrieval steps, tool executions, latency, token usage, and errors. Prompts, retrieved documents, and model outputs are stored as part of the trace, making it possible to inspect how a response was produced.
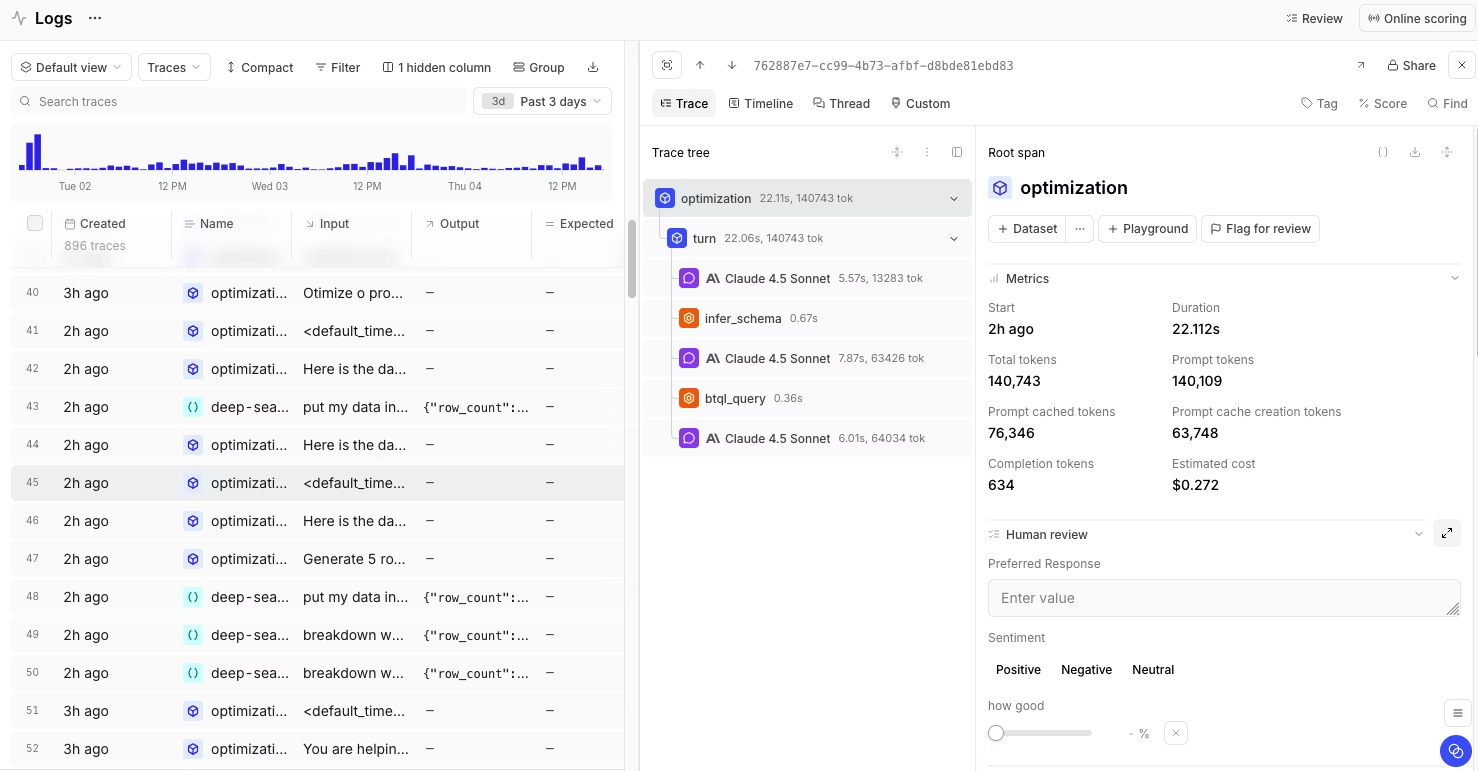
Traces are shown as a clear execution tree. Teams can quickly see which step caused a failure and whether the issue came from retrieval, prompting, tool usage, or the model itself. The same tracing format is used in both production logging and eval runs, which keeps debugging and testing aligned.
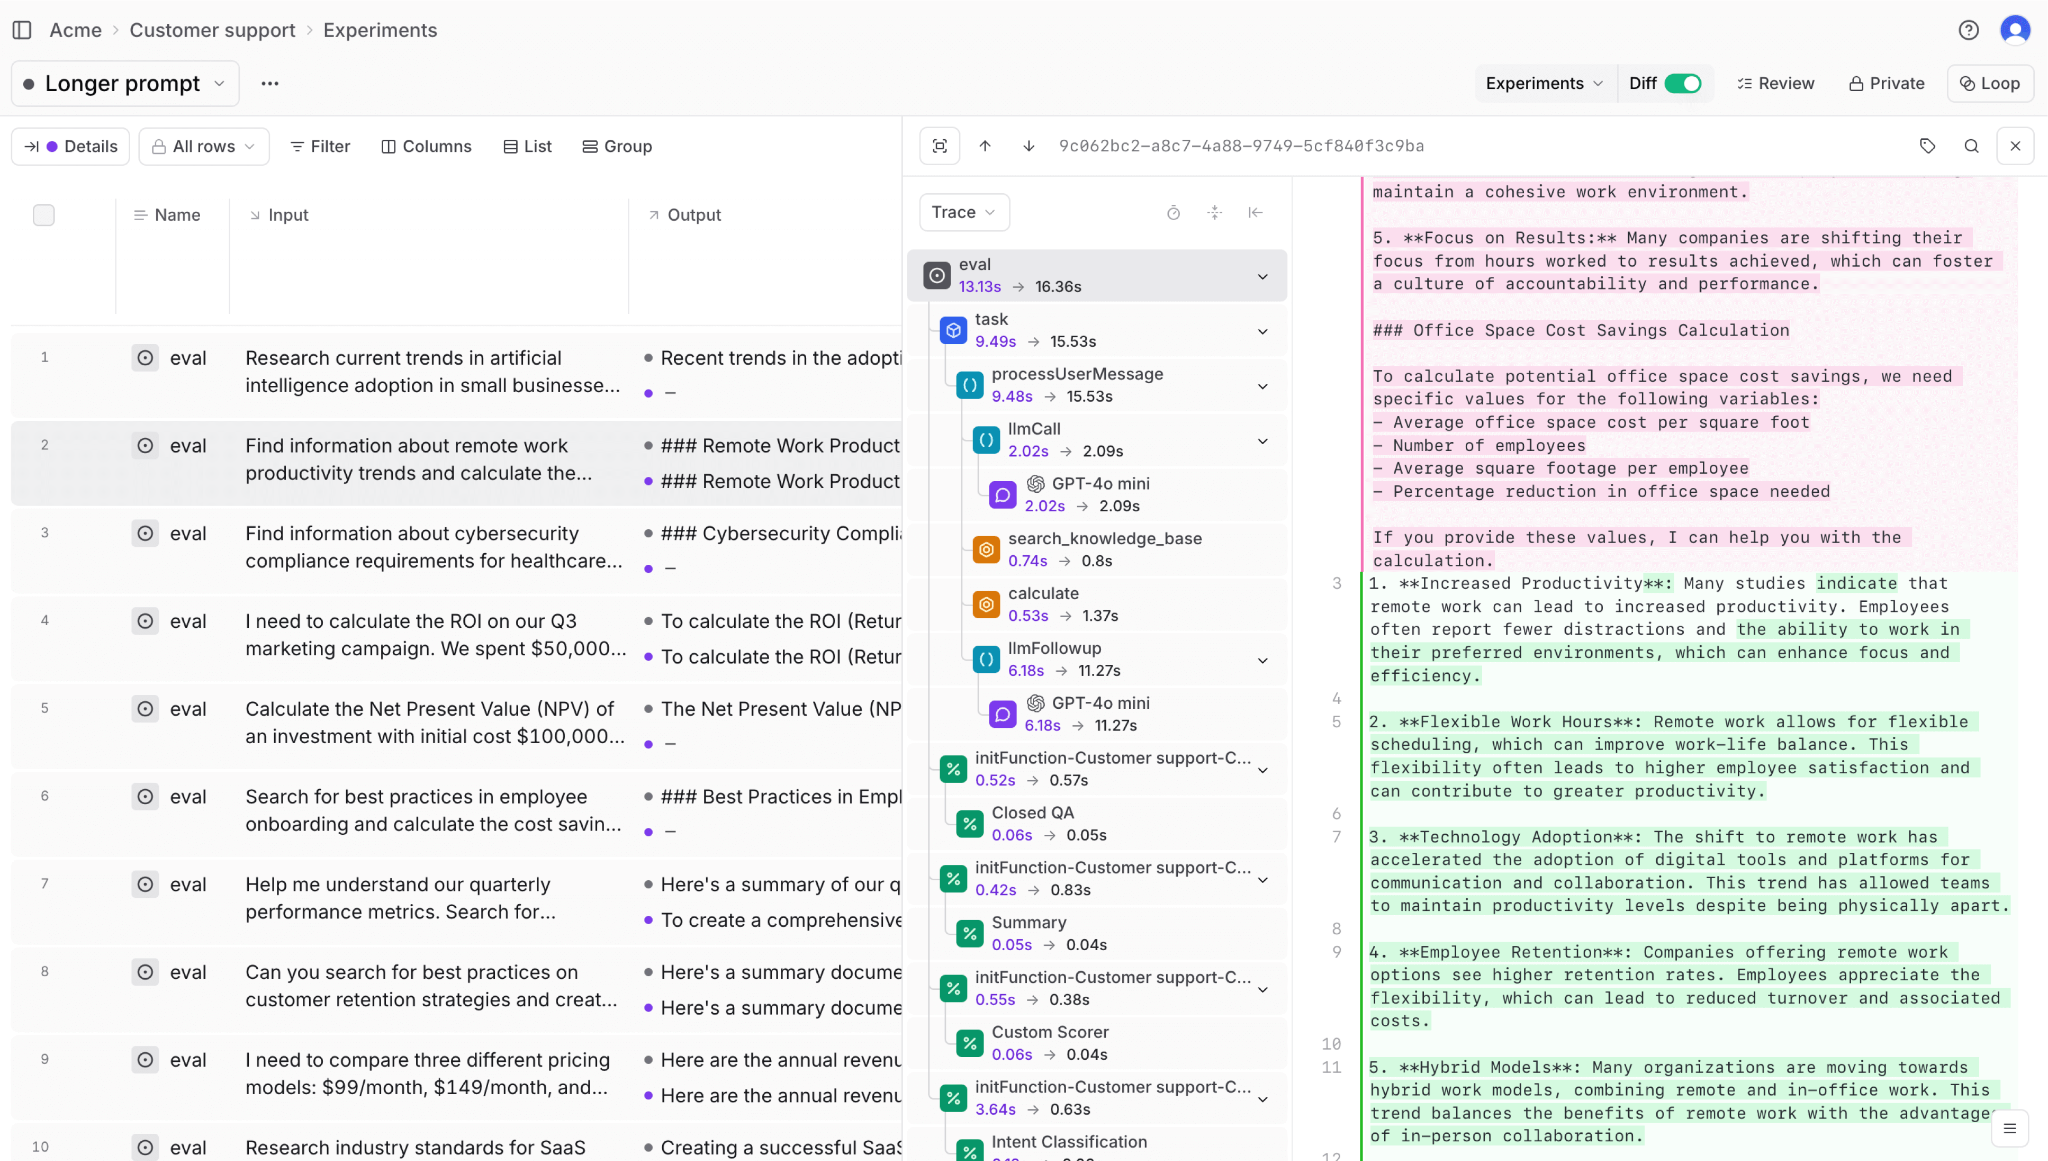
Evaluation across development and production
Braintrust supports both offline and online evals using the same scoring logic. Production traces can be converted into eval test cases with one click, without manual data copying or format changes. This allows teams to turn real failures into regression tests.
Braintrust includes built-in scorers and the option to create custom scorers for factuality, relevance, and safety. Loop, Braintrust's AI assistant, generates scorers from plain language descriptions, allowing non-engineers to define quality criteria without writing code.
Monitoring quality, cost, and reliability
Braintrust provides monitoring dashboards that aggregate tracing and eval data over time. Teams can track latency, token usage, cost, error rates, and quality scores across features, users, and deployments.
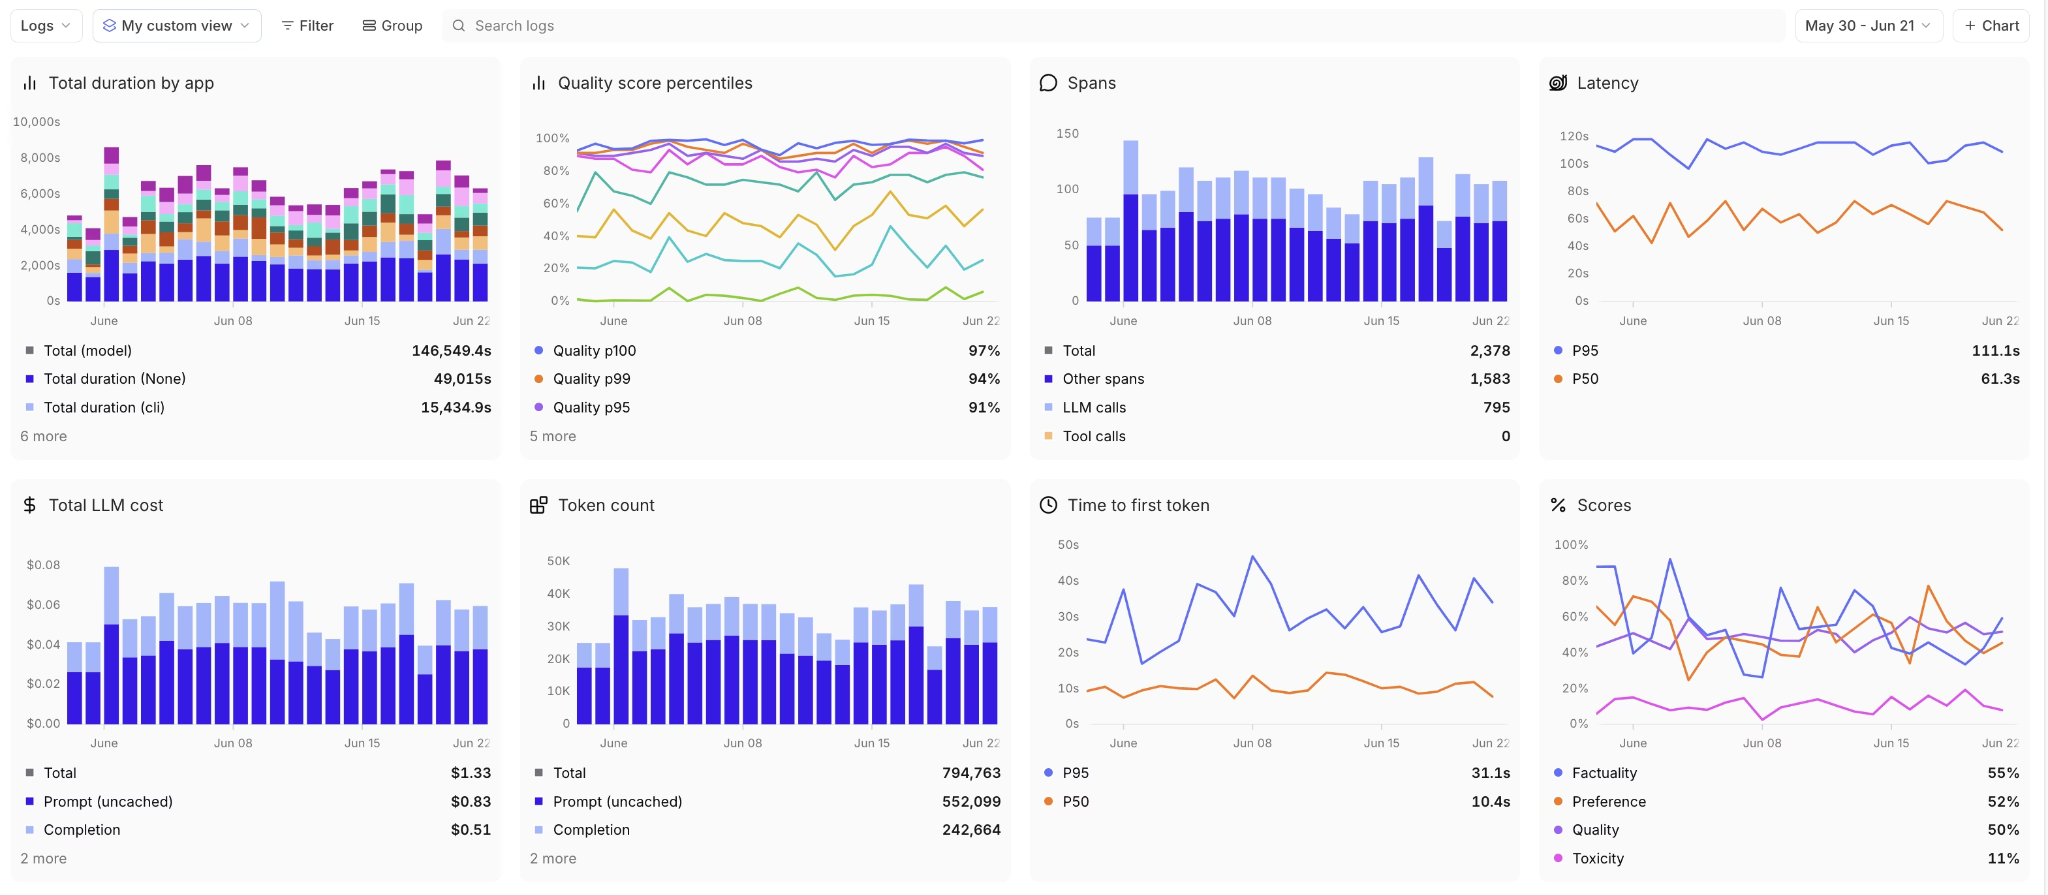
Dashboards make it easy to spot trends such as rising costs, quality drops, or slow responses. Alerts can be configured to notify teams when metrics cross defined thresholds, helping surface issues before users report them.
Brainstore for large-scale trace data
Brainstore is Braintrust's data store for LLM observability. It is designed to store and query large trace payloads that include prompts, retrieved documents, and model outputs. This allows teams to search and filter across millions of traces without sampling or data loss.
Because Brainstore is built for LLM workloads, teams can query trace data quickly and use the same data for debugging, evaluation, and monitoring.
Playground for testing and iteration
The Playground allows teams to test prompts, models, and retrieval setups using real production data. Users can compare outputs side by side, review eval scores, and understand how changes affect behavior before deployment.
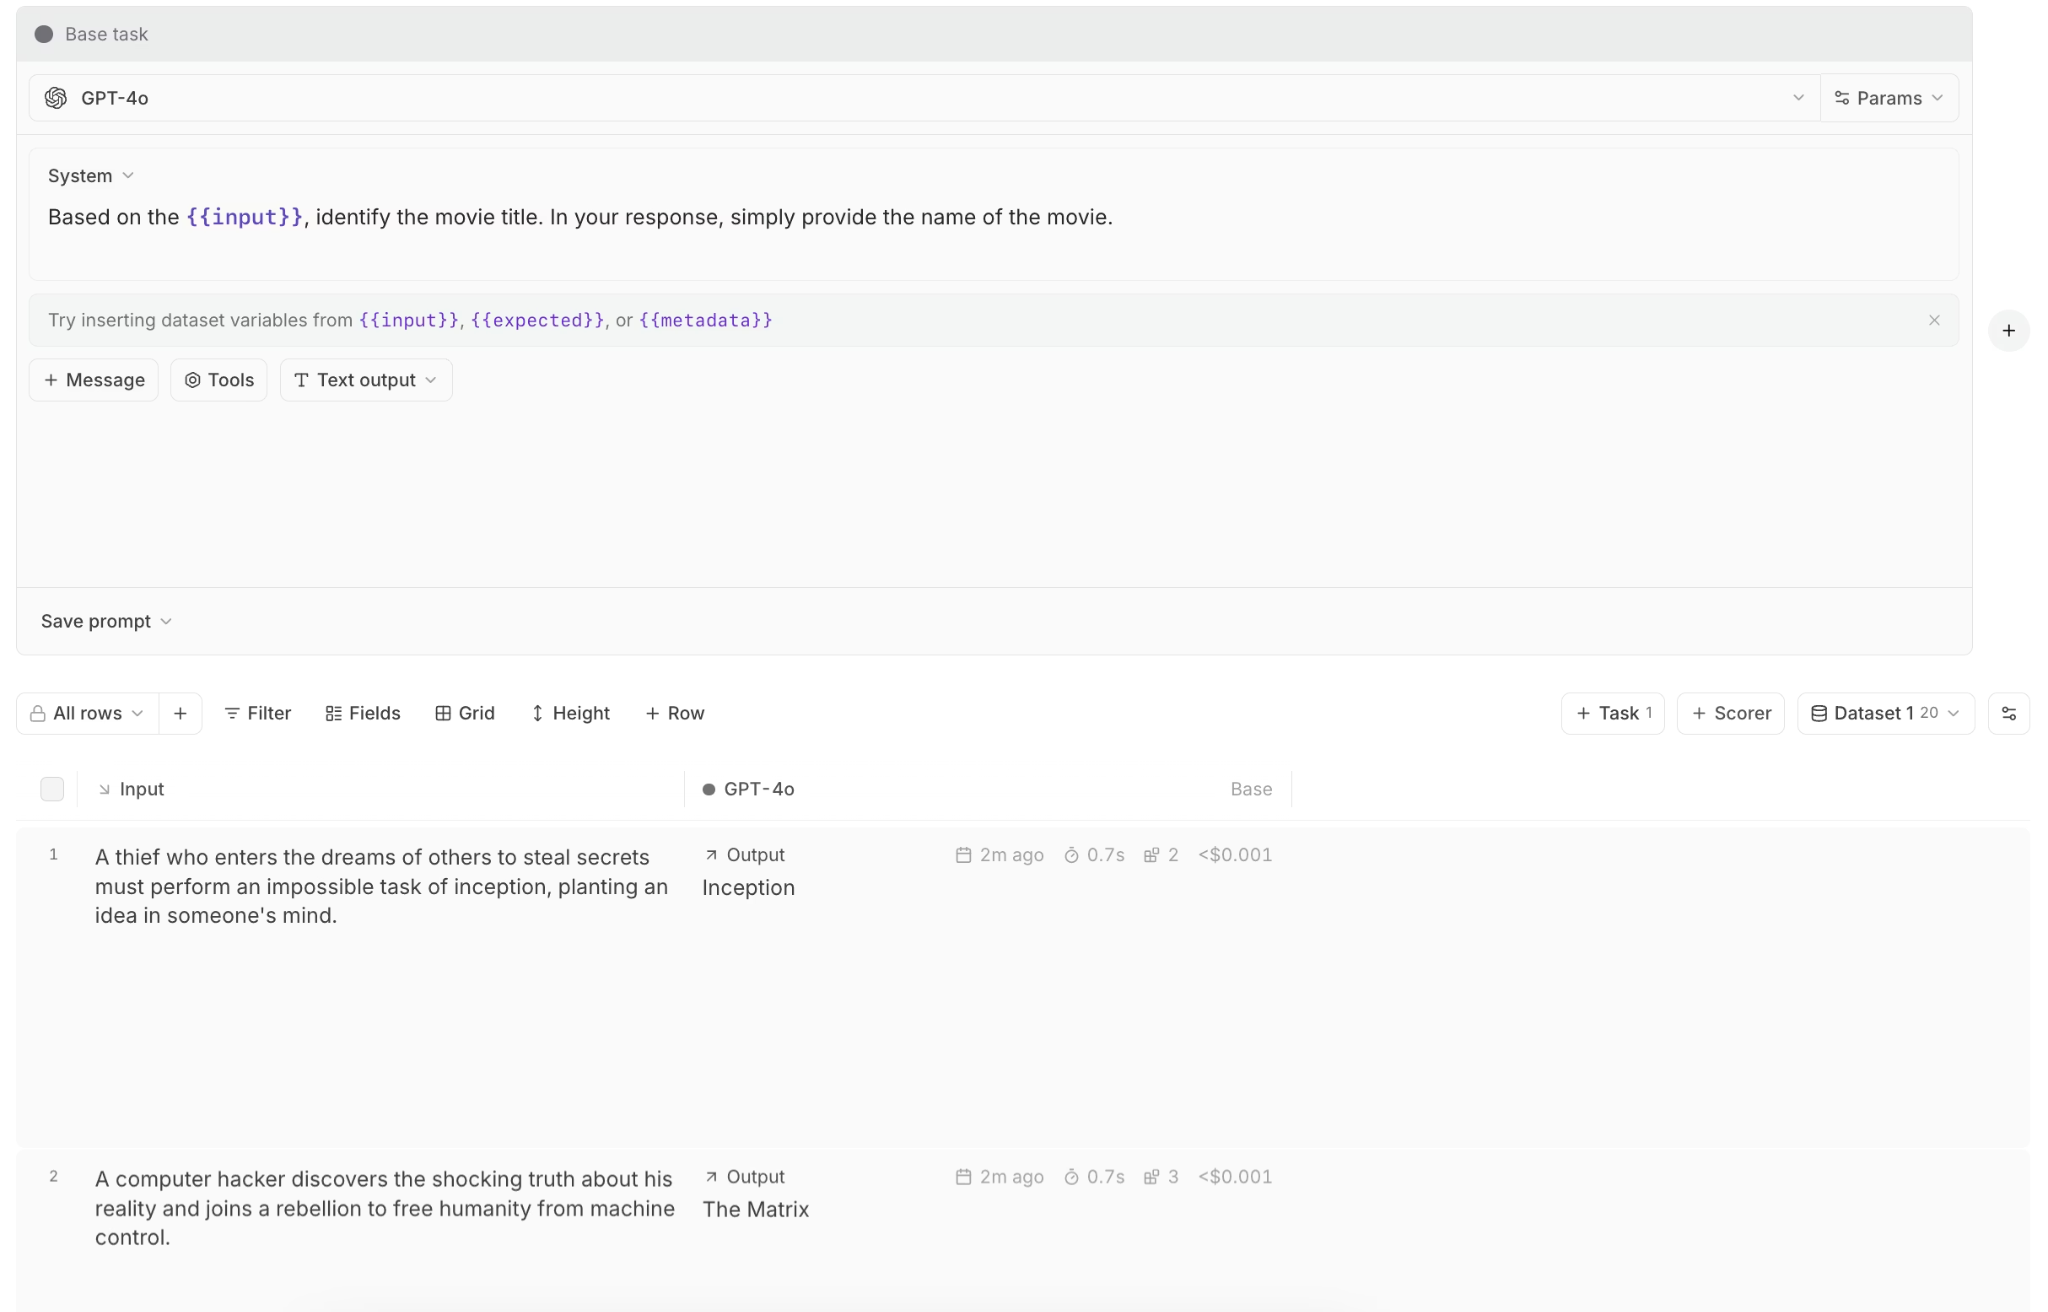
The Playground uses the same tracing and eval infrastructure as production, so experiments reflect real system behavior rather than isolated prompt tests.
Built on OpenTelemetry
Braintrust uses OpenTelemetry for instrumentation. Teams can send traces from existing OpenTelemetry setups without adopting proprietary SDKs. OpenTelemetry support keeps observability data portable and reduces long-term lock-in.
Native GitHub Actions for CI workflows
Braintrust provides native GitHub Actions to run evals directly in CI. Teams can execute offline evals on pull requests, compare results against baselines, and block merges when quality drops below defined thresholds. This makes LLM quality checks part of the standard development workflow, rather than a manual or ad hoc step.
Because these CI runs use the same eval definitions and scoring logic as production, teams can catch regressions early and ensure changes improve quality.
Shared workflows across teams
Braintrust supports shared workflows across engineering, product, and operations. Engineers debug traces, product teams review eval results, and operators monitor dashboards in the same system, using the same underlying data.
Production teams at Stripe, Notion, Perplexity, Zapier, Coursera, Replit, and Vercel trust Braintrust for LLM observability. Dropbox uses Braintrust to improve the quality and reliability of its conversational AI, reducing the risk of regressions reaching production.
Start using Braintrust's free tier to catch failures early, including 1 GB of processed data and 10,000 evaluation scores per month.
Conclusion
LLM observability makes it possible to understand how LLM systems behave in production. It connects request execution, output quality, and system behavior so teams can see why responses fail, where issues originate, and how changes affect real usage over time. Without observability, LLM applications remain difficult to debug and hard to operate reliably at scale.
Braintrust provides an observability workflow designed specifically for LLM applications, bringing production visibility, evaluation, and monitoring into one place. Teams use it to move faster when issues appear and to make decisions based on production behavior rather than assumptions.
Get started with Braintrust for free to add observability to your LLM applications in production and catch failures before users see them.
FAQs
What is LLM observability?
LLM observability is the practice of understanding how LLM applications behave once they are running in production. It goes beyond checking whether requests succeed and focuses on how responses are produced, whether outputs meet quality expectations, how much they cost, and whether they introduce safety risks. With observability in place, teams can debug incorrect responses, track quality changes over time, and operate LLM systems more reliably as usage grows.
How is LLM observability different from traditional monitoring?
Traditional monitoring is designed for deterministic systems and focuses on infrastructure health, such as uptime, latency, and error rates. LLM observability adds visibility into model behavior by recording prompts, retrieved context, model outputs, and execution steps. This makes it possible to understand why a response was incorrect, unsafe, or expensive even when the system appears healthy from an infrastructure perspective.
How does LLM observability help reduce costs?
LLM observability makes it clear where usage and spending are concentrated. By tracking token usage, model calls, and context size per request, teams can identify inefficient prompts, unnecessary retries, and oversized context windows. Braintrust's cost analytics break this data down by prompt, completion, feature, and metadata, helping teams prioritize changes that reduce spend without degrading output quality.
What tools do I need for LLM observability?
Effective LLM observability requires three capabilities working together. Tracing captures how each request executes across retrieval, prompts, model calls, and tools. Evaluation measures whether outputs meet defined quality criteria. Monitoring tracks trends in latency, cost, errors, and quality over time. Braintrust provides all three capabilities in a single platform, using shared data so teams can detect issues, investigate their cause, and validate fixes with one-click production-to-eval workflows.
How do I get started with LLM observability?
Teams usually start by adding tracing to their LLM applications so they can inspect how individual requests execute. Once tracing is in place, they add evals to measure output quality and monitoring to track changes over time. Braintrust supports this incremental approach, allowing teams to instrument production traffic, turn real failures into eval test cases, and monitor quality and cost using the same workflow from the beginning.