From World Cup matchups to research maps: evaluating Parallel's web research agents
The 2026 World Cup has captured the attention of the world, including the Braintrust team. Upsets like Cape Verde holding Spain to a 0-0 draw have left analysts searching for explanations. Watching a game, I find myself opening tab after tab, tracking who plays with whom at club level, when these squads last met, which players share a youth academy, and who is carrying a knock. In the age of agentic systems, I figured I should stop furiously typing and let the agents do it for me, then use Braintrust to check whether the research was complete, sourced, and useful.
When an agent researches a single matchup, what does it surface, what does it miss, and how much do architecture and processor tiers matter? We wanted a live, sourced, structured account of everything publicly knowable about two squads before they play, covering shared club histories, head-to-head duels, injury bulletins, recent form, and cross-team familiarity. The kind of thing a well-read analyst, or fanatical fan, would spend hours assembling by hand.
To do this, we used Parallel Web Systems's Task API. It "turns open-ended research tasks into structured, repeatable workflows by combining AI inference with web search and live crawling." You send it a research brief, define an output schema, and get back a structured, source-backed response. Parallel recently wrote about using this to enrich and triage inbound leads. The same pattern applies here, pointed at a football matchup instead of a CRM record.
Then, Braintrust helps us turn that research output into an experiment. We can compare six configurations on the same inputs, score the evidence attached to every relationship, inspect failures row by row, and decide which setup is worth the extra cost.
The research task
For each matchup we send Parallel a research brief and ask it to return a structured map covering:
- Squad availability: injury bulletins, suspension concerns, and fitness doubts, each tied to a dated source
- Head-to-head duels: player pairs likely to be in direct opposition, with encounter counts, last meeting dates, and sourced summaries
- Cross-team familiarity: current or former club teammates, youth-academy ties, and shared coaches across opposite squads
- Recent form: last five matches for each side, key player performances, and goals scored and conceded
- Club chains: every squad player mapped to their club, forming the national team to player to club chain that drives connectivity scoring
The structured output makes the research inspectable and scoreable. In a prose summary, you need to read and interpret the answer. A knowledge graph gives you nodes, edges, and evidence records that can be visually and mathematically inspected. Each node is traceable to a specific source URL and excerpt that Parallel's agents pulled from the live web. We use a knowledge graph as the container for this structure because football intelligence is largely about relationships between players and clubs, which a graph can store directly. Most of the work here goes into the research, and the graph format keeps it organized and scoreable.
Parallel does the research, and Braintrust is how we check whether it holds up.
Six configurations
We ran 48 World Cup matchups through six configurations, for 288 total runs. The configurations cross two architectures with three Parallel processor tiers, which lets us see how research depth and task design interact.
Architecture:
- Monolithic: a single Parallel task receives the full matchup prompt and returns a complete structured output in one call.
- Fan-out: six specialist Parallel researchers run in parallel, each with a narrow brief covering injuries for the home side, injuries for the away side, head-to-head duels, cross-team familiarity, recent form, and club chains. Their outputs are merged before a lightweight Claude synthesis step writes the summary. The idea is that a specialist researcher given a tighter brief will go deeper on that domain than a generalist asked to cover everything at once.
Parallel processor tiers: base, core, and pro are three of Parallel's processor tiers, where deeper tiers spend more time on the web and return richer, better-evidenced results.
Toggle between the configurations
Pick a matchup, then compare six different research strategies. Flip between them and watch the depth of coverage change, from a sparse sketch to a dense, evidence-rich map. Drag nodes around, scroll to zoom, and select any edge to see the source excerpt Parallel's agents retrieved. The panel on the right shows the same object scored, capturing how each configuration trades off structure, evidence, and cost.
A few patterns stand out:
- Processor tier is the dominant variable. The
basetier returns a thin outline, with a handful of squad names and a few broad relationships. Move toproand the same matchup comes back as a full two-squad picture, with availability concerns for every key player, a dozen sourced head-to-head records, and club overlap across opposite squads. Parallel's deeper tiers surface significantly more evidence. - Architecture changes what gets emphasized. The monolithic call tends to produce a more connected map, seeing the whole brief at once and drawing cross-cutting links. The fan-out goes deeper per domain. The injury specialist, handed only an injury brief, finds more availability signals than the generalist would, but the resulting map is slightly more modular.
monolithic-prois the default I would use for most matchups. It lands nearfanout-proon composite quality at about one-sixth the cost. Fan-out is worth reaching for when the question depends on domain-specific coverage, especially injuries.- Research completeness becomes measurable. The gap between a sparse sketch and a dense, well-sourced map shows up in the scores, not only in the picture. Roster coverage, citation coverage, and schema utilization tell you where a configuration is cutting corners.
How we measure it
There is no single ground-truth matchup map to check against. So we score the properties of good research using a suite of scorers. When this post refers to composite quality, it means the aggregate signal from that scorer suite, not a separate human rating. That lets us treat agentic research like any other product surface, running variants, comparing outputs, inspecting regressions, and choosing a default based on measured behavior rather than intuition. We build out a suite of scorers rather than collapsing into one quality metric in order to gain insight into the failure and success modes of each system.
Scorers at a glance
A run can still score 99% squad_completeness and 26% basis_coverage at the same time, because those numbers answer different questions. One is about roster breadth, the other is about how well the edges are grounded. By tracking both, we are able to gain real insight into how architecture and tier alter research behavior. If we are a scout, we probably care most about roster completeness. If we are scraping to build a prediction model, the interconnections revealed in basis_coverage might matter more.
| Family | Plain-English description | Representative scorers |
|---|---|---|
| Structural | Did the graph come back valid, connected, and backed by usable evidence? | schema_validity, squad_completeness, evidence_coverage, basis_coverage, cross_team_links, prior_duel_links, injury_signal, referential_integrity, graph_connectivity, source_url_validity, source_freshness_*, source_diversity, evidence_edge_type_ratio |
| Schema utilization | Did the model use the richer parts of the schema, or only fill the easy fields? | node_type_coverage, relationship_coverage, duel_attribute_instantiation, familiarity_attribute_instantiation |
| LLM judge | Would a human analyst trust the summary and the supporting excerpts? | summary_quality, evidence_relevance, matchup_map_completeness |
| Prediction | Once the game ends, was the pick right and the confidence well calibrated? | prediction_correctness, prediction_calibration, prediction_margin_accuracy |
More detail on scorers
The useful part of these scorers is that they stay simple enough to compare across runs:
squad_completenessis essentiallycovered_player_nodes / target_player_nodes.evidence_coverageisedges_with_any_evidence / total_edges.basis_coverageisedges_with_non_empty_excerpts / total_edges, so it is a stricter grounding check thanevidence_coverage.node_type_coverageandrelationship_coverageare type-level coverage ratios: how many of the available node or edge categories appear. In other words, they measure ontology coverage: how much of the graph's allowed vocabulary of node and relationship types the model uses.duel_attribute_instantiationis the mean fill rate across the duel fields (weight,encounters,last_meeting,matchup_summary).familiarity_attribute_instantiationis the mean fill rate across the familiarity fields (weight,matchup_summary). Together, the instantiation metrics follow the SPI (Subclass Property Instantiation) idea: whether the model fills in the richer, specialized fields a schema offers.prediction_calibrationis1 - Brierfromwin_probability, so better-calibrated probabilities score higher. Brier score measures how far a predicted probability lands from the outcome, on a 0 (perfect) to 1 (worst) scale; reporting1 - Briermakes higher better. Calibration asks whether stated probabilities hold up over time, which is not the same as picking winners: a model can be accurate yet overconfident.prediction_margin_accuracydrops as the absolute error in goal margin grows, and it falls to zero by a five-goal miss.
The structural scorers are deterministic and do not require LLM calls, the schema-utilization scorers check whether the ontology is richly instantiated, the LLM-judge scorers grade usefulness and support quality, and the prediction scorers only matter once the match result is known. All six configurations sit side by side on one task, with shared scorers, aggregation controls, and traces back to the underlying outputs.
What we found
Cost versus research quality
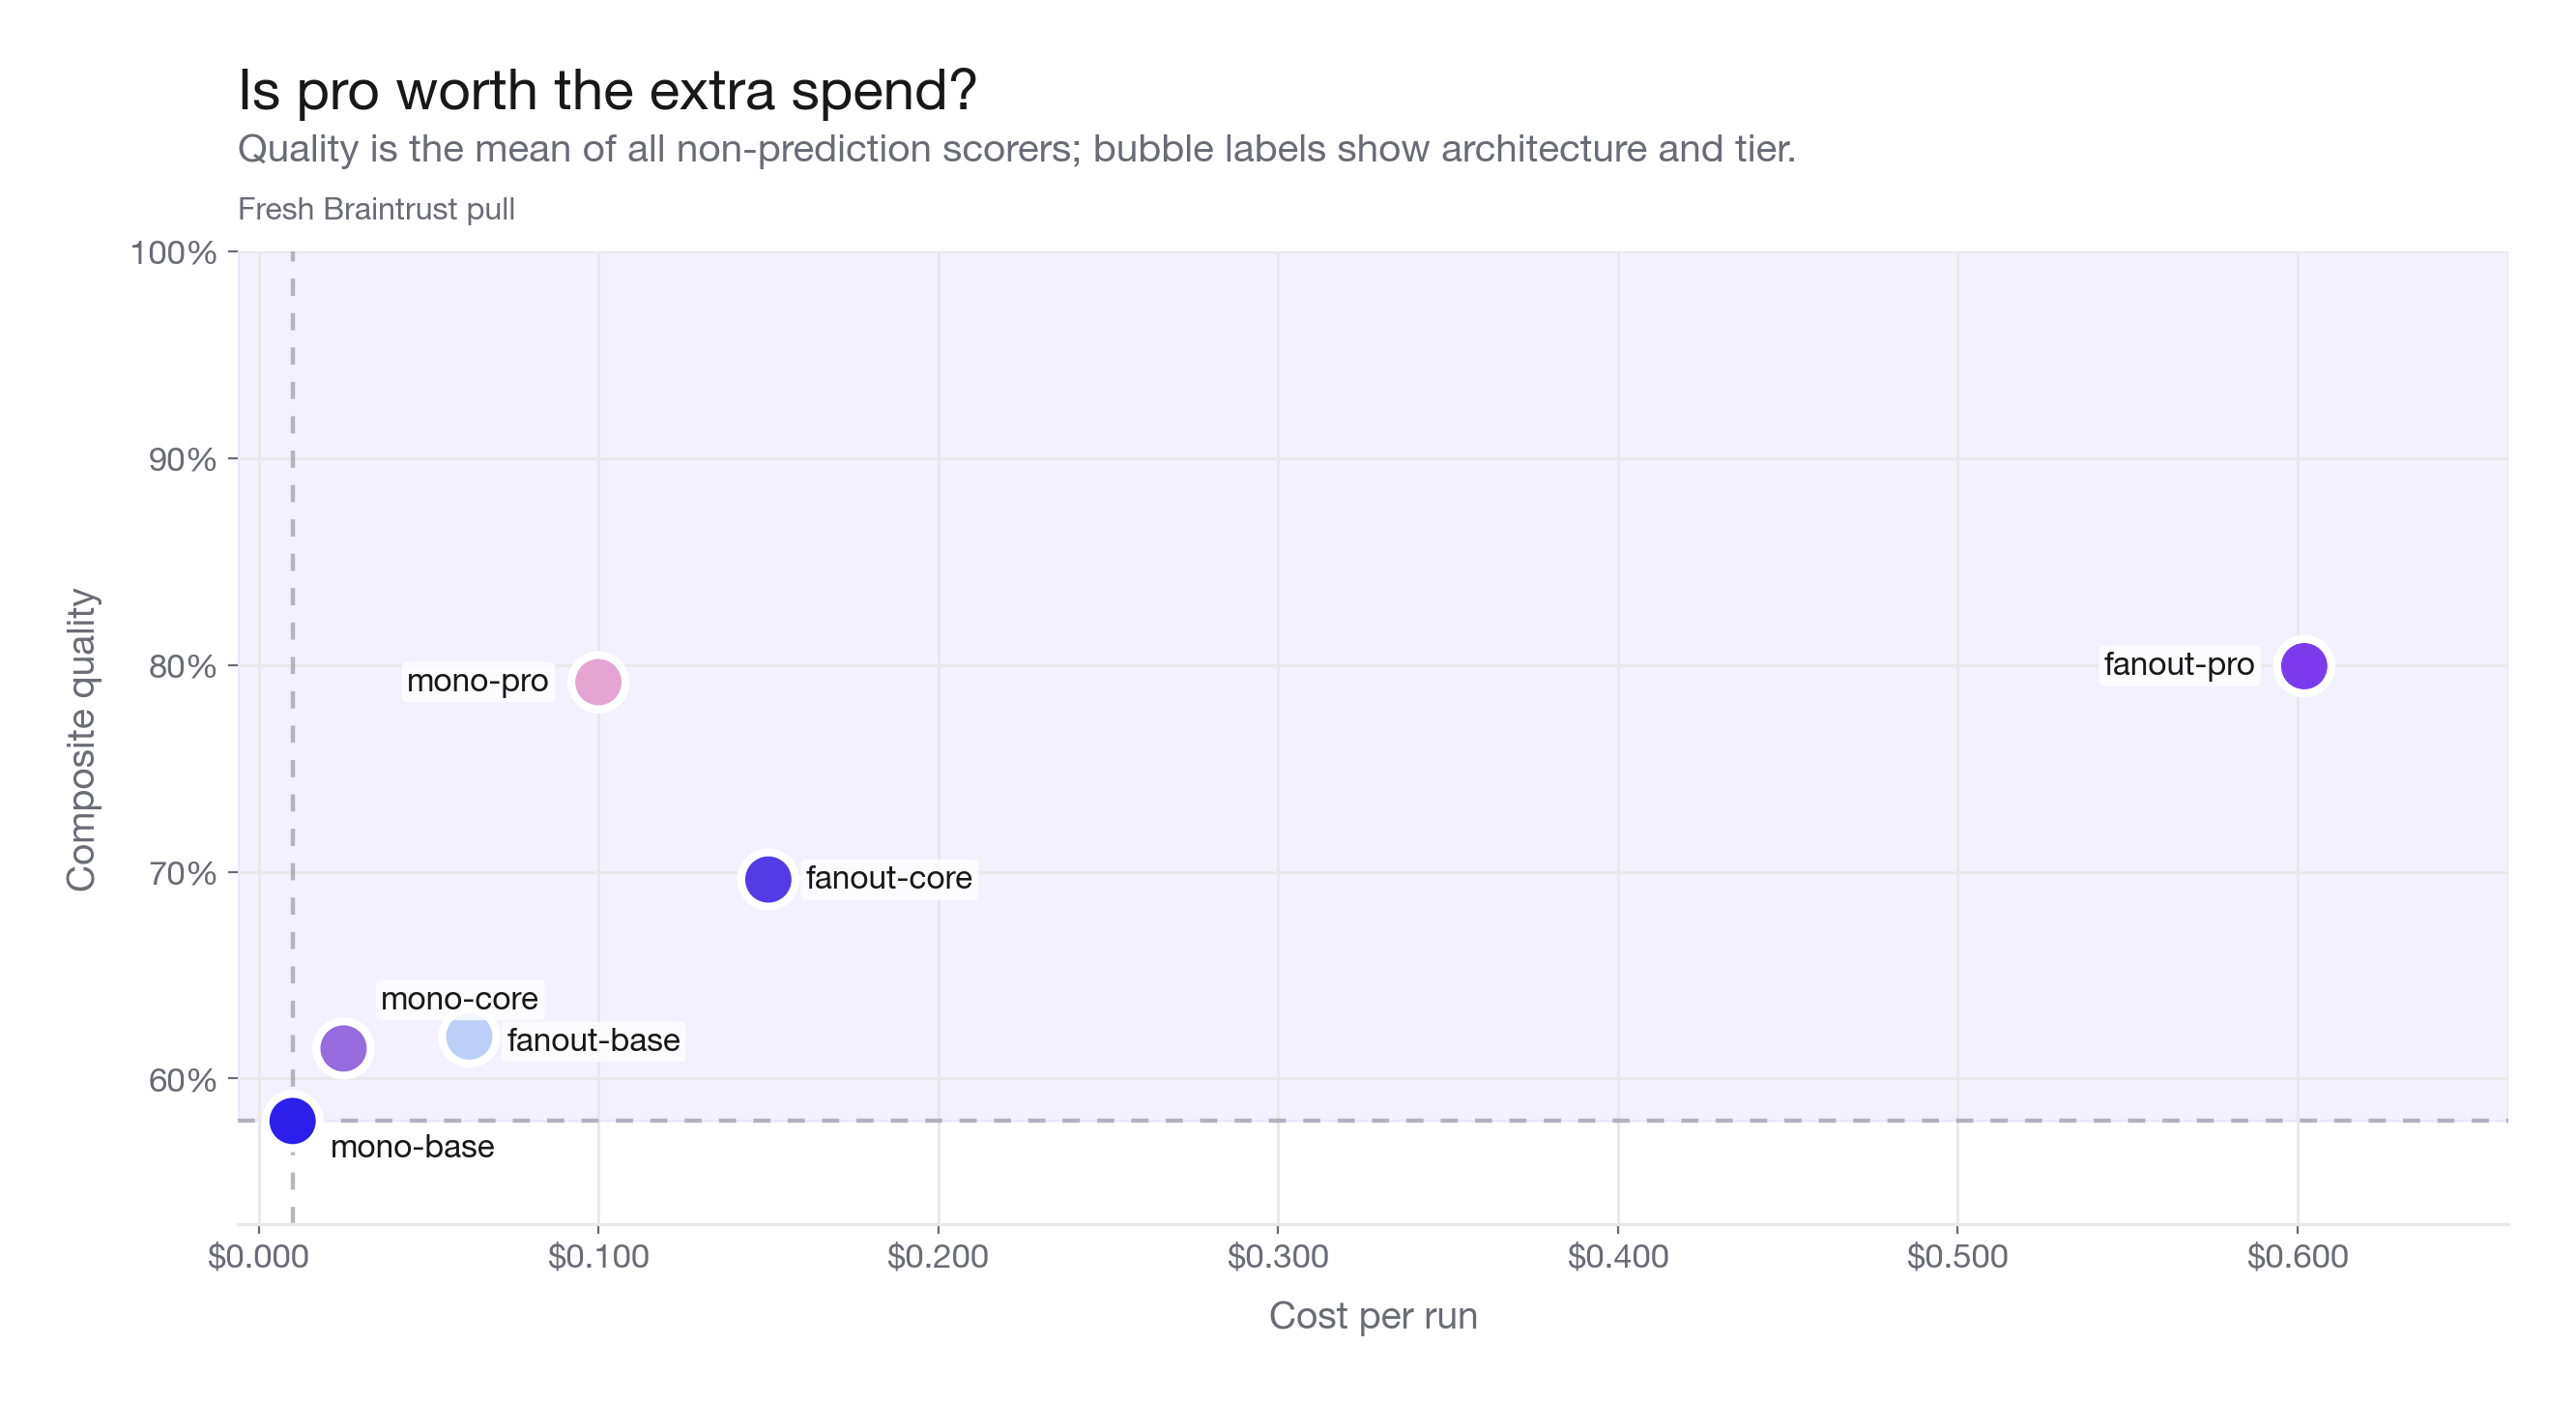
The cost dimension with architecture is clear. For the pro tier, both architectures, monolithic-pro and fanout-pro, land at almost the same composite quality, but fanout-pro costs roughly six times more. At this tier you would be overpaying for the specialist agents when the monolithic pro run already has enough search depth to cover the matchup.
Squad completeness needs grounding context
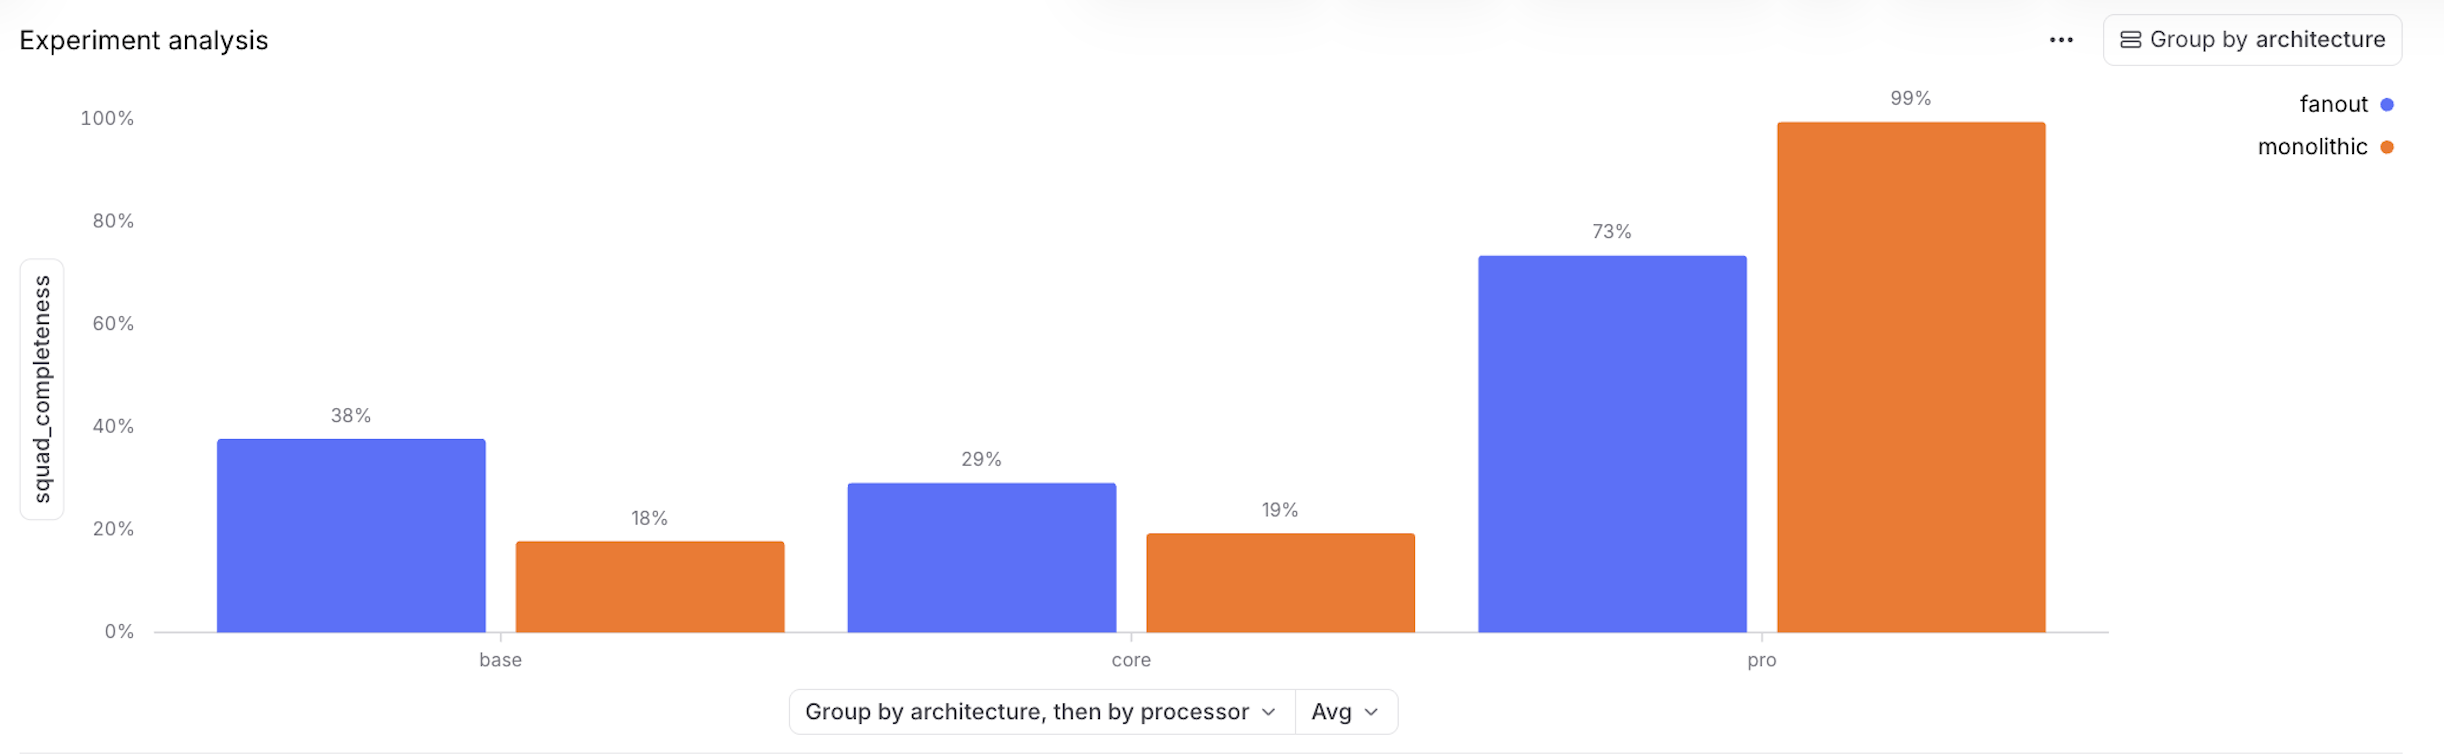
The bar chart says squad completeness improves with tier. Fan-out leads at base, nearly doubling monolithic, but the order reverses by pro, where monolithic reaches 99% to fan-out's 73%. The chart is accurate, but the metric is narrow. squad_completeness counts roster breadth, while basis_coverage and evidence_coverage measure whether relationships are sourced. The table underneath is the warning. monolithic-pro looks strong on the top-line completeness metric, yet its basis and evidence coverage are only 26%.
Pro tier drives injury signal coverage
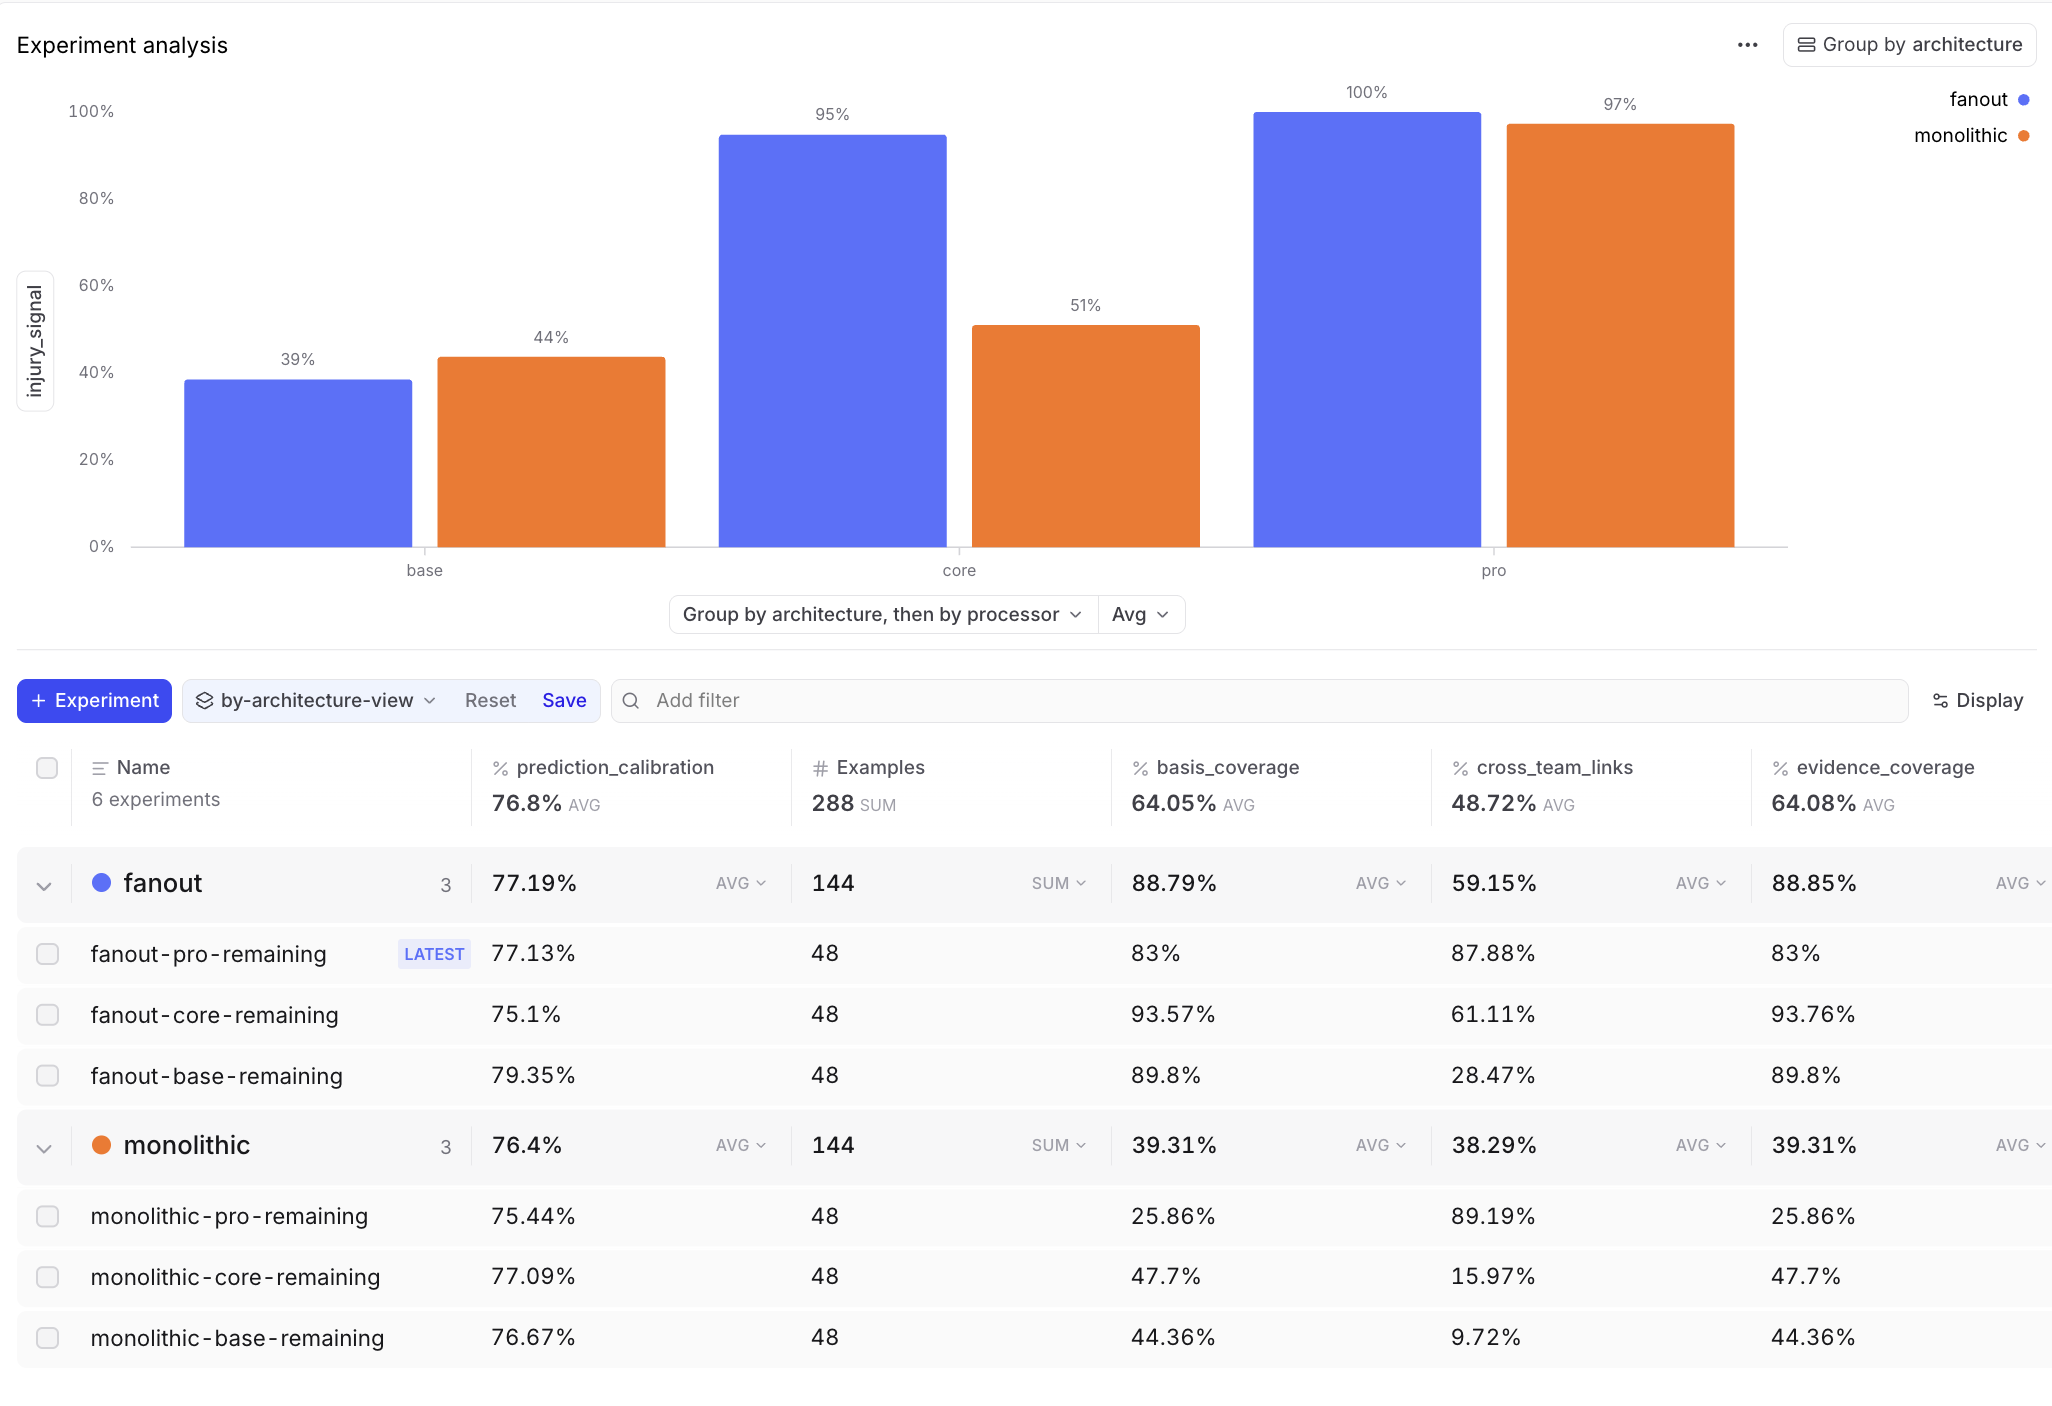
Injury research is where fan-out pays off earliest. The specialist injury task jumps from 39% at base to 95% at core, while the monolithic prompt is still around 51% at core and only catches up at pro. Availability details benefit from a narrow search brief before the generalist prompt has enough research depth.
Core-tier diff exposes matchup-level variance
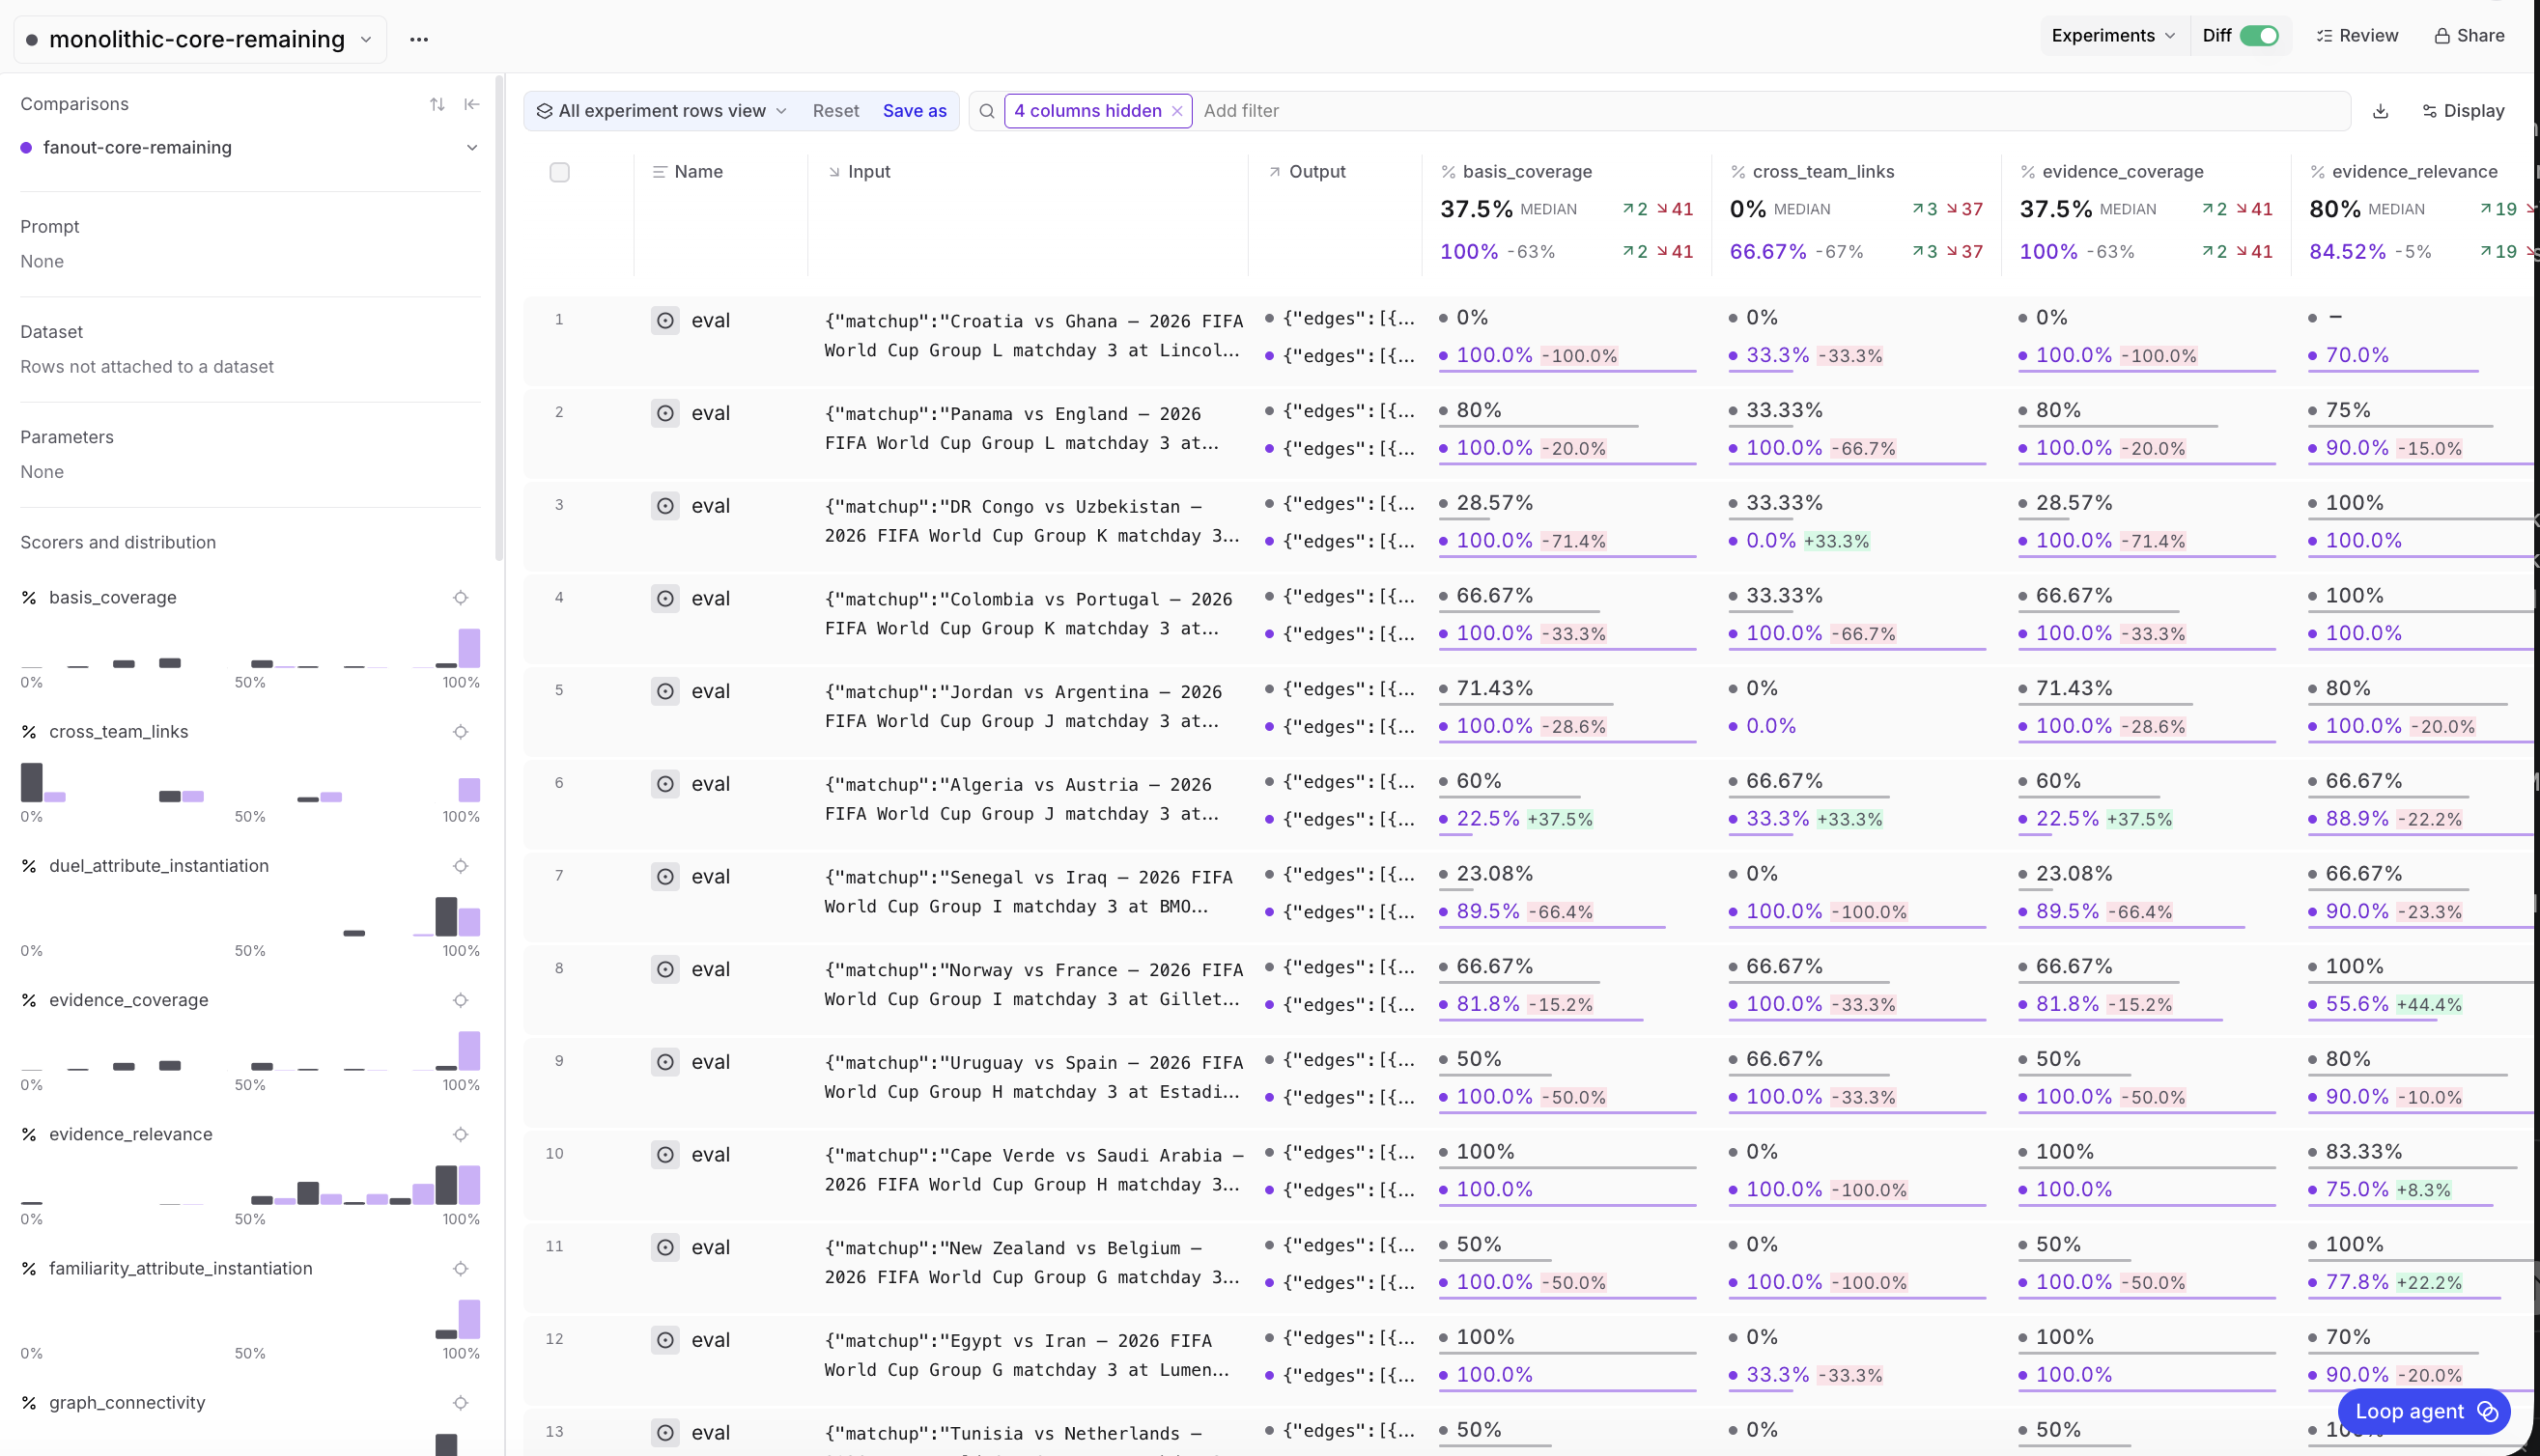
The row-level diff shows why averages are not enough. In the visible core-tier rows, fan-out often pushes basis and evidence coverage upward, sometimes to 100%. Cross-team links move in both directions, which is a tradeoff of synthesis. Each researcher can cover its slice while the merged graph still misses some relationships across slices.
Duel fill runs ahead of evidence
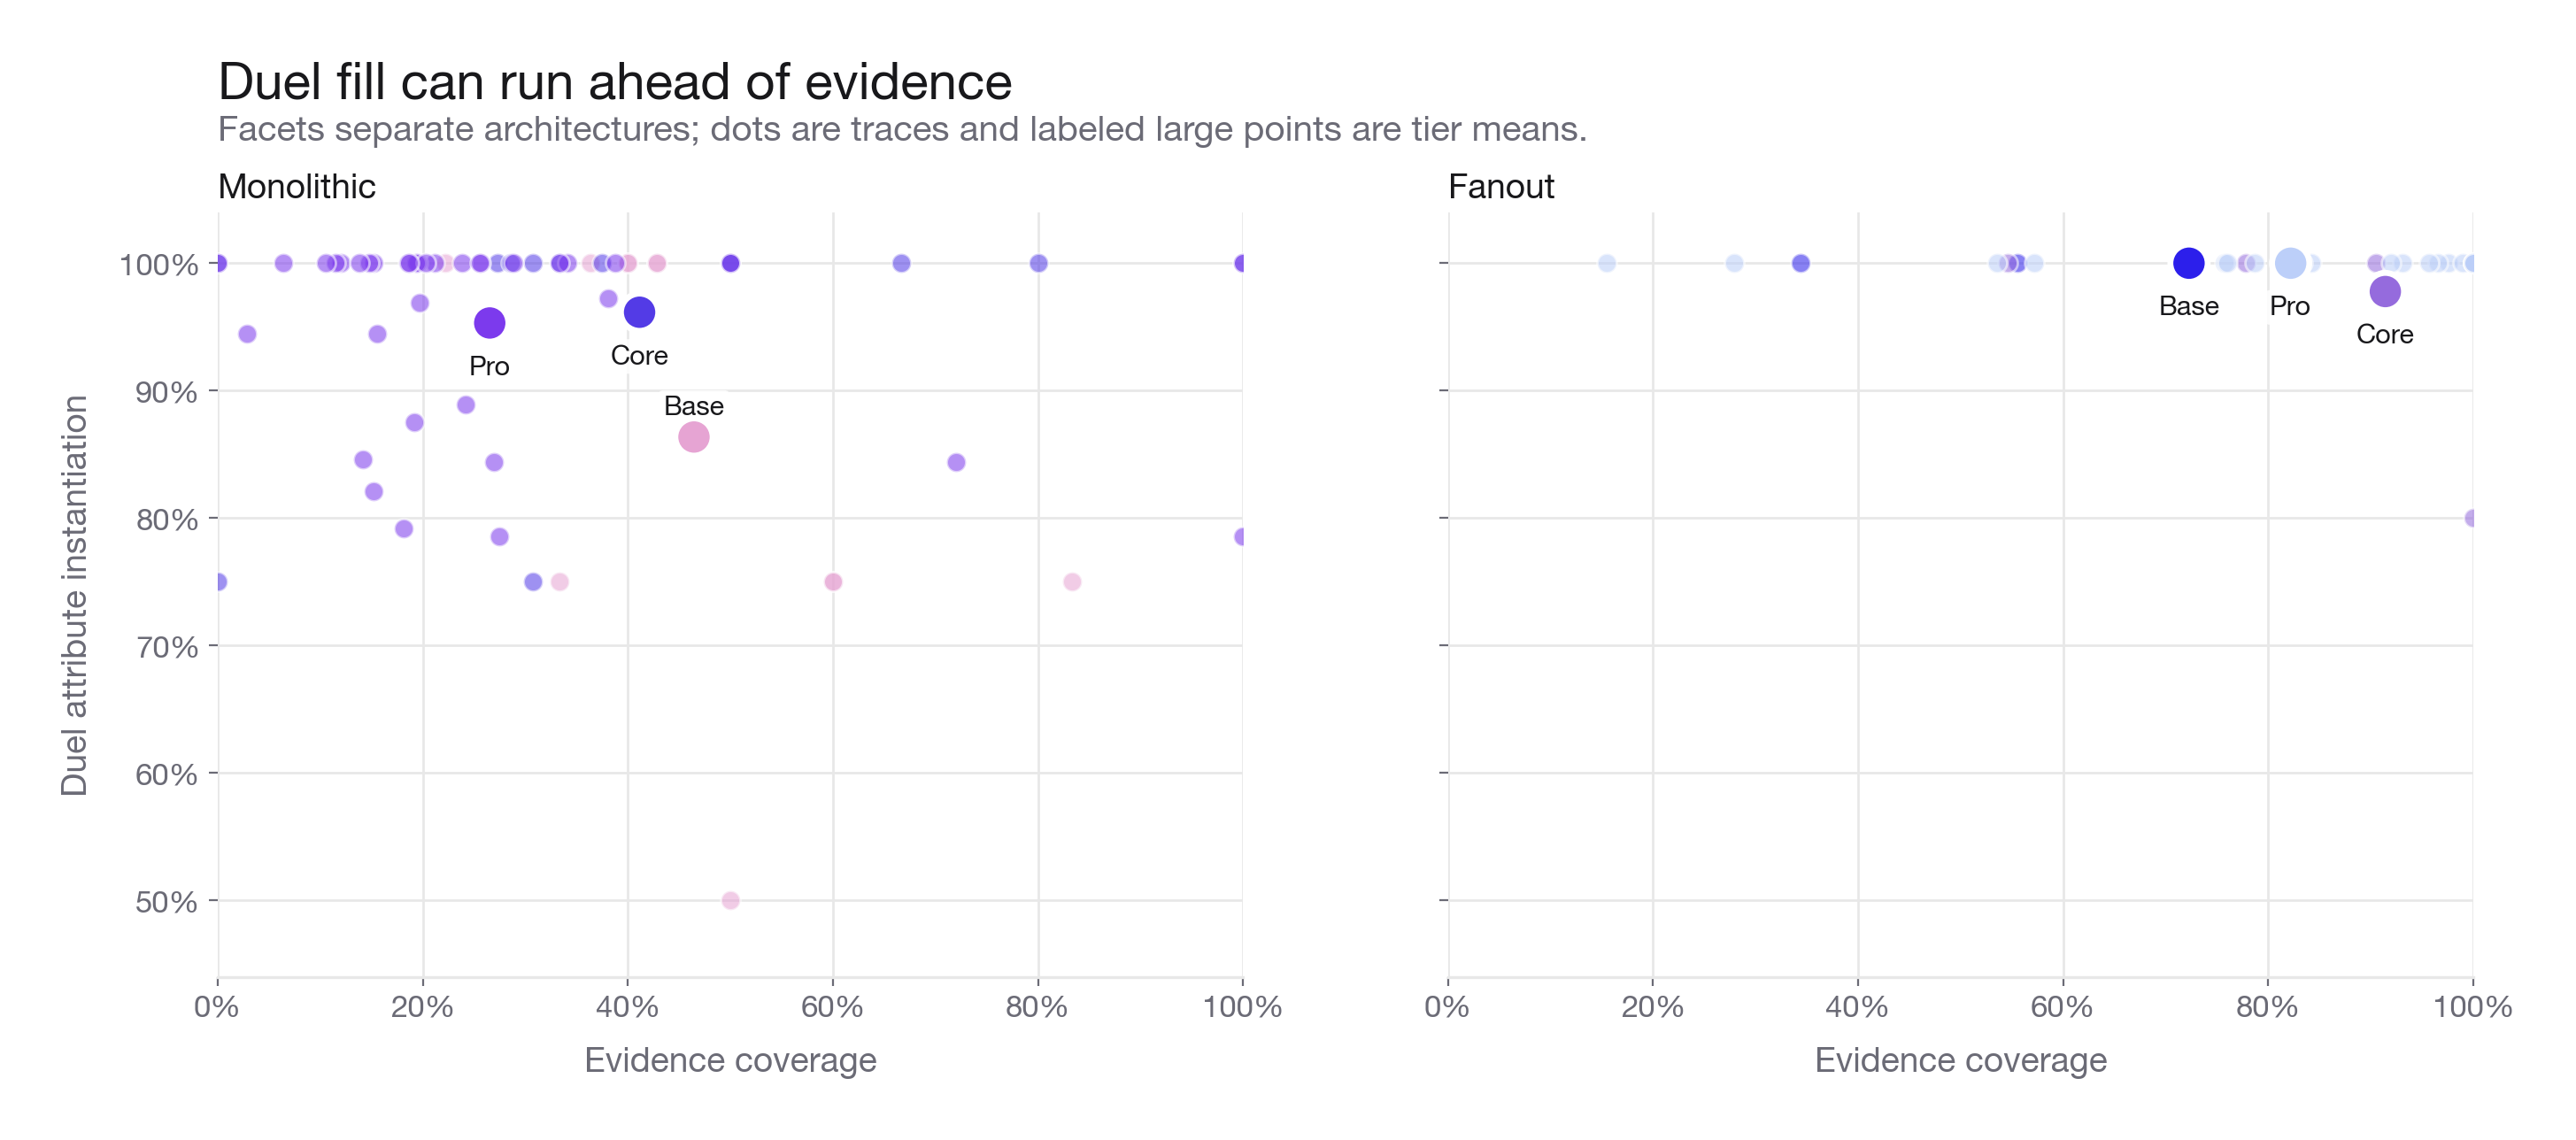
This scatter shows structure outrunning grounding. duel_attribute_instantiation stays high because models can populate fields like encounters and matchup_summary, while evidence_coverage remains low when those edges lack sourced excerpts. Richly formatted duels are not automatically well-supported duels, which is why we score schema fill and evidence separately.
Schema utilization separates the tiers
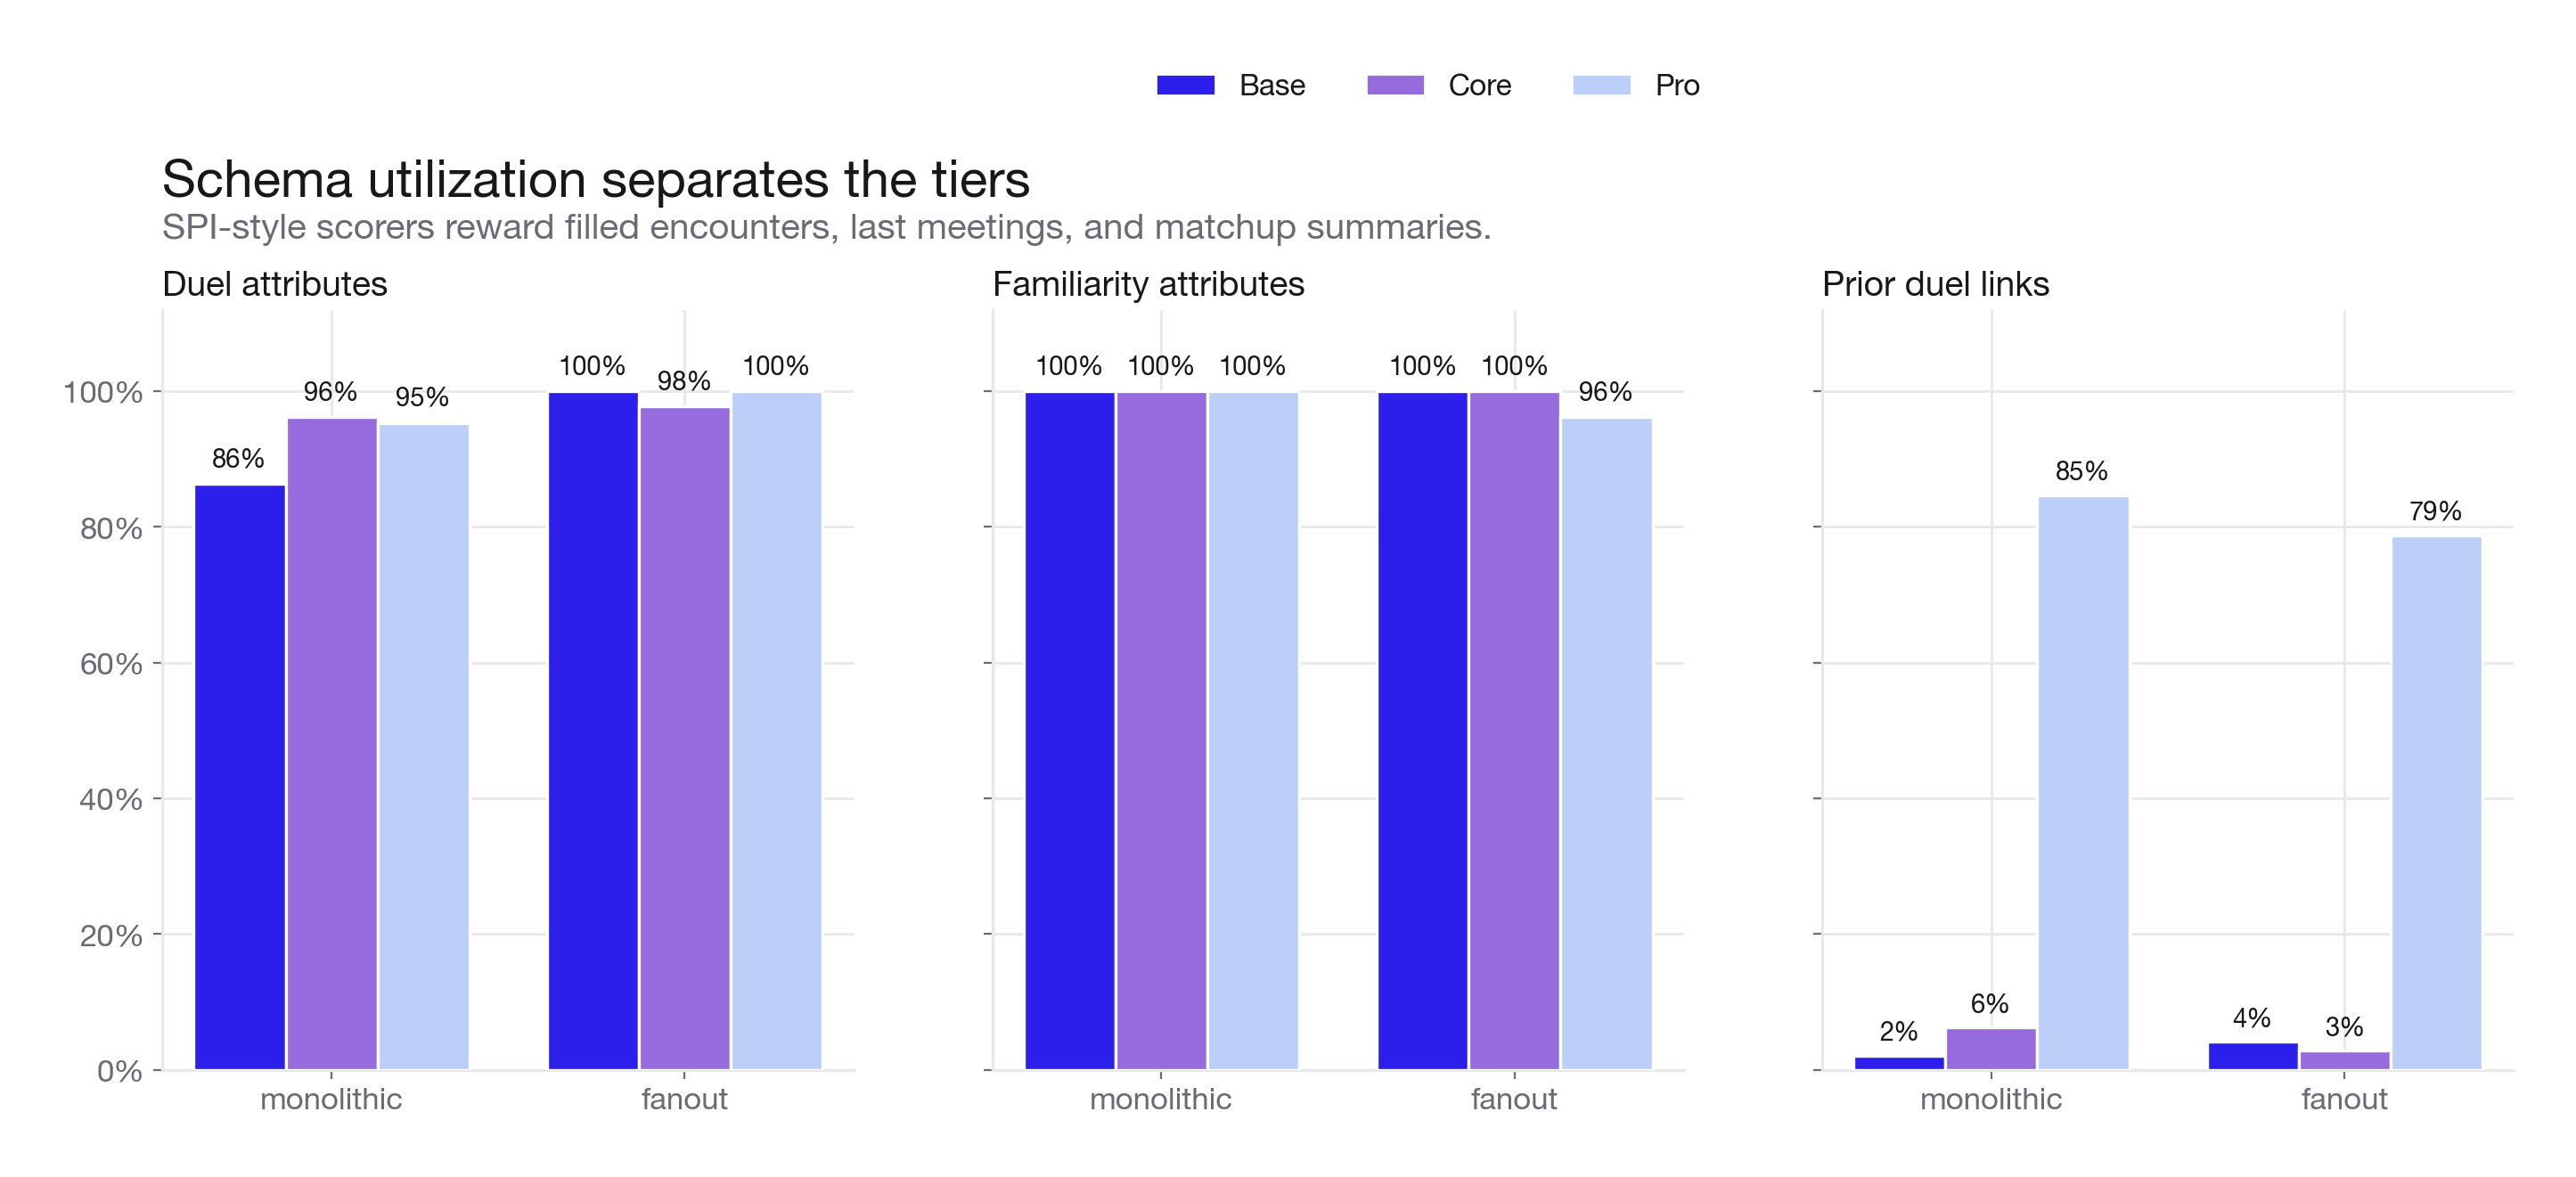
These grouped bars follow the paper's Subclass Property Instantiation (SPI) view, separating easy structure from historical player-vs-player evidence. Duel and familiarity attributes are nearly maxed out at every tier, but prior duel links are almost absent at base and core before jumping at pro. The agent can fill summaries and labels long before it finds prior meetings and sourced encounter records.
Prediction calibration stays flat
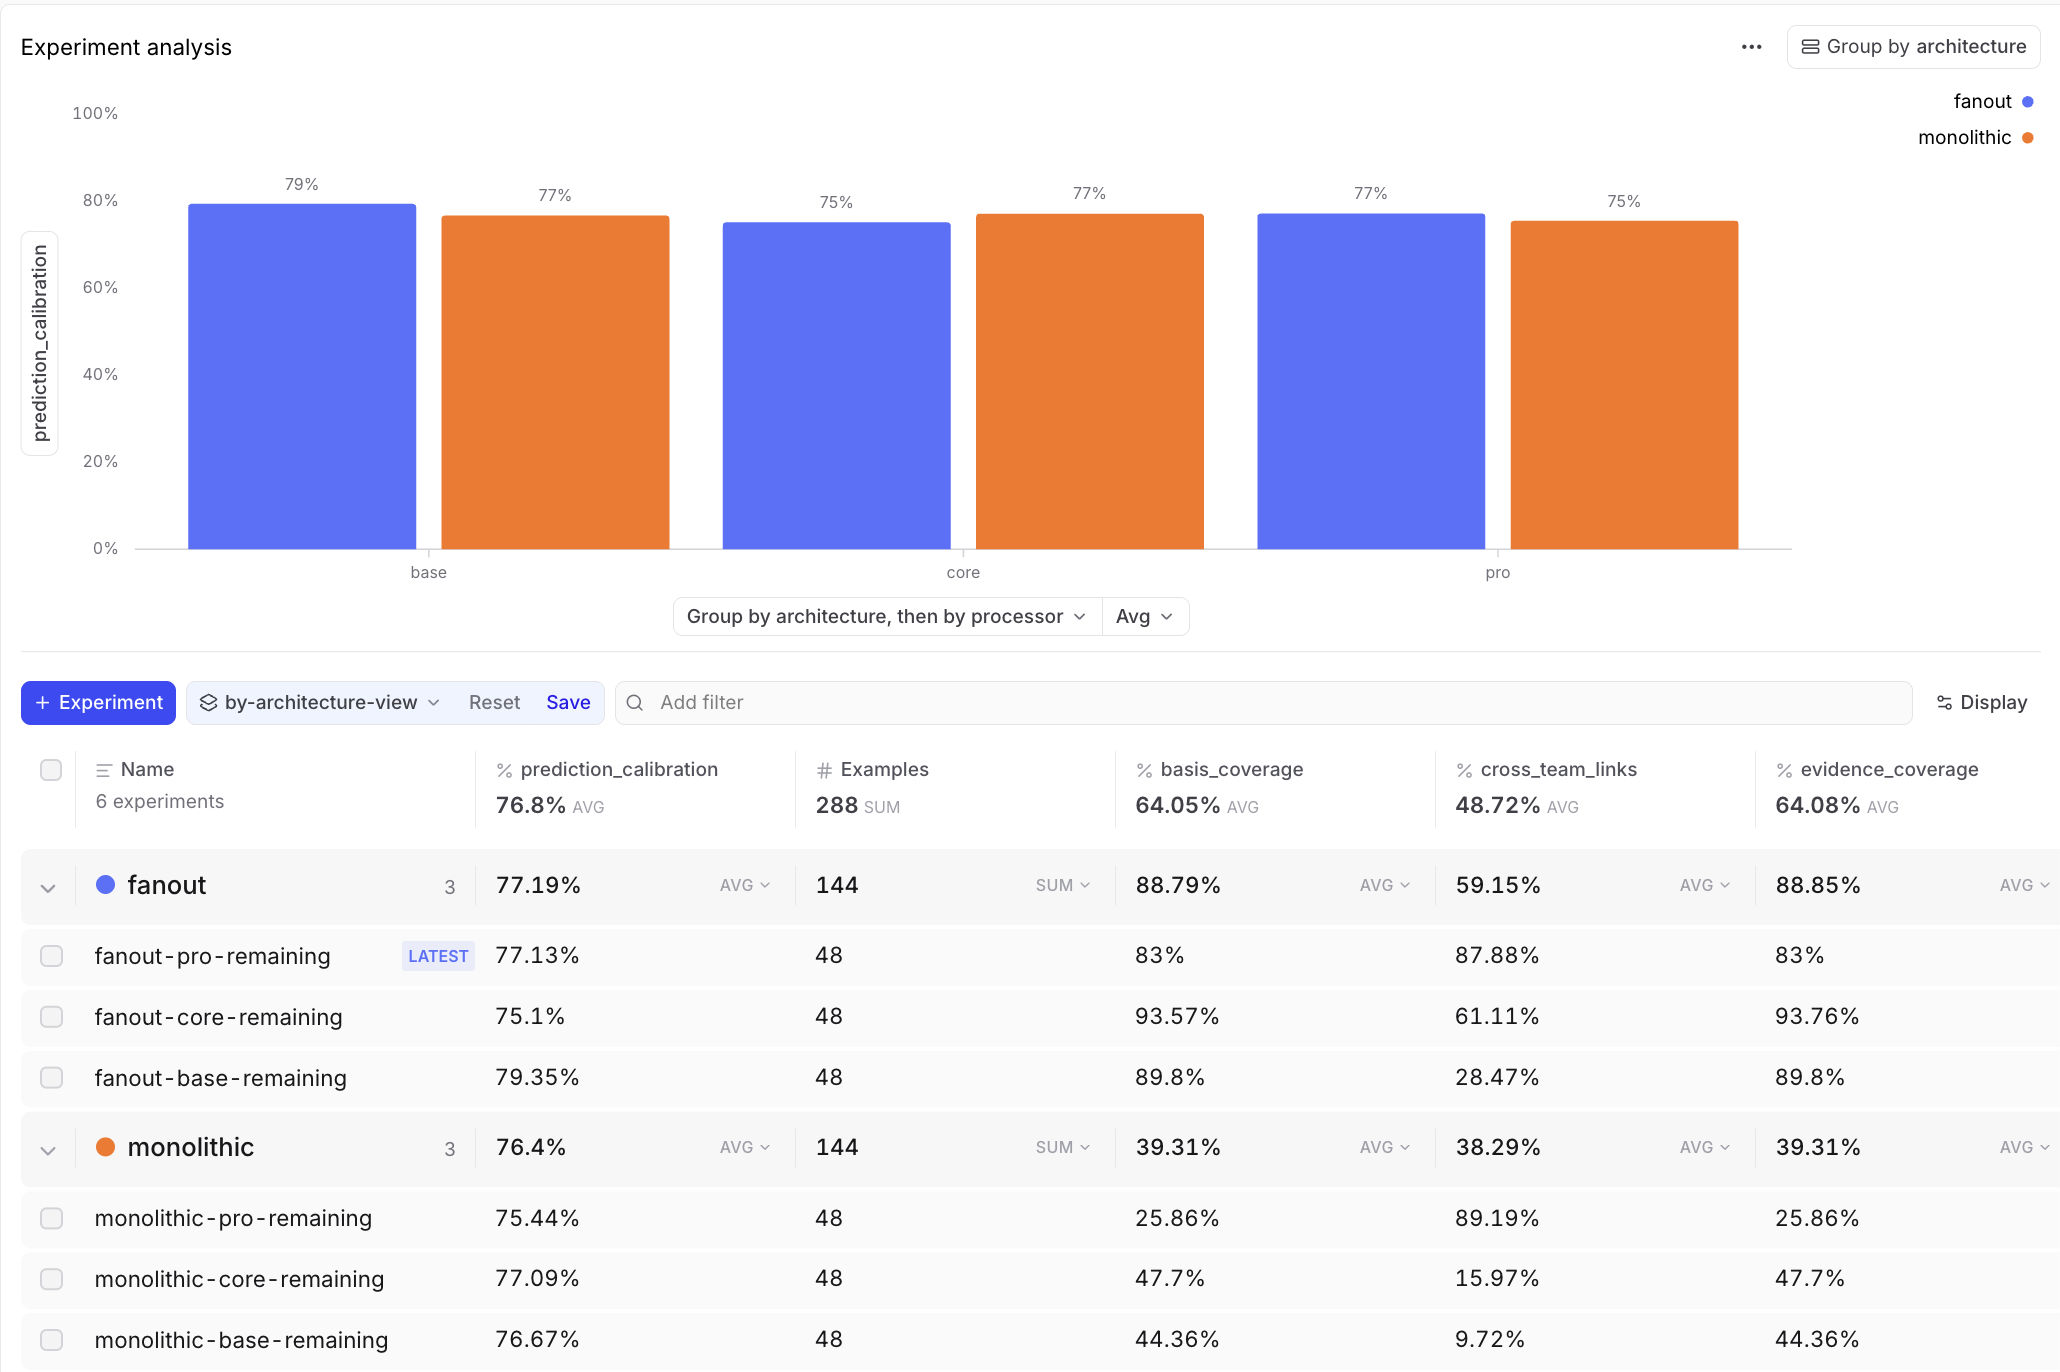
Prediction calibration barely moves. All six bars sit between 75% and 79%, while the research metrics underneath swing across a much wider range. Deeper research did not lift the forecast, and calibration stayed flat even as the research metrics moved.
Scorer profiles across all six experiments
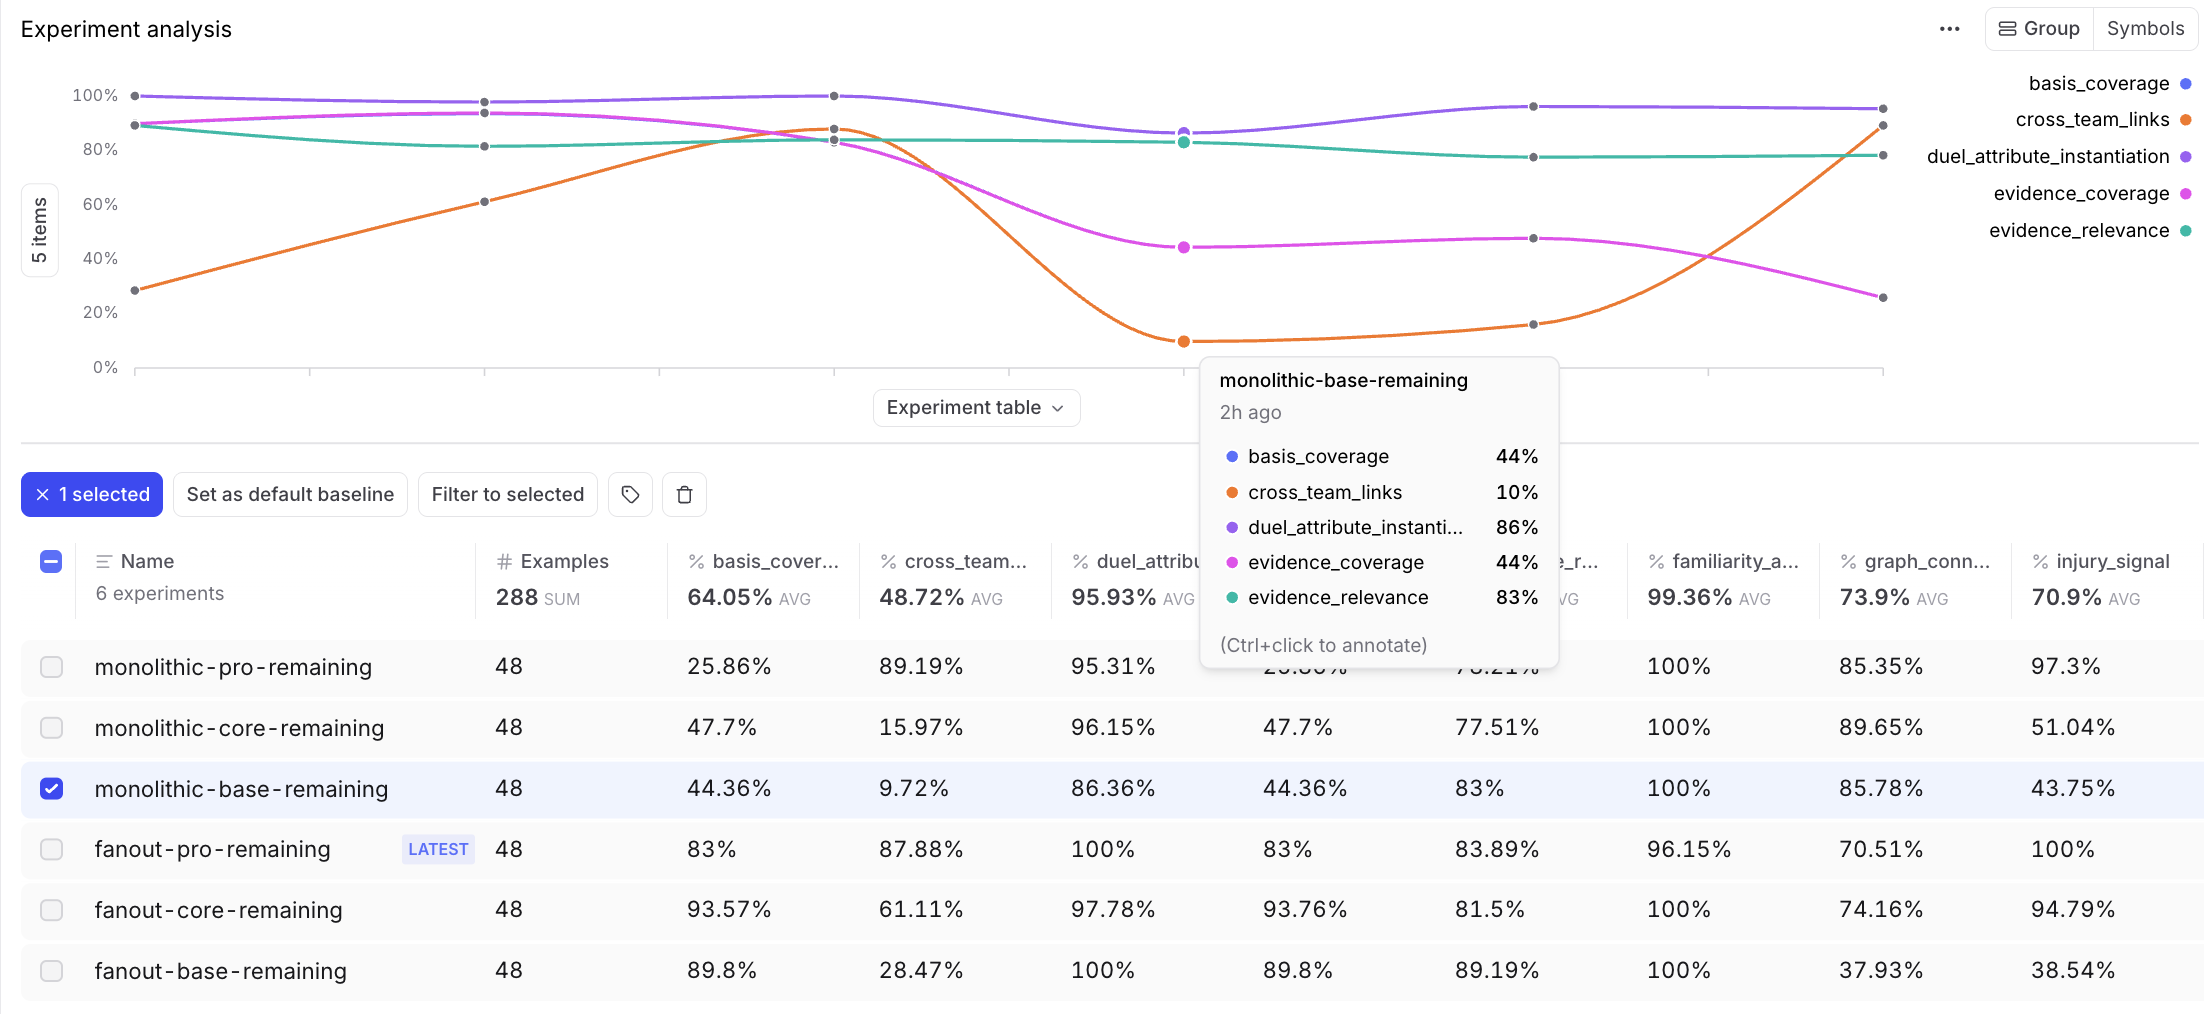
The highlighted monolithic-base run is the compact failure case. Duel attributes are 86% filled and evidence relevance is 83%, but cross-team links are only 10% and evidence coverage is 44%. The citations it finds can be relevant, while many relationships still have no citation at all.
This means monolithic-base can look coherent at the field level while still missing the core goal of the research task, a broadly connected, evidence-backed matchup map.
Conclusion
The group stage wrapped up this past weekend, and the knockouts leave me with the same relational puzzles, now with higher stakes.
Canada's opening knockout win over South Africa, sealed by a 90+2' Stephen Eustáquio goal, is a good test of what a matchup map buys you. Mapped with one of the top tier-architecture combinations, Canada versus South Africa would have shown a thin head-to-head, two meetings with one win each, alongside a sharp club-chain contrast. Canada spread across top European sides like David at Juventus, Davies at Bayern, and Buchanan at Villarreal, against South Africa's domestic core, with heavy overlap at Sundowns and Pirates. That is the kind of picture I used to spend a whole pre-match evening piecing together myself.
The experiment tells me how to produce it reliably. Across 48 group-stage matchups, monolithic-pro and fanout-pro both land around 80% composite quality, but monolithic-pro costs about $0.10 per run against fanout-pro's $0.60. So monolithic-pro becomes my default. I only reach for fan-out where specialization pays for itself, and injuries are the clearest case. The specialist task climbs from 39% at base to 95% by core, while the generalist prompt lags until pro. I can make that call from evidence instead of a hunch, because Braintrust runs every configuration on identical inputs and scorers, with enough row-level detail to see which answers are better-sourced rather than more fluent.
It also marks the limits. Prediction calibration held between 75% and 79% across all six configurations while the research metrics swung dramatically. Deeper research made the forecast easier to inspect without making it more accurate, so I would not treat this as a betting model.
The graph made all of this evaluable. It gave us concrete fields to score and left the judge scorers to grade the prose. As the tournament unfolds, the same research setup can follow it from one round to the next, remapping each new opponent as squads and injuries change.
Trace everything
Create an account or use agent setup to start building today.