What is agent observability? Tracing tool calls, memory, and multi-step reasoning
AI agents plan, select tools, read from memory, process results, adjust their approach, and branch into new paths before producing a final output. When something breaks in that sequence, the failure cause is often hard to detect. The agent may return a fluent, well-structured answer that is completely wrong because it called the wrong tool, retrieved outdated context, or abandoned its original goal during execution.
Standard LLM observability captures the prompt, the completion, token counts, and latency for a single model call. Agent observability captures the full execution flow across every step the agent takes, including tool calls, memory reads, branching decisions, and sub-agent handoffs. Without visibility into each step, debugging agent failures becomes guesswork because the root cause can lie anywhere in a multi-step workflow.
This guide covers what agent observability requires across tool-call tracing, memory, and multi-step workflows, how to instrument it, and how Braintrust provides the observability infrastructure needed for production agents.
Agent observability vs. agent monitoring
Agent monitoring answers high-level questions about system health. It tracks whether the agent responds, how long it takes to complete a task, and whether error rates remain within defined limits. Monitoring signals that something is wrong, but it does not explain what caused the problem.
Agent observability captures the agent's full execution path so teams can trace a faulty output back to the specific step that introduced the error. An agent can pass monitoring checks while still generating incorrect tool arguments, retrieving the wrong data from memory, or repeating tool calls without making progress. When the agent returns a response within expected latency and without raising an exception, monitoring reports healthy metrics even if the workflow produced an incorrect or incomplete result.
In production, monitoring triggers alerts when metrics exceed thresholds. Observability provides the trace data required to investigate those alerts, locate the failing step, apply a fix, and confirm that the issue does not recur. Monitoring highlights symptoms, while observability exposes root causes.
Tool-call observability
Agents interact with external systems through tool calls, and a single user request can trigger a sequence of tool invocations where each call depends on the output of the previous one. When one tool call fails or returns unexpected data, every step that depends on it will produce incorrect results.
What to capture for every tool call
- Tool selected and why: The trace should record which tool was selected by the agent and the reasoning context that led to the selection.
- Arguments passed: Agents construct tool arguments dynamically based on prior context. Capturing the exact arguments makes it possible to spot hallucinated parameters, missing fields, or incorrect formatting.
- Output returned: The raw response from the tool, including partial results, empty responses, or error messages that the agent may interpret incorrectly.
- Latency, cost, retries, and failures: Each tool call adds latency and cost to the overall request, and retry loops can silently multiply both time and cost without any visible error.
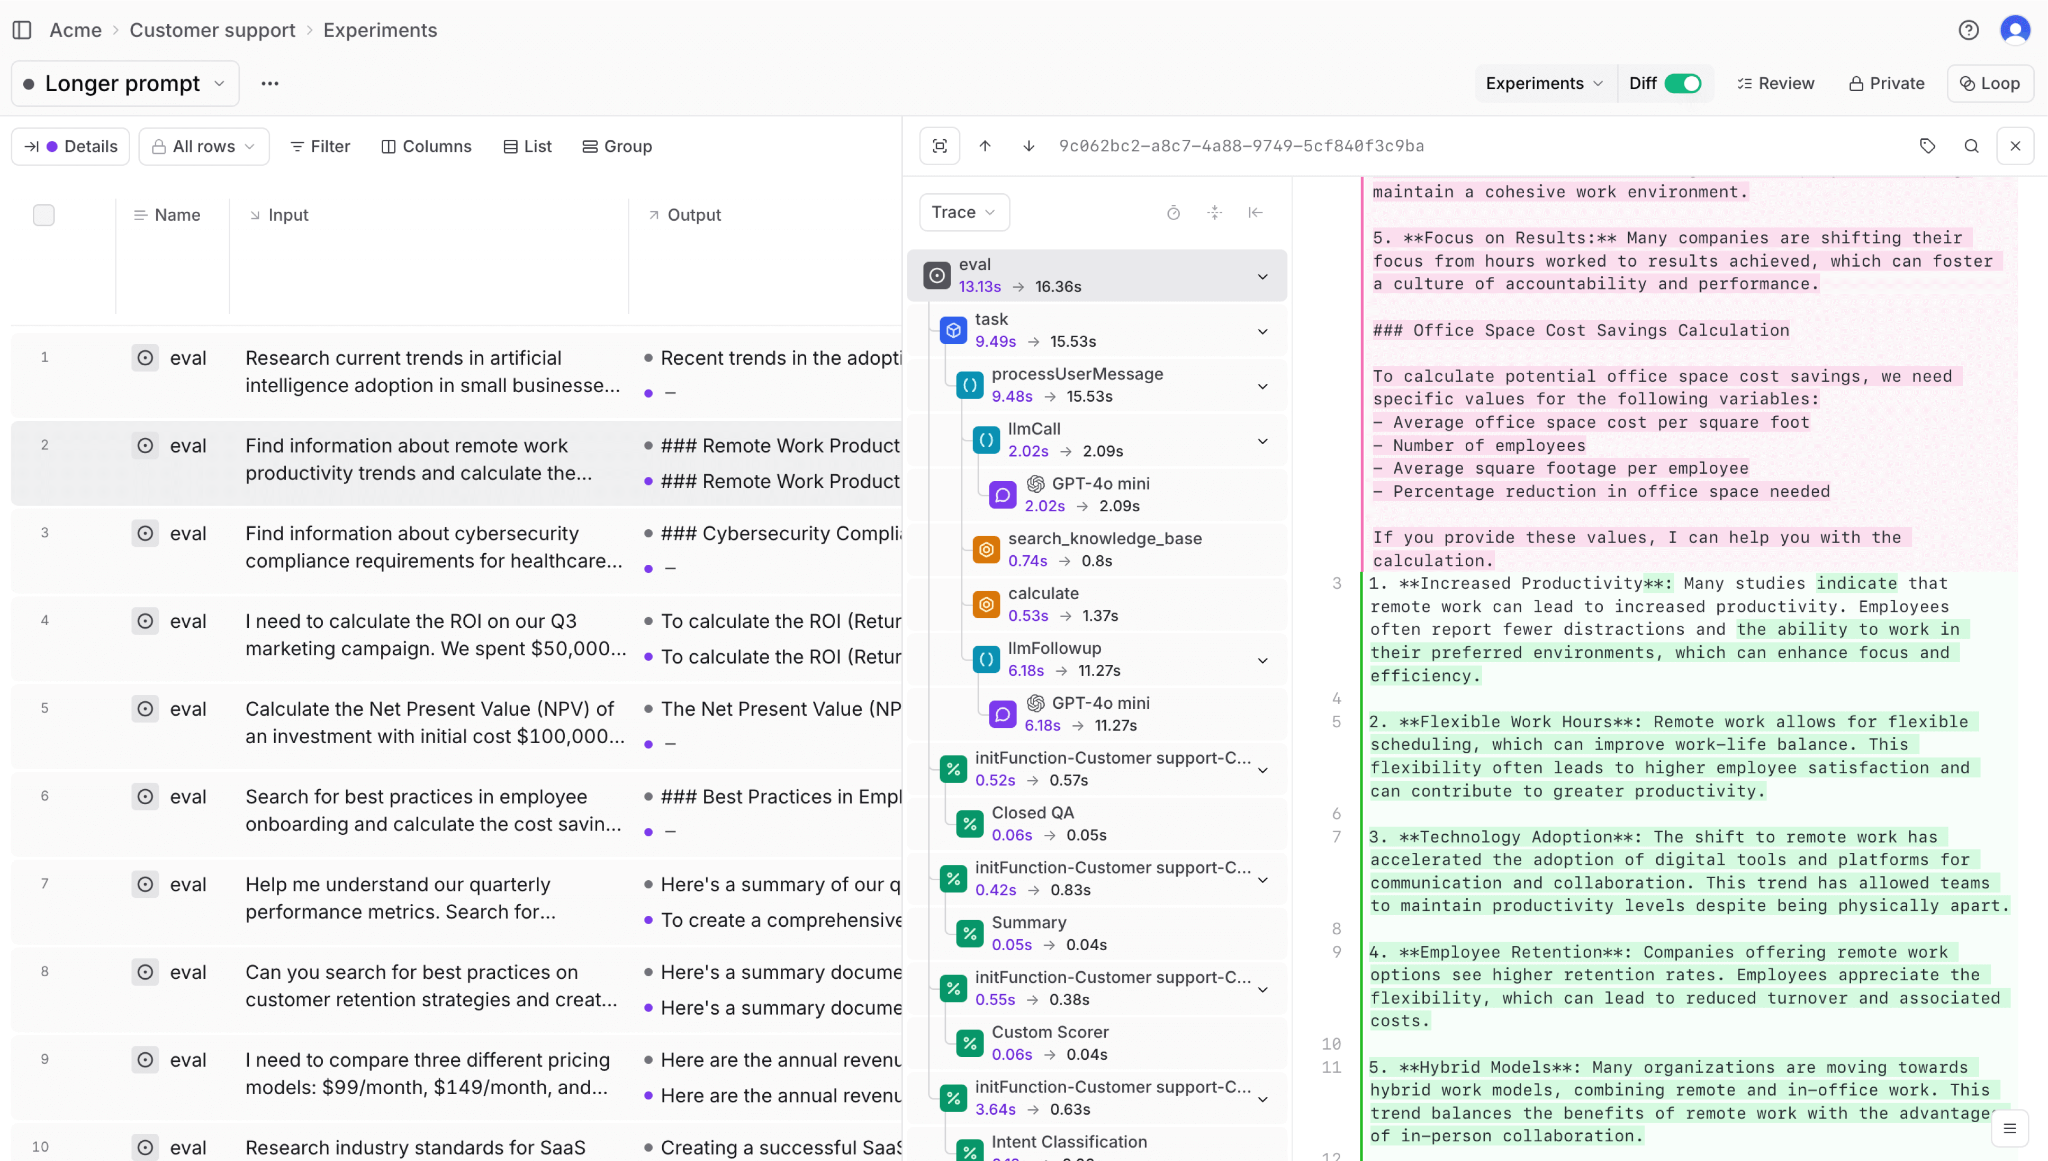
Good instrumentation records each tool invocation as a typed span nested under the parent LLM span. The span captures input arguments, output data, error state, and timing so that engineers can see the full tool-call chain for any request and pinpoint where the breakdown occurred.
Memory observability
Agents rely on memory to maintain context across conversation turns, recall information from previous sessions, and retrieve relevant documents through RAG pipelines. Memory gives agents the ability to reason over historical data, but it also introduces failures that are difficult to detect without observability into what the agent reads and writes.
Read stage
The trace needs to capture the retrieval query the agent issued, the entries that were returned, and any relevance scores. Two common failure patterns during retrieval are:
- Stale reads: The agent retrieves a memory entry that was correct earlier but has since been updated, and that outdated information leads to a wrong answer.
- Wrong-entity retrieval: The agent pulls memory associated with the wrong user or session, producing responses with incorrect personal details and no system-level error to flag the problem.
Write stage
The trace should record what the agent stored, where it was stored, and what triggered the write.
- Compounding errors: An incorrect memory write in one session becomes input for future decisions. That single incorrect write can affect later sessions as it continues to be retrieved and used.
- Memory leakage: Context from one user's interaction appears in another user's session, creating accuracy and compliance risks.
Logging retrieval queries, returned entries, freshness metadata, and memory writes as individual spans allows engineers to trace incorrect output back to the exact context the agent read or wrote, and to identify the source of the issue.
Multi-step workflow observability
Agents operate through a plan-act-observe loop where they generate a plan, execute an action, observe the result, and then decide whether to continue, re-plan, or branch. The execution path can change with every request, so simple log files do not clearly show what happened during a run.
Failure patterns in multi-step workflows
- Plan drift: The agent starts working toward one goal and gradually shifts to a different objective without explicit re-planning, producing an output that seems correct but answers the wrong question.
- Infinite loops: The agent moves between the same steps because neither produces a usable result. Without step-level timing data, this shows up only as an unexplained delay.
- Sub-agent coordination failures: Agent A sends an incomplete or incorrect context to Agent B, and Agent B continues based on wrong assumptions. Without cross-agent tracing, the team debugging Agent B's output cannot see that the root cause was an upstream handoff problem.
Step-level visibility requires recording each step as a nested span along with the reason the agent chose the next action. The trace should capture the order of steps and decision points, where execution moved away from the original plan and why, branching and sub-agent handoffs with correlation IDs so the full workflow stays connected across agents, and stuck states where the agent repeated steps without making progress.
How to instrument agent observability in practice
There are three main integration approaches, ordered from fastest setup to deepest visibility.
Proxy-based integration routes agent requests through an observability proxy that automatically logs every LLM call. Setup takes minutes and requires no code changes, but the proxy captures only LLM-level data, without visibility into custom tool calls or business logic.
SDK integration wraps LLM clients and tool functions with tracing instrumentation that captures the full execution graph, including custom spans for tool calls, memory operations, and business logic. SDK integration takes more setup time but produces the most complete traces.
OpenTelemetry integration exports traces in a standard format to any compatible backend. Teams that already use OpenTelemetry can send agent traces alongside existing application telemetry without maintaining a separate observability pipeline.
Across all three approaches, the core data model stays consistent.
- Traces represent the end-to-end execution of a single agent run.
- Spans represent individual operations within that trace, such as an LLM call, a tool invocation, or a memory retrieval.
- Sessions group related traces together across multi-turn conversations or extended workflows.
Evaluation connects tracing data to measurable quality.
- Online evaluation scores live production traces using automated scorers and LLM-as-a-judge checks, catching quality regressions as they happen.
- Offline evaluation runs the agent against a curated dataset of golden test cases before deployment, validating that changes improve quality without introducing new failures.
The feedback loop between online and offline evaluation converts production failures into test cases and validates fixes against those cases before deployment.
How Braintrust powers agent observability
Braintrust provides the tracing, evaluation, and monitoring infrastructure that production agents require, and connects all three into a single workflow where observability feeds directly into evaluation and improvement.
Capturing the full execution graph
Exhaustive auto-tracing captures every LLM call, tool invocation, and retrieval step with duration, token usage, separated LLM and tool errors, and estimated cost. When teams use Braintrust SDK wrappers or the Braintrust gateway, traces require no manual instrumentation.
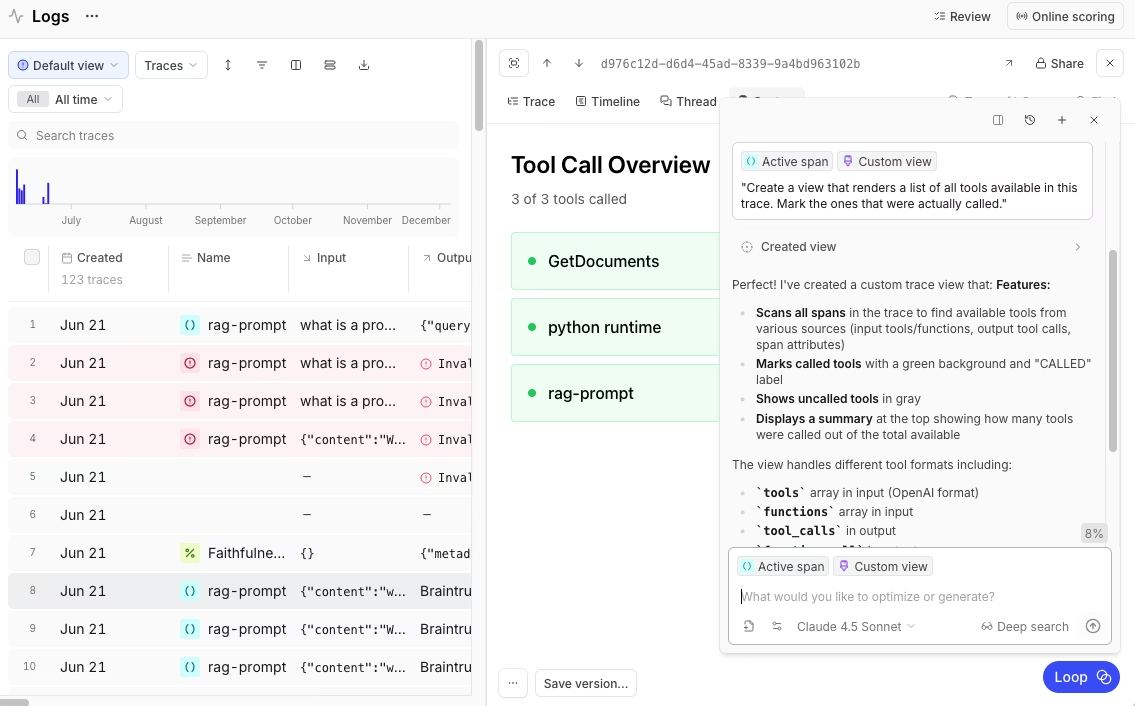
Nested span hierarchies display the full agent execution graph. Each tool call appears as a typed span nested under its parent LLM span, with input arguments, output data, and error state recorded for every step. Engineers can open any trace and inspect the full decision path from initial request to final response.
Braintrust supports three integration paths to match different environments. Native SDKs integrate with more than 20 frameworks, including OpenAI Agents SDK, LangChain, CrewAI, and Vercel AI SDK. The BraintrustSpanProcessor converts OpenTelemetry spans into structured agent traces. The Braintrust gateway provides immediate visibility without code changes by logging requests while forwarding them to supported model providers.
Turning traces into quality signals
Evaluation runs within the observability workflow, so teams can score live production traces with LLM-as-a-judge and convert any trace into a test case in a single integrated workflow. Braintrust supports agent-specific patterns, such as capturing intermediate tool-call data through hooks.metadata inside eval task functions.
// Capture intermediate tool calls for step-level scoring
export async function taskFunc(input, hooks) {
  // Run the agent...
  if (rsp.choices[0].finish_reason === "tool_calls") {
    const toolCalls = rsp.choices[0].message.tool_calls;
    hooks.metadata.tool_calls = toolCalls;
  }
  // Continue execution...
}
Inline scorers can run at specific execution steps. A hallucination scorer, for example, activates only when the agent produces a final response and skips tool-call spans. This allows step-level scoring without adding noise to unrelated parts of the workflow.
if (!res.choices[0].message.tool_calls?.length) {
  // Start hallucination scoring in the background (fire-and-forget)
  runHallucinationScore({
    question: message,
    answer: res.choices[0].message.content,
    context: documents,
  });
  break;
}
Native CI/CD integration through GitHub Actions runs evaluations on every pull request, blocking merges that would degrade agent quality. The same evaluation definitions apply across local development, CI, and production, ensuring consistent quality checks at every stage.
Scaling investigation and iteration
Loop, Braintrust's AI assistant for evaluation development, understands natural language instructions and acts directly on production trace data. Teams can describe the failures they want to investigate or the behaviors they want to test, and Loop analyzes traces, generates evaluation datasets, suggests prompt improvements, and recommends custom scorers.
Brainstore, Braintrust's data store built for AI workloads, supports fast queries across millions of agent traces. Agent traces can grow large because they include tool calls, nested spans, and detailed metadata, which traditional databases often struggle to handle efficiently. Brainstore is designed for large, deeply nested trace data, allowing teams to search and inspect full traces without sampling or losing data.
Dropbox, Stripe, Notion, Coursera, Perplexity, Zapier, and Vercel use Braintrust to maintain reliable observability across complex agentic systems in production.
Start using Braintrust for free to bring full visibility and control to your production AI agents. The free tier includes 1 GB of processed data and 10,000 evaluation scores per month, which is enough to evaluate an agent in production.
Conclusion
Agent observability keeps multi-step systems reliable as agents plan, act, and adjust across complex workflows. When each step is traced and linked to measurable quality signals, teams can identify the exact point where execution failed rather than diagnosing problems from final outputs alone.
Braintrust unifies tracing, evaluation, and CI enforcement in a single workflow, so teams can inspect real agent runs, enforce quality gates before deployment, and scale autonomous systems with confidence. Get started with Braintrust for free to add agent observability to your production workflows.
Agent observability FAQs
What is agent observability?
Agent observability captures and analyzes how an AI agent executes a task across its full workflow. It records the steps the agent takes, the tools it calls, the memory it reads or writes, and the decisions it makes along the way. Instead of logging only the final output, agent observability reconstructs the execution path so teams can understand how a result was produced.
How is agent observability different from LLM observability?
LLM observability tracks a single model call, including the prompt, response, token usage, and latency. Agent observability tracks the entire workflow behind a request, including multiple model calls, tool invocations, memory accesses, and agent-to-agent delegation. It connects those steps into a single execution path so teams can see how data moved and where decisions were made.
How do I evaluate multi-agent systems?
Evaluating multi-agent systems requires tracing across agent boundaries using correlation IDs and shared trace context so the full execution graph remains visible even when one agent delegates work to another. Teams should evaluate both individual agent performance at each step and the end-to-end outcome of the complete workflow. Braintrust supports inline scorers per step and end-to-end evaluation with hooks for capturing intermediate results across agent handoffs, enabling pinpointing whether a failure originated in the delegating or receiving agent.
What tools do I need for agent observability?
Braintrust provides the tracing and evaluation infrastructure required for production agent observability. Braintrust captures full execution traces with nested spans, records tool and memory operations automatically through SDKs or the Braintrust gateway, and attaches step-level and end-to-end scoring directly to live production runs. Teams can search for traces, convert failures into test cases, and enforce quality gates in CI without needing separate logging and monitoring systems.
How do I get started with agent observability?
Start by enabling tracing so every agent run produces a structured execution record. The Braintrust gateway provides immediate visibility with no code changes, and SDK integration adds deeper step-level tracing. From there, connect tracing to automated scoring and convert production traces into evaluation datasets. Braintrust's free tier includes 1 GB of processed data and 10,000 evaluation scores per month, which is enough to instrument live traffic and run meaningful regression tests from day one.