Experiments UI: Now 10x faster
Experiments in Braintrust are now significantly faster, powered by Brainstore. Here's how we solved a critical performance challenge.
The challenge
Experiments are core to the evaluation feedback loop in Braintrust. They're where you analyze results over time through rich visualizations and detailed metrics. You can instantly identify score regressions by specific fields and compare megabytes of JSON using side-by-side diffs, all while monitoring key metrics like cost, token counts, and error rates.
Behind the scenes, we initially leveraged DuckDB for client-side computation in the browser. This required loading all spans for an experiment into the browser and running queries to aggregate and calculate summary scores and metrics for each test case. This worked well at first, and enabled us to quickly iterate on features like custom filters, metric and score comparisons, and multi-experiment views. We could also ship updates without requiring customers using our hybrid architecture to redeploy.
However, experiments have grown exponentially over the past year. What began as 10–20 test cases per experiment has expanded to hundreds of thousands. The test cases themselves have also become more complex, incorporating multi-step agents and extensive external context.
As the volume of data grew, we began to hit the limits of browser-based processing. Memory constraints led to errors when DuckDB tried to process larger amounts of data and execute calculations with complex joins and subqueries.
The solution
Moving these calculations to the backend wouldn't solve the problem. The core issue was that SQL databases have trouble handling complex JSON structures and large text volumes. This was the same challenge that originally motivated us to create Brainstore for logs.
Brainstore is our high-performance analytics engine purpose-built for querying massive volumes of semi-structured LLM data. We initially supported spans and traces query shapes, which provide access to raw, minimally processed data. To support fast, aggregated views, we’ve now introduced a new summary query shape.
The summary shape enables row-per-input aggregation over trace and span data, computing scores, applying filters, and projecting custom fields in a single request. Unlike SQL queries that would require complex GROUP BY or JOIN operations, Brainstore lets us control exactly how data is computed. For example, we can efficiently fetch all spans within a trace in one request.
Real-time visibility
Our customers want to view experiment results immediately after running them. This is at odds with the traditional architecture of a columnstore which has high latency consumption.
Brainstore merges realtime data from its write-ahead log (WAL) with historical data from its object storage-backed columnstore in a single pass. This makes recent test results instantly available in queries without waiting for background indexing, while still allowing for fast access to older experiment data. Some experiment logic is implemented across both systems to ensure consistent, accurate results, no matter where the data is coming from.
Showing realtime data was more straightforward when we loaded the raw experiment data directly in the browser, because we could merge incoming rows into the base data and recompute the summary directly in the UI. We know how important viewing live data is to our customers though, so figuring this out in the new method was non-negotiable.
We still ended up using DuckDB to help us merge rows (mostly so that we did not have to refactor downstream UIs that still rely on it), but reworked realtime to limit the amount of data the browser receives. When an experiment loads, we do two steps to enable the realtime flow:
CREATE TABLE <exp_summary_table> ... ADD PRIMARY KEY (id)with the rows from the initialsummaryquery executed on page load.- Open a channel that receives an event every time a span is updated on that experiment.
The summary for each row now happens on the backend, so when an event arrives the root_span_id is added to a Set. A throttle function then batch refetches rows via a summary query, filtering for all collected root_span_id values. With the result of that query, we do some magic to parse the scores and metrics to ensure any new columns appear in the table, and then
INSERT INTO <exp_summary_table>
...
ON CONFLICT(id) DO UPDATE
SET <fields>
WHERE EXCLUDED._xact_id >= _xact_id
Finally, the UI is informed of this data refresh and the new summaries appear in the table, ensuring all the latest data is available to you.
Efficient preview aggregation
The final summary result returns a smaller payload to the browser by truncating user-defined fields (like input, output, metadata) based on the preview_length parameter in the query, as these fields can contain deeply nested JSON.
In a SQL database, it’s only possible to truncate string previews after fully serializing a document. Believe it or not, this is quite slow. Brainstore avoids this by utilizing a custom streaming JSON serializer that is around 8x faster for large objects with many small strings (2MB+). In the case of one customer, this optimization reduced load time by six seconds for a single large experiment.
Aggregate scores and custom columns
When customers define weighted scores and custom columns in the UI, the values need to be pulled from deeply nested structures. Summary queries in Brainstore support rich custom logic by incorporating aggregate scores and custom columns directly into the query plan. These expressions are compiled during planning and evaluated during execution.
Unlike traditional warehouses that force JSON into rigid schemas, Brainstore processes the raw semi-structured data directly: computing weighted scores, adding comparison keys, and resolving custom columns during query execution. These fields are applied only after retrieving the relevant spans, ensuring projections happen exclusively on the necessary data.
Dynamic filtering across all fields
We also need to enable customers to filter across everything from basic fields like input or metadata.tags to computed metrics like duration or prompt_tokens, and even custom-defined fields.
The basic fields like input are present in the raw data and can be filtered before any aggregation. Other fields like duration are computed across multiple spans in a trace. We take into account the duration for each span to get the duration for the full test case, so filters on these fields must be handled post-aggregation.
In traditional SQL systems, filtering can be extremely slow and resource-intensive because you cannot stream or limit the number of rows you are computing on. Brainstore has custom logic to efficiently analyze the query and determine which filters can be executed pre-aggregation and which must be post-aggregation. This split-planning lets Brainstore efficiently compute post-aggregation filters without sacrificing performance. It also enables something no other provider offers: the ability to define custom fields and filter on arbitrary, computed metrics.
By bringing summary computation server-side and pairing it with Brainstore’s real-time, schema-flexible architecture, we’ve made it possible to analyze millions of test cases in seconds with no trade-offs between speed, flexibility, or correctness.
Benchmark comparison
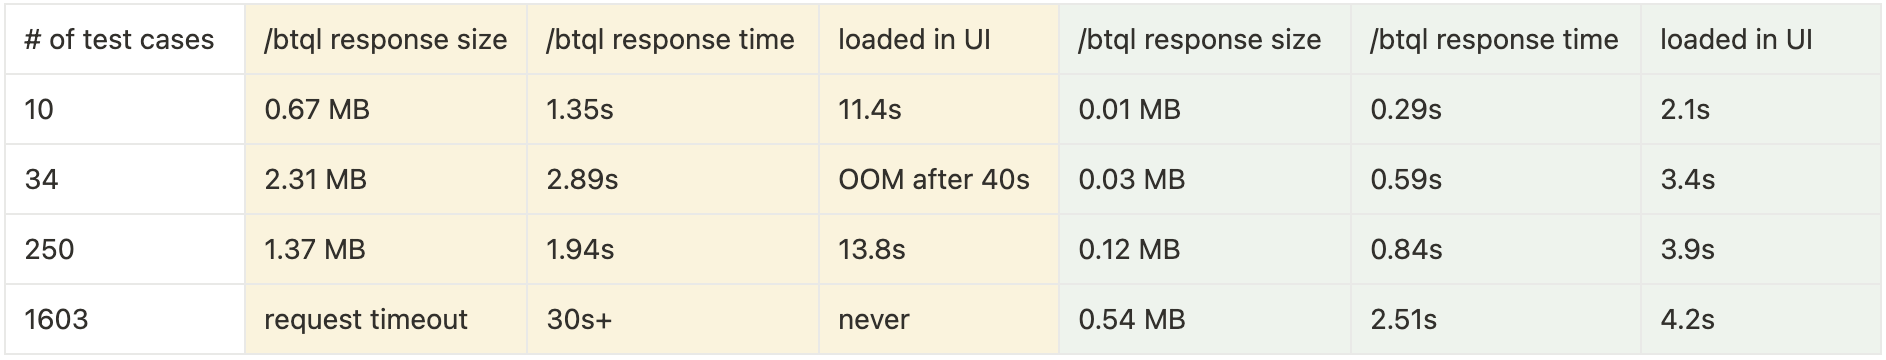
The table below shows a few examples of the impact this optimization has made for some of our customers. The yellow columns are the numbers before the optimization, and the green columns are after.
 Note: The notable difference in the yellow section between
 /btql response time and loaded in UI reflects the summary computations performed in the UI.
We've significantly enhanced overall performance and customer experience. Still, we're actively working to further reduce table loading times following the completion of the /btql request. Stay tuned for additional updates and improvements.
Faster experiences across Braintrust
These performance upgrades extend beyond experiments. They are also available in log and dataset tables, for a consistently fast experience across Braintrust.
If your team needs scalable, high-performance LLM observability, reach out.