Understand how agents use your MCP server
Making your product available through MCP has become table stakes for developer experience. You don’t always control the agent using it, though, or have access to the conversations. A tool call might return a successful response but the agent could still get the wrong data or misunderstand it. To understand what’s going on, you need more than server errors.
You can now trace your MCP server in Braintrust to see what agents request, what your tool calls return, and where interesting use cases and issues come up in those interactions. You can look at individual calls and use Patterns to find recurring problems. MCP tracing works with both the Braintrust JavaScript and Python SDKs, and the SDK instruments both the official MCP SDKs and third party implementations like FastMCP.
Trace MCP calls
Each traced MCP call records inputs, results, timing, and errors. You can open a call in your project’s Logs to compare the request with the response, even when the agent’s full conversation isn’t available.
For example, an agent asks your query tool for production traffic, and the tool ignores environment filters. There are extra rows in the answer it gives you, including production and staging, even though the request technically succeeded.
In the trace, you’d be able to see the request for production data and the incorrect result. You can take a look deeper into the mismatch instead of relying on the tool to tell you there was an error.
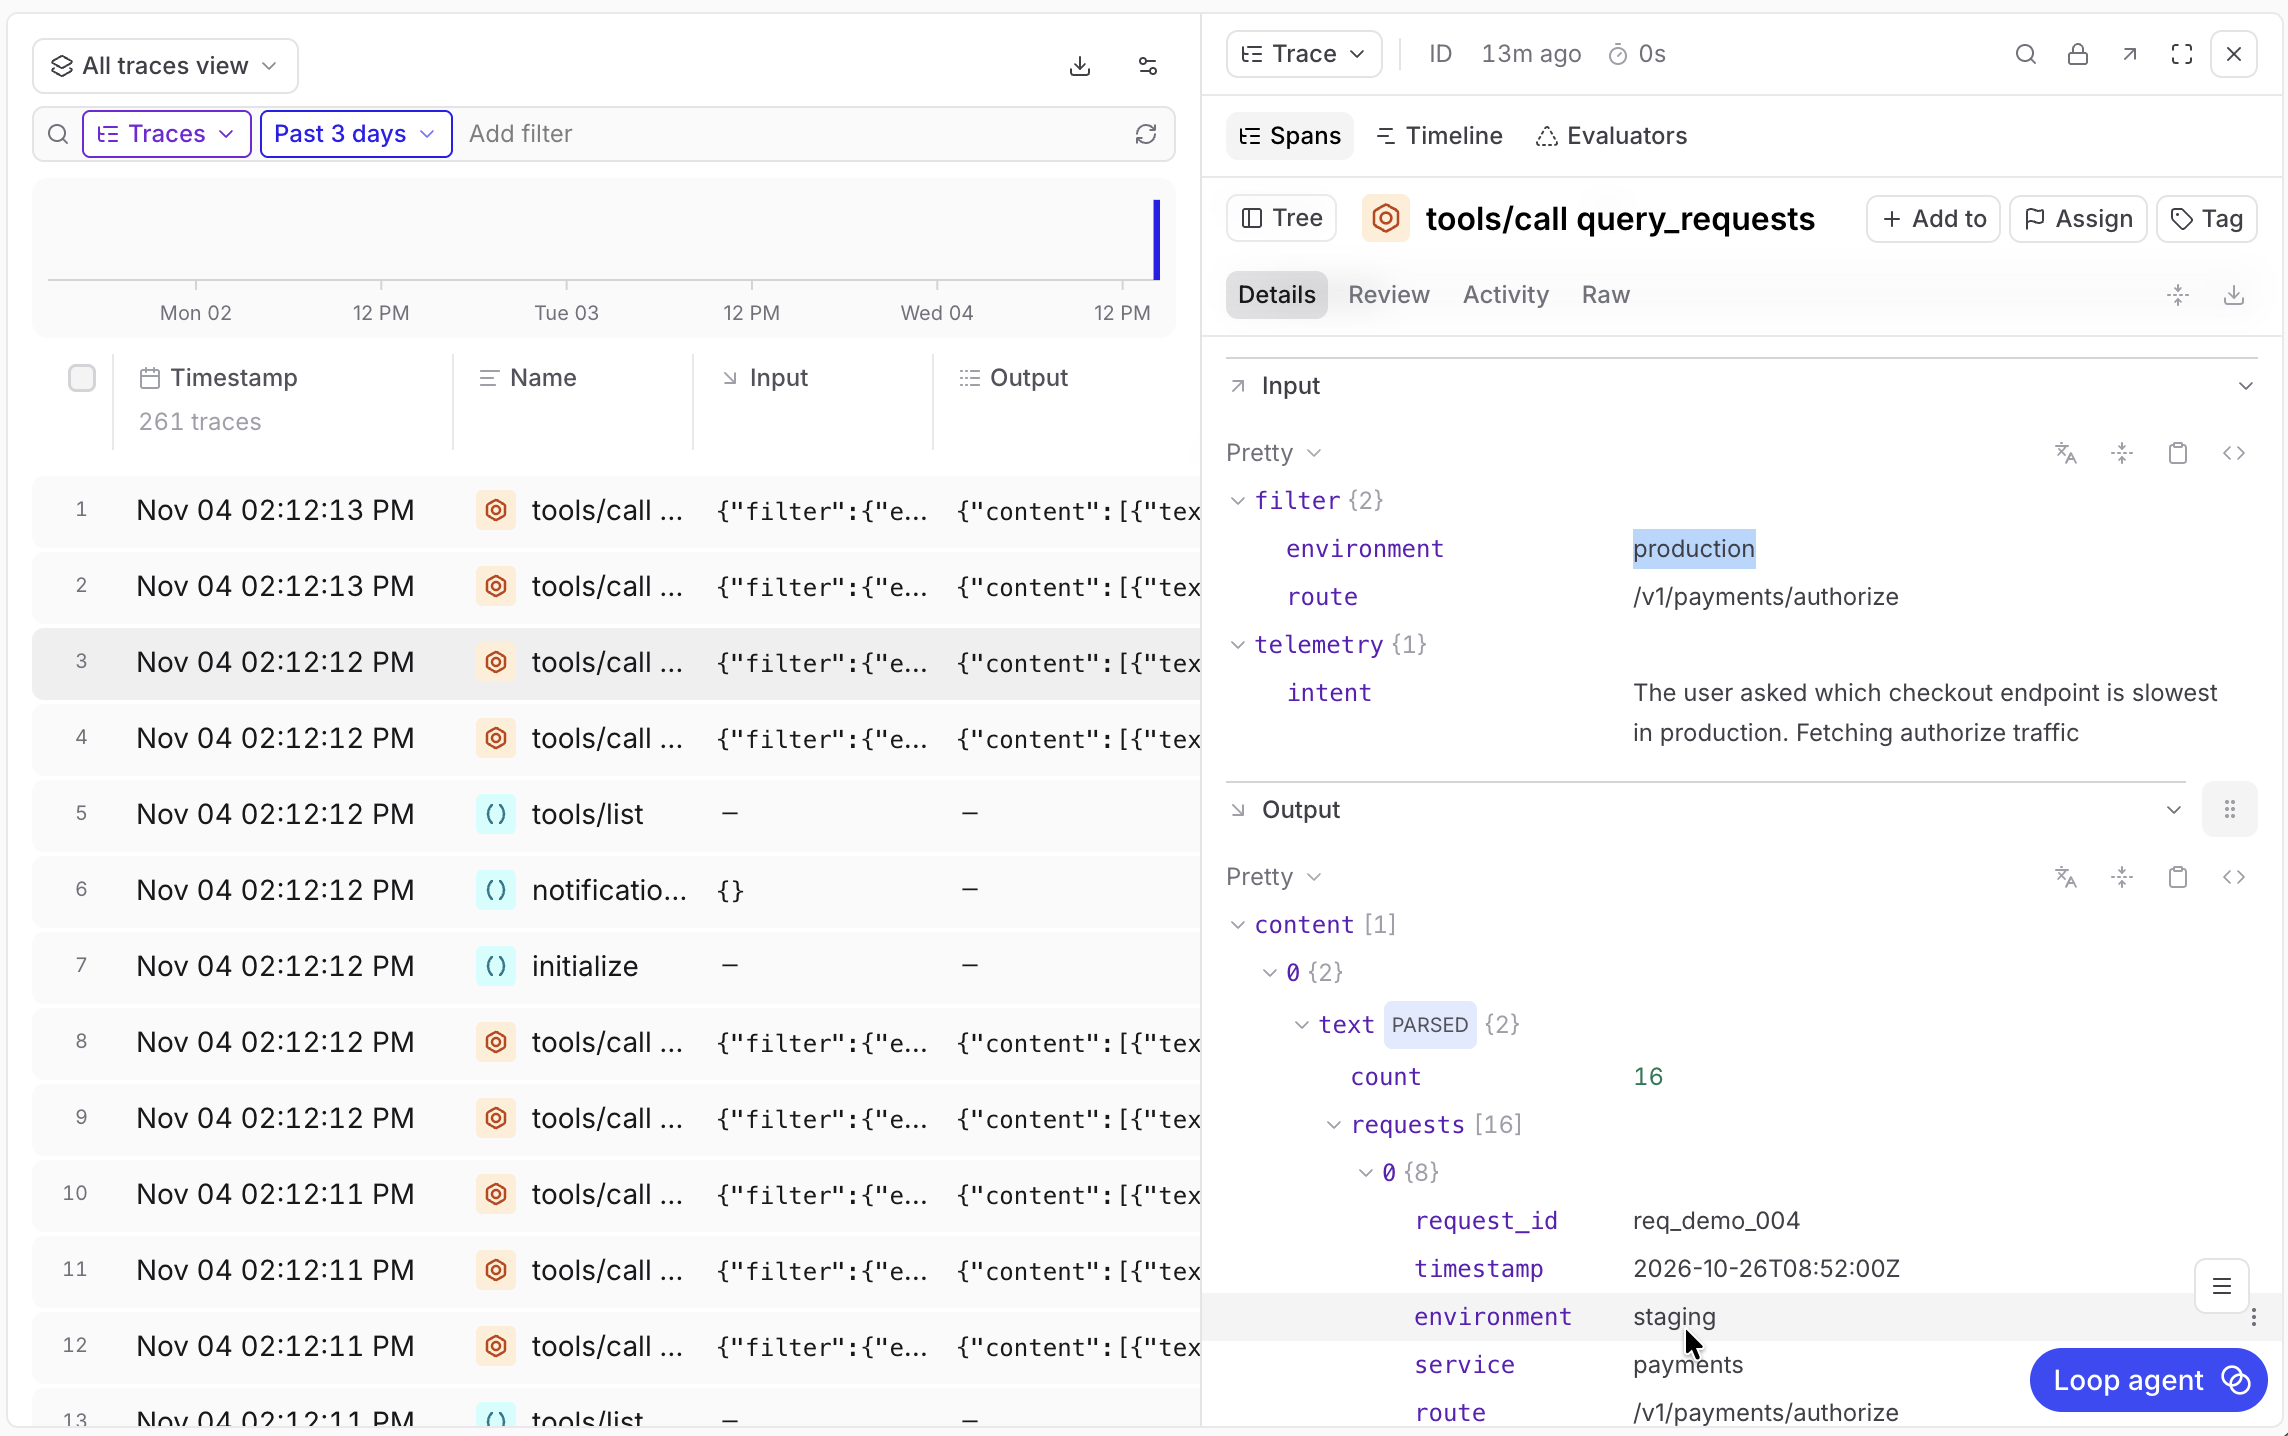
Add intent and feedback
An input shows what an agent requested. You can also ask agents to explain the context behind a specific request by adding a telemetry.intent field to your tools.
An agent querying performance data might explain that it wants to compare production latency before and after a deployment. You can record that context with the call so you have it available when interpreting inputs and outputs.
For example, after adding the optional field to your tool’s schema, a call could include:
{
  "name": "query_requests",
  "arguments": {
    "filter": { "environment": "production" },
    "telemetry": {
      "intent": "Compare production latency before and after a deployment"
    }
  }
}
You can also add a send_feedback tool so agents can report confusing responses, missing capabilities, or problems they worked around. Those reports also appear as traced tool calls that you can investigate.
Include context with the report so you can investigate it. For example, context.tool identifies the tool, and context.arguments records the inputs that produced the unexpected result:
{
  "name": "send_feedback",
  "arguments": {
    "feedback": "I requested production traffic, but the results included staging requests. I filtered those rows out before comparing latency.",
    "context": {
      "tool": "query_requests",
      "arguments": { "filter": { "environment": "production" } }
    }
  }
}
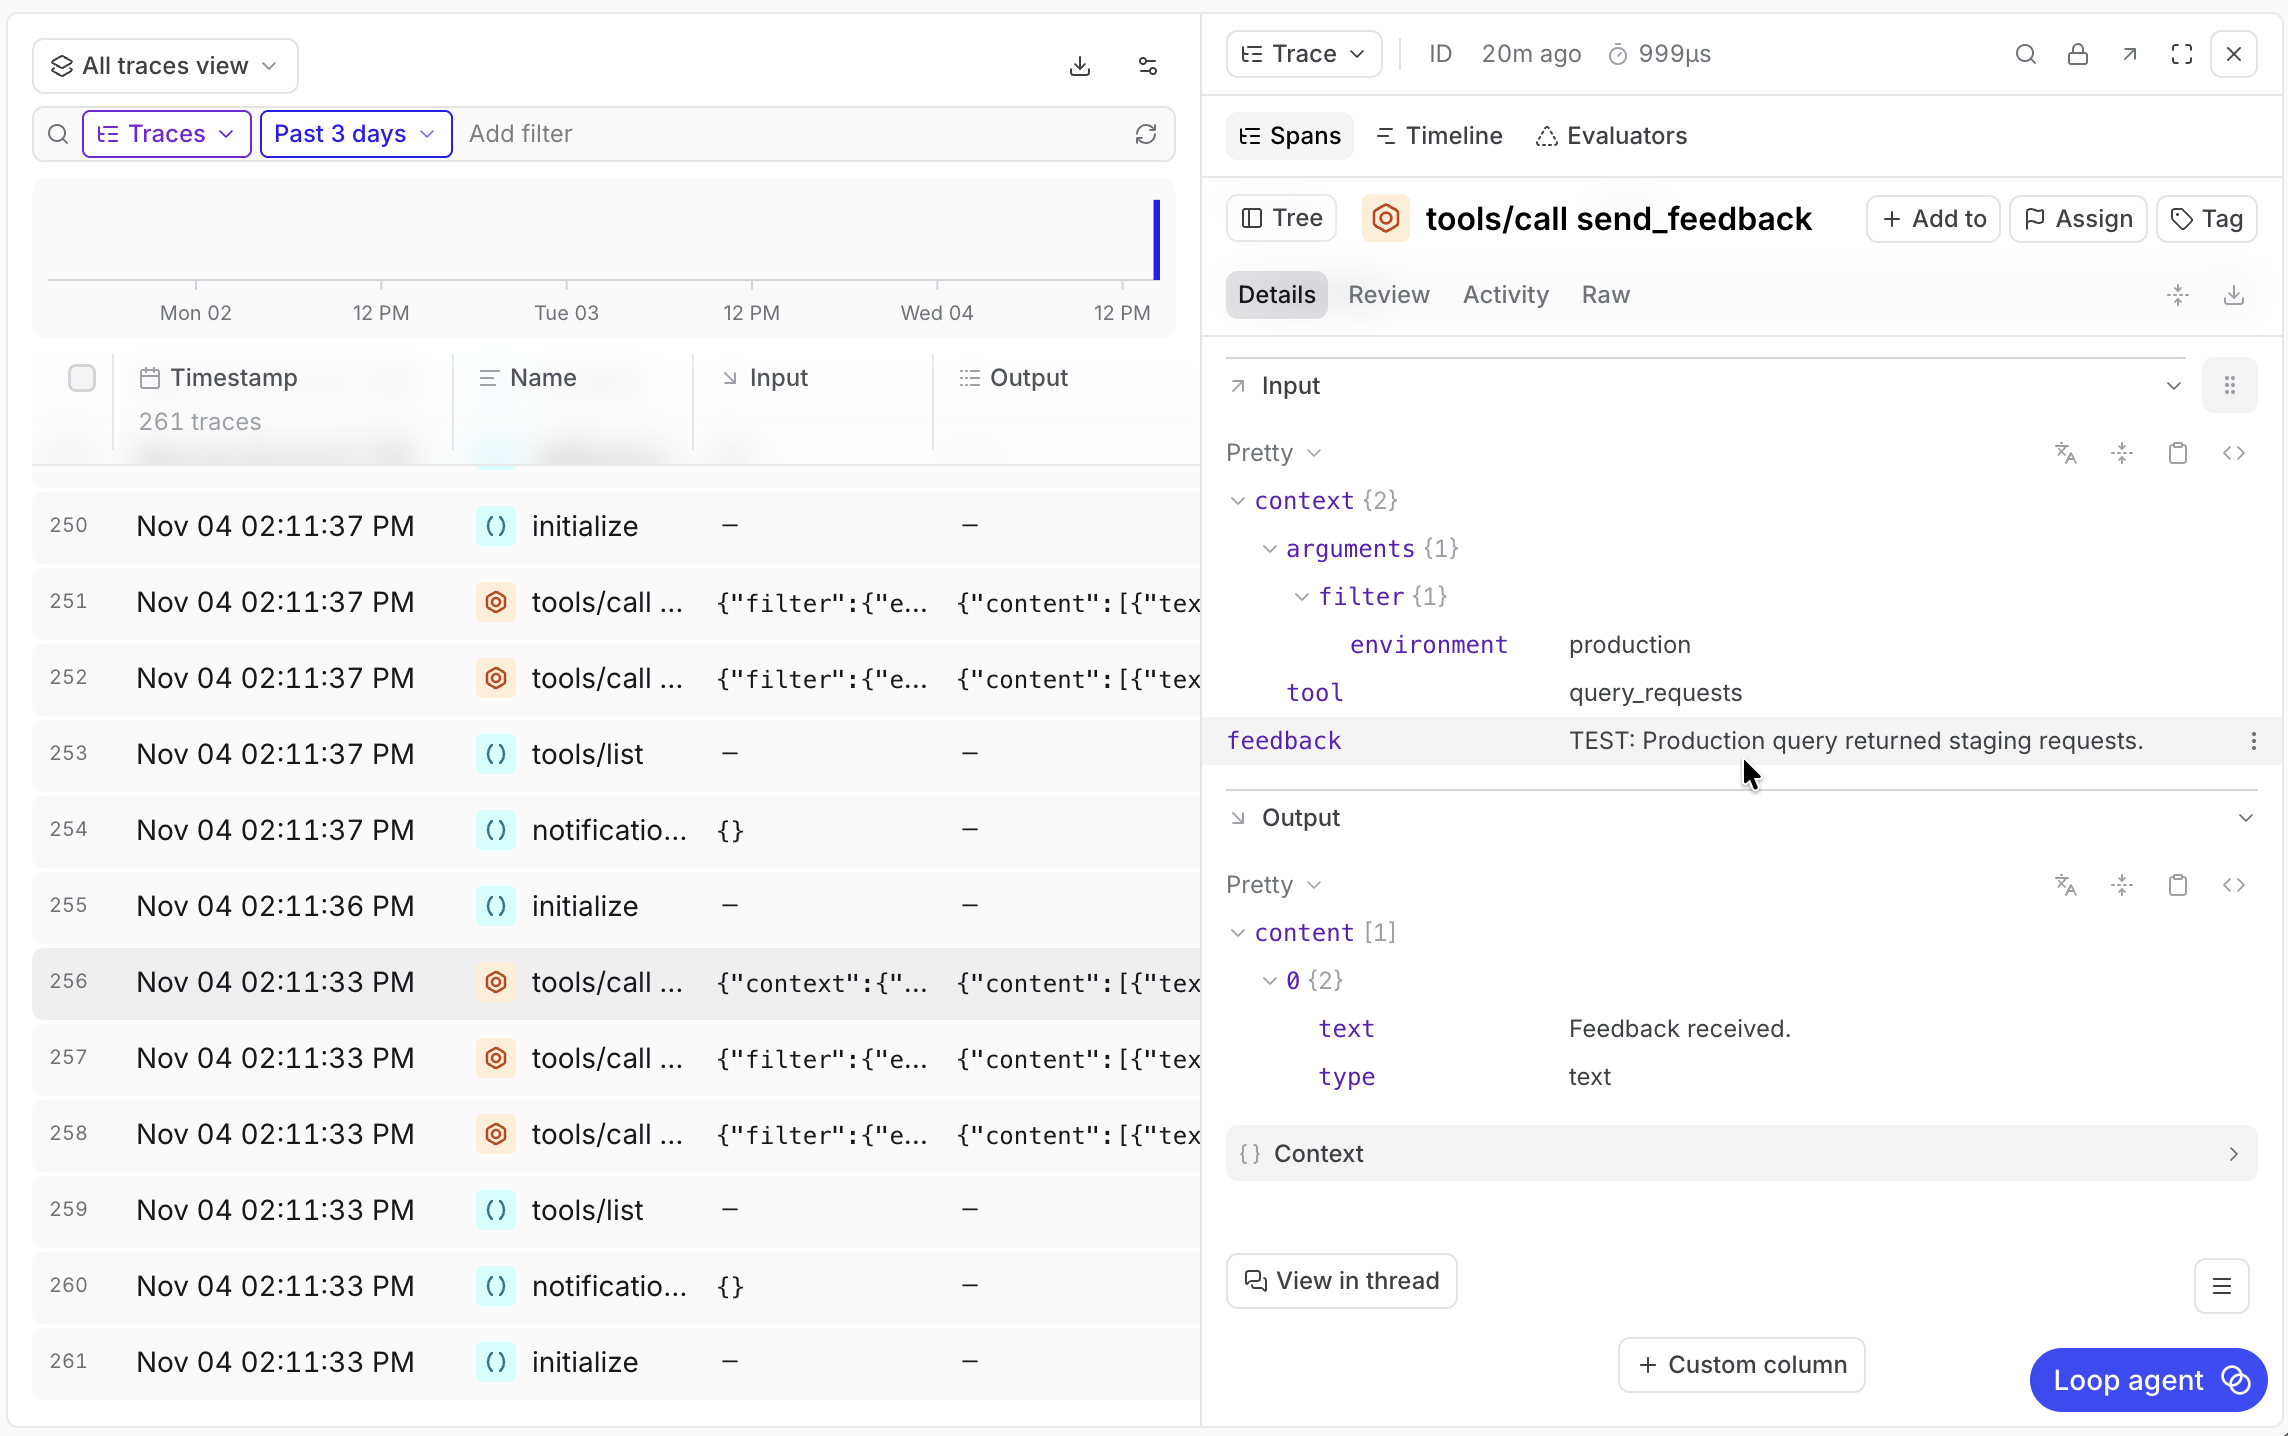
Intent and feedback are both optional additions to your server, and not required for tracing. We recommend adding both so agents can tell you what they’re trying to do and how your tools could improve.
Find recurring problems with Patterns
Once your server is sending traces, you can use Patterns to find issues, new use cases, and other repeated behaviors. Each Pattern shows up with supporting traces and suggested next steps, so you know how to implement the findings. You can also use Loop to add custom Pattern rules, or conduct more open-ended investigations about your traces.
If you add telemetry.intent and send_feedback, Patterns can use agents’ descriptions of their tasks and difficulties to surface even more helpful information about your traces.
Working through the same example as above, Patterns might find repeated calls that returned staging data despite the production traffic request. You’d be able to open the finding to look at the corresponding calls and determine what needs to change.
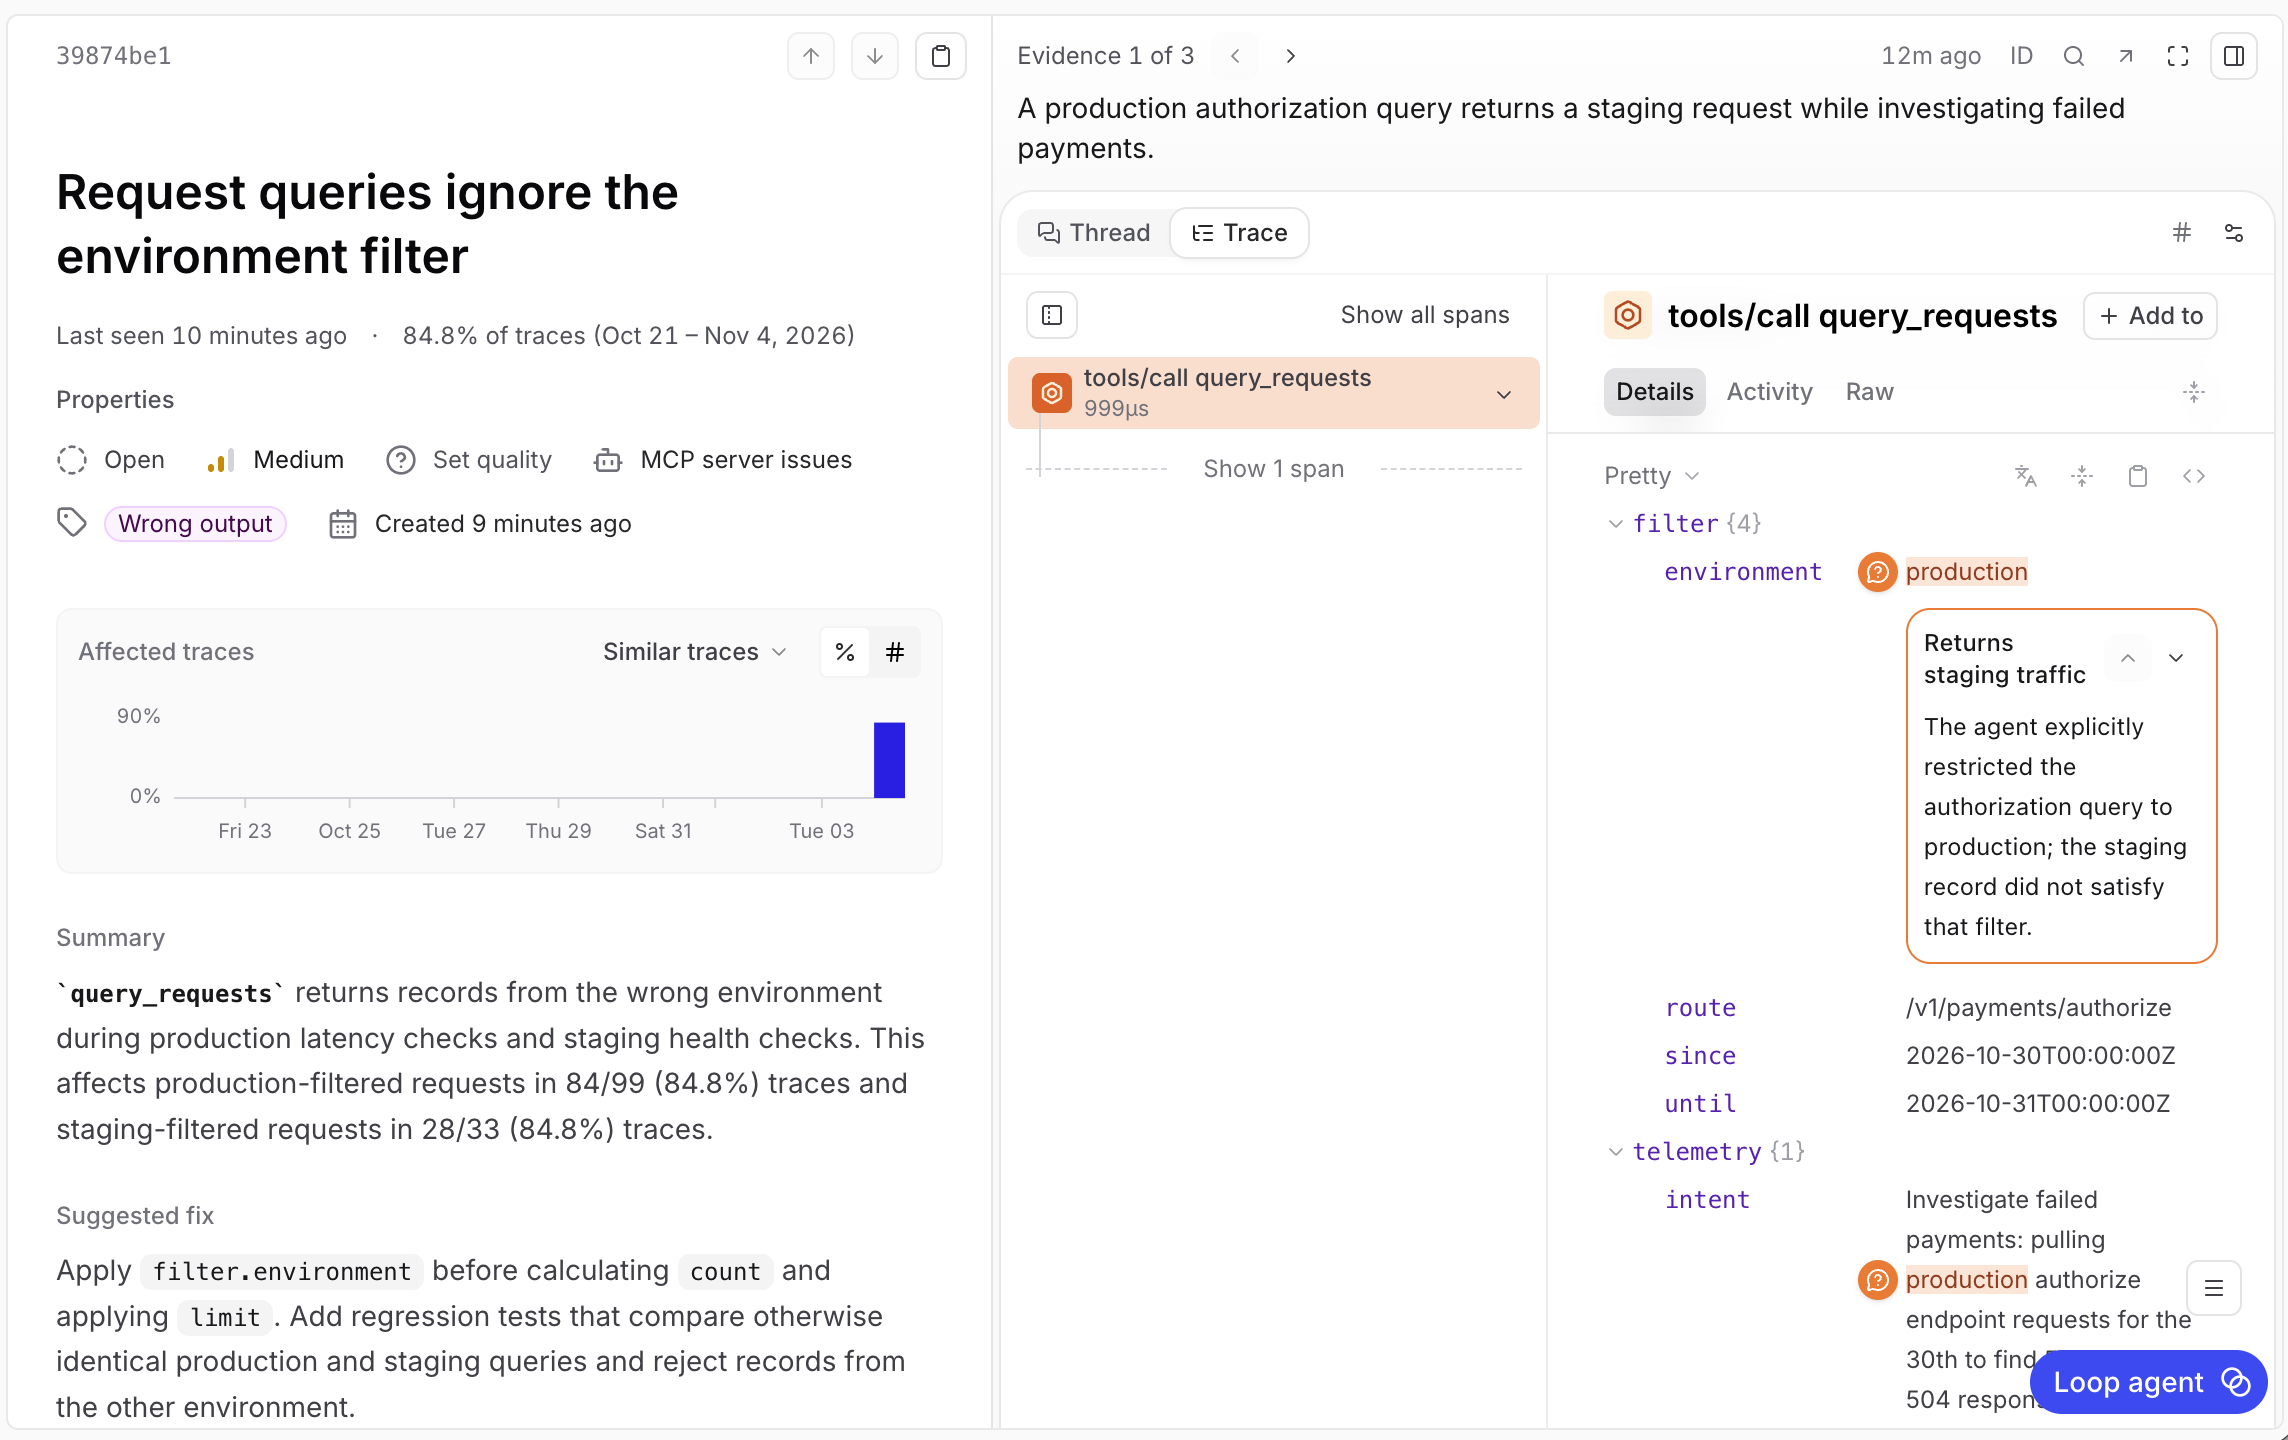
After fixing the tool, you can repeat the request and ask an agent to try the task again. From there, verify the behavior, add an automated test, and review later traces for recurrence. You can also build evals from representative calls to compare different versions of your MCP server.
Get started
Create a Braintrust project and enable MCP tracing with the Braintrust SDK. Call a tool through your usual MCP client, then open the call in Logs to inspect its input and output.
Start tracing your MCP server with the tutorial, or book a demo to see it in action.