How to earn stakeholder trust with evals and observability
The data that proves an AI feature is working sits in many different places. Eval scores live in experiments. Quality regressions surface in trace views. Cost and latency sit on engineering dashboards. Earning stakeholder trust means pulling those signals together and making them legible to design, leadership, and go-to-market.
There are three tools in Braintrust for sharing eval and observability data across your organization. Dashboards show how the feature is performing over time, aggregating cost, latency, token counts, and eval scores across logs and experiments. Custom trace views show what the AI did on a single run, turning a complex trace into a domain-specific interface anyone on the team can read. Loop answers the questions no one built a chart for, translating English into SQL over your production data and turning the answer into a dataset to investigate further.
Dashboards for aggregate visibility
A dashboard is the artifact a leadership team can read in thirty seconds. The Monitor page in Braintrust aggregates metrics across your logs and experiments, supports custom charts on top of them, and lets you select any data point to drop straight into that specific log. Putting the same data in front of every function eliminates the silos that can slow AI work down.
What goes on a dashboard
There are three chart types in Braintrust. Time series tracks a metric over time and is the right choice when you want to see whether something is getting better or worse. Top lists rank by a dimension like model, user segment, or topic, which surfaces what is driving volume or failures. Big number charts display a single value and belong at the top of the dashboard for the headline metrics a leader looks at first.
The preset charts include request count, latency, token usage, and eval scores. From there, you can configure each chart with measures, filters, and an optional group by. Measures are SQL aggregates like sum, avg, or a percentile, and full expressions like 100 * sum(errors) / count(id) work too. Trace and span filters narrow the data further, and group by splits the chart into series across a SQL dimension like metadata.model or metadata.user_segment. You can also enable Topics on the project and chart the topic distribution to show stakeholders what users are trying to do with the feature.
Three dashboard recipes
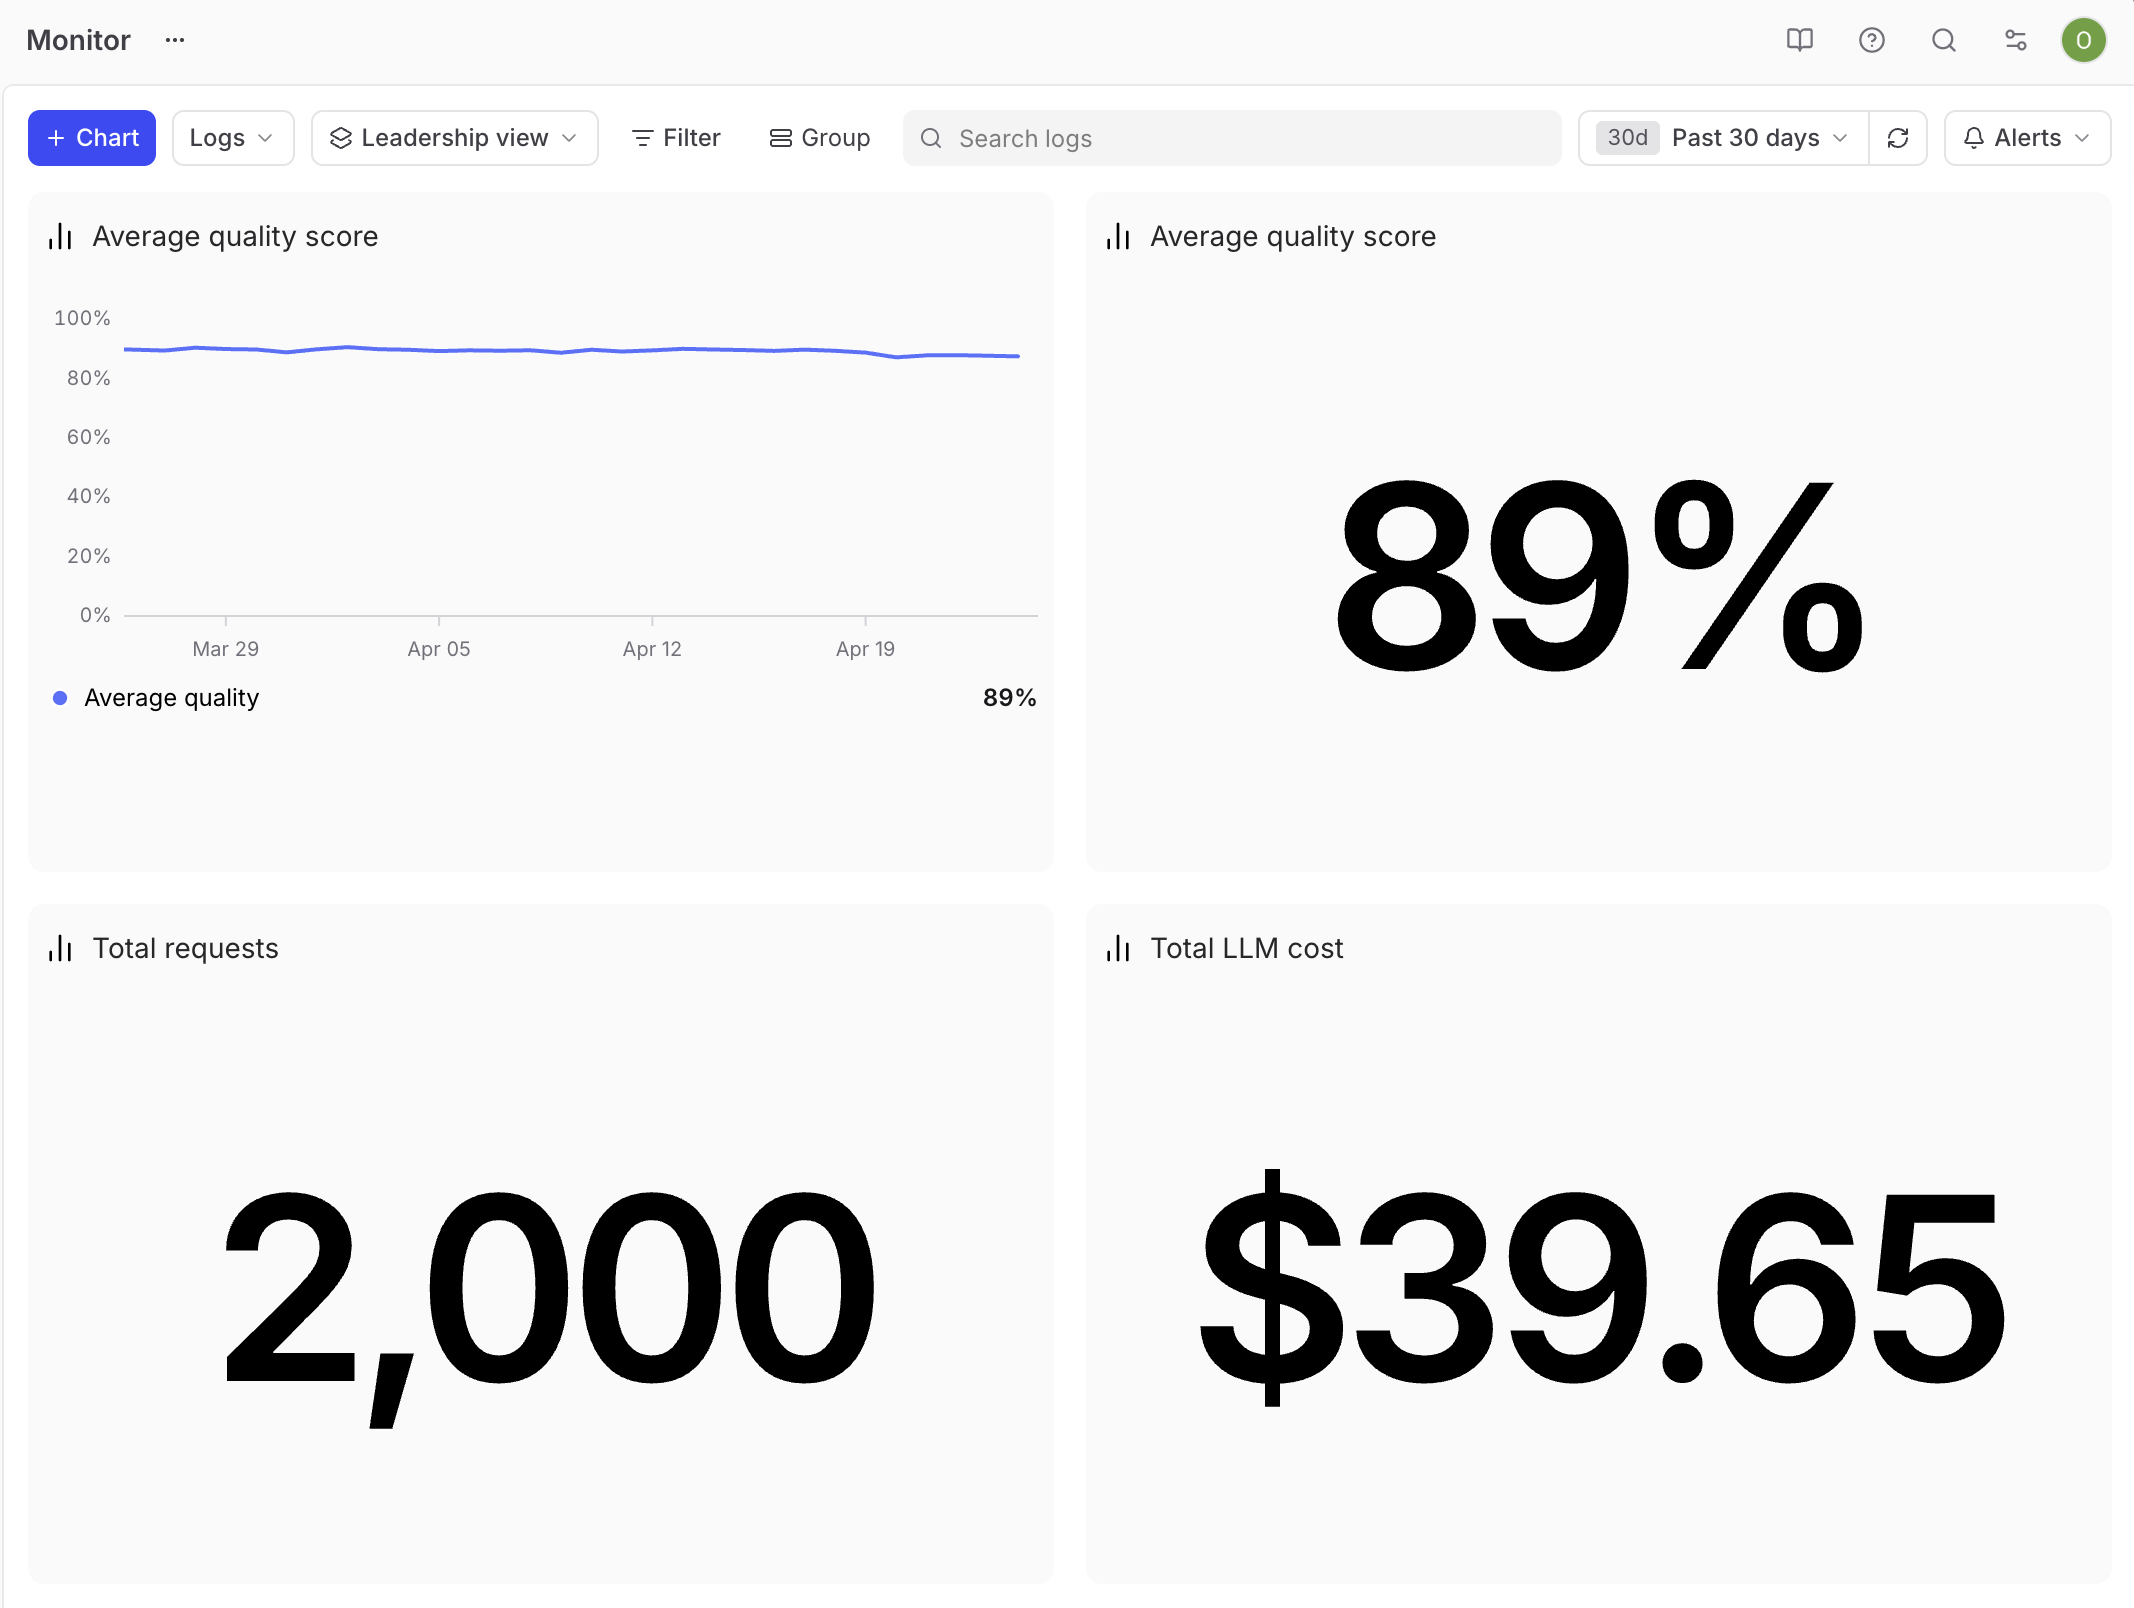
The leadership view
Leadership reviews are typically short, and executives want to know whether the feature is working and whether it is worth the spend.
The headline quality metric belongs front and center. Pair a big number for the past 30 days' average quality score with a time series of the same score, so stakeholders can see both the current value and the trend at a glance. Underneath, add two more big numbers, one for total request volume and one for total cost over the same window. Keep the dashboard small so each chart gets attention in a short review. The headline quality metric comes from an aggregate score on the project, which rolls the eval dimensions that matter for your product into a single number stakeholders can track.
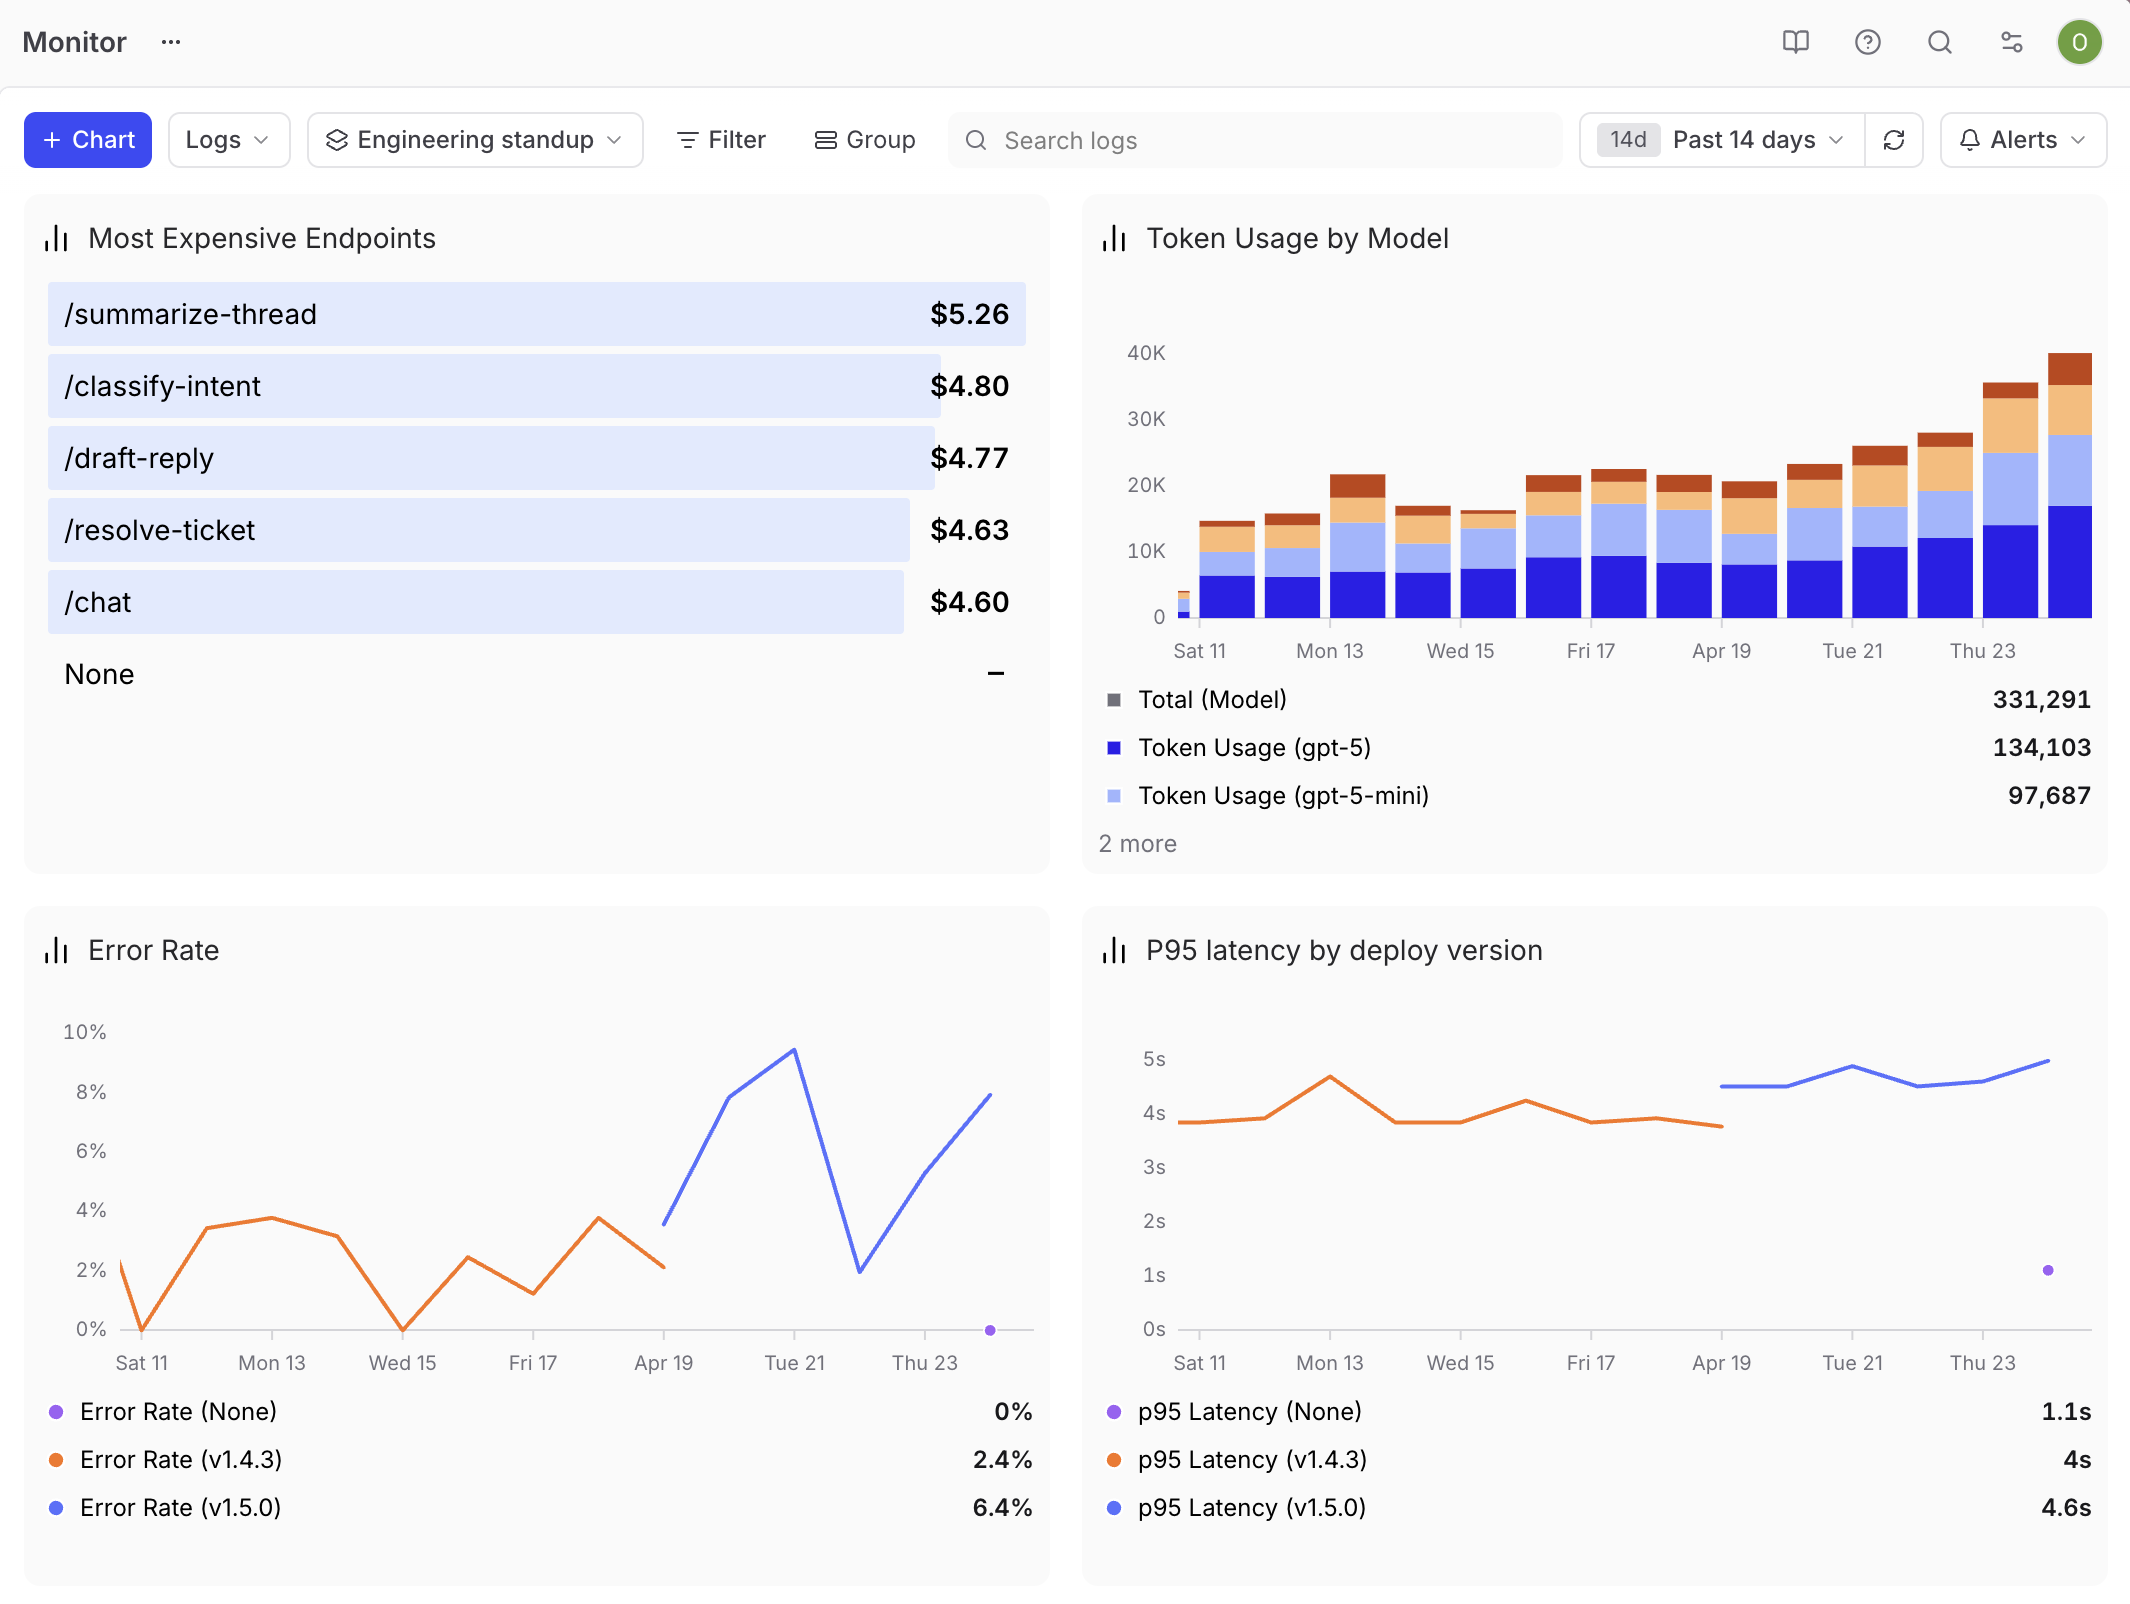
The engineering standup view
Engineers care about health and regressions. Build the dashboard around p95 latency as a time series, error rate as a time series, token usage grouped by metadata.model to show which model is driving spend, and a top list of the most expensive endpoints. Tag every trace with the deploy version in metadata, then group the latency and error rate charts by that tag so you can see when a release introduces a regression.
Drill-through is what makes this dashboard useful. When latency spikes, click the data point and start debugging the matching traces in the same flow.
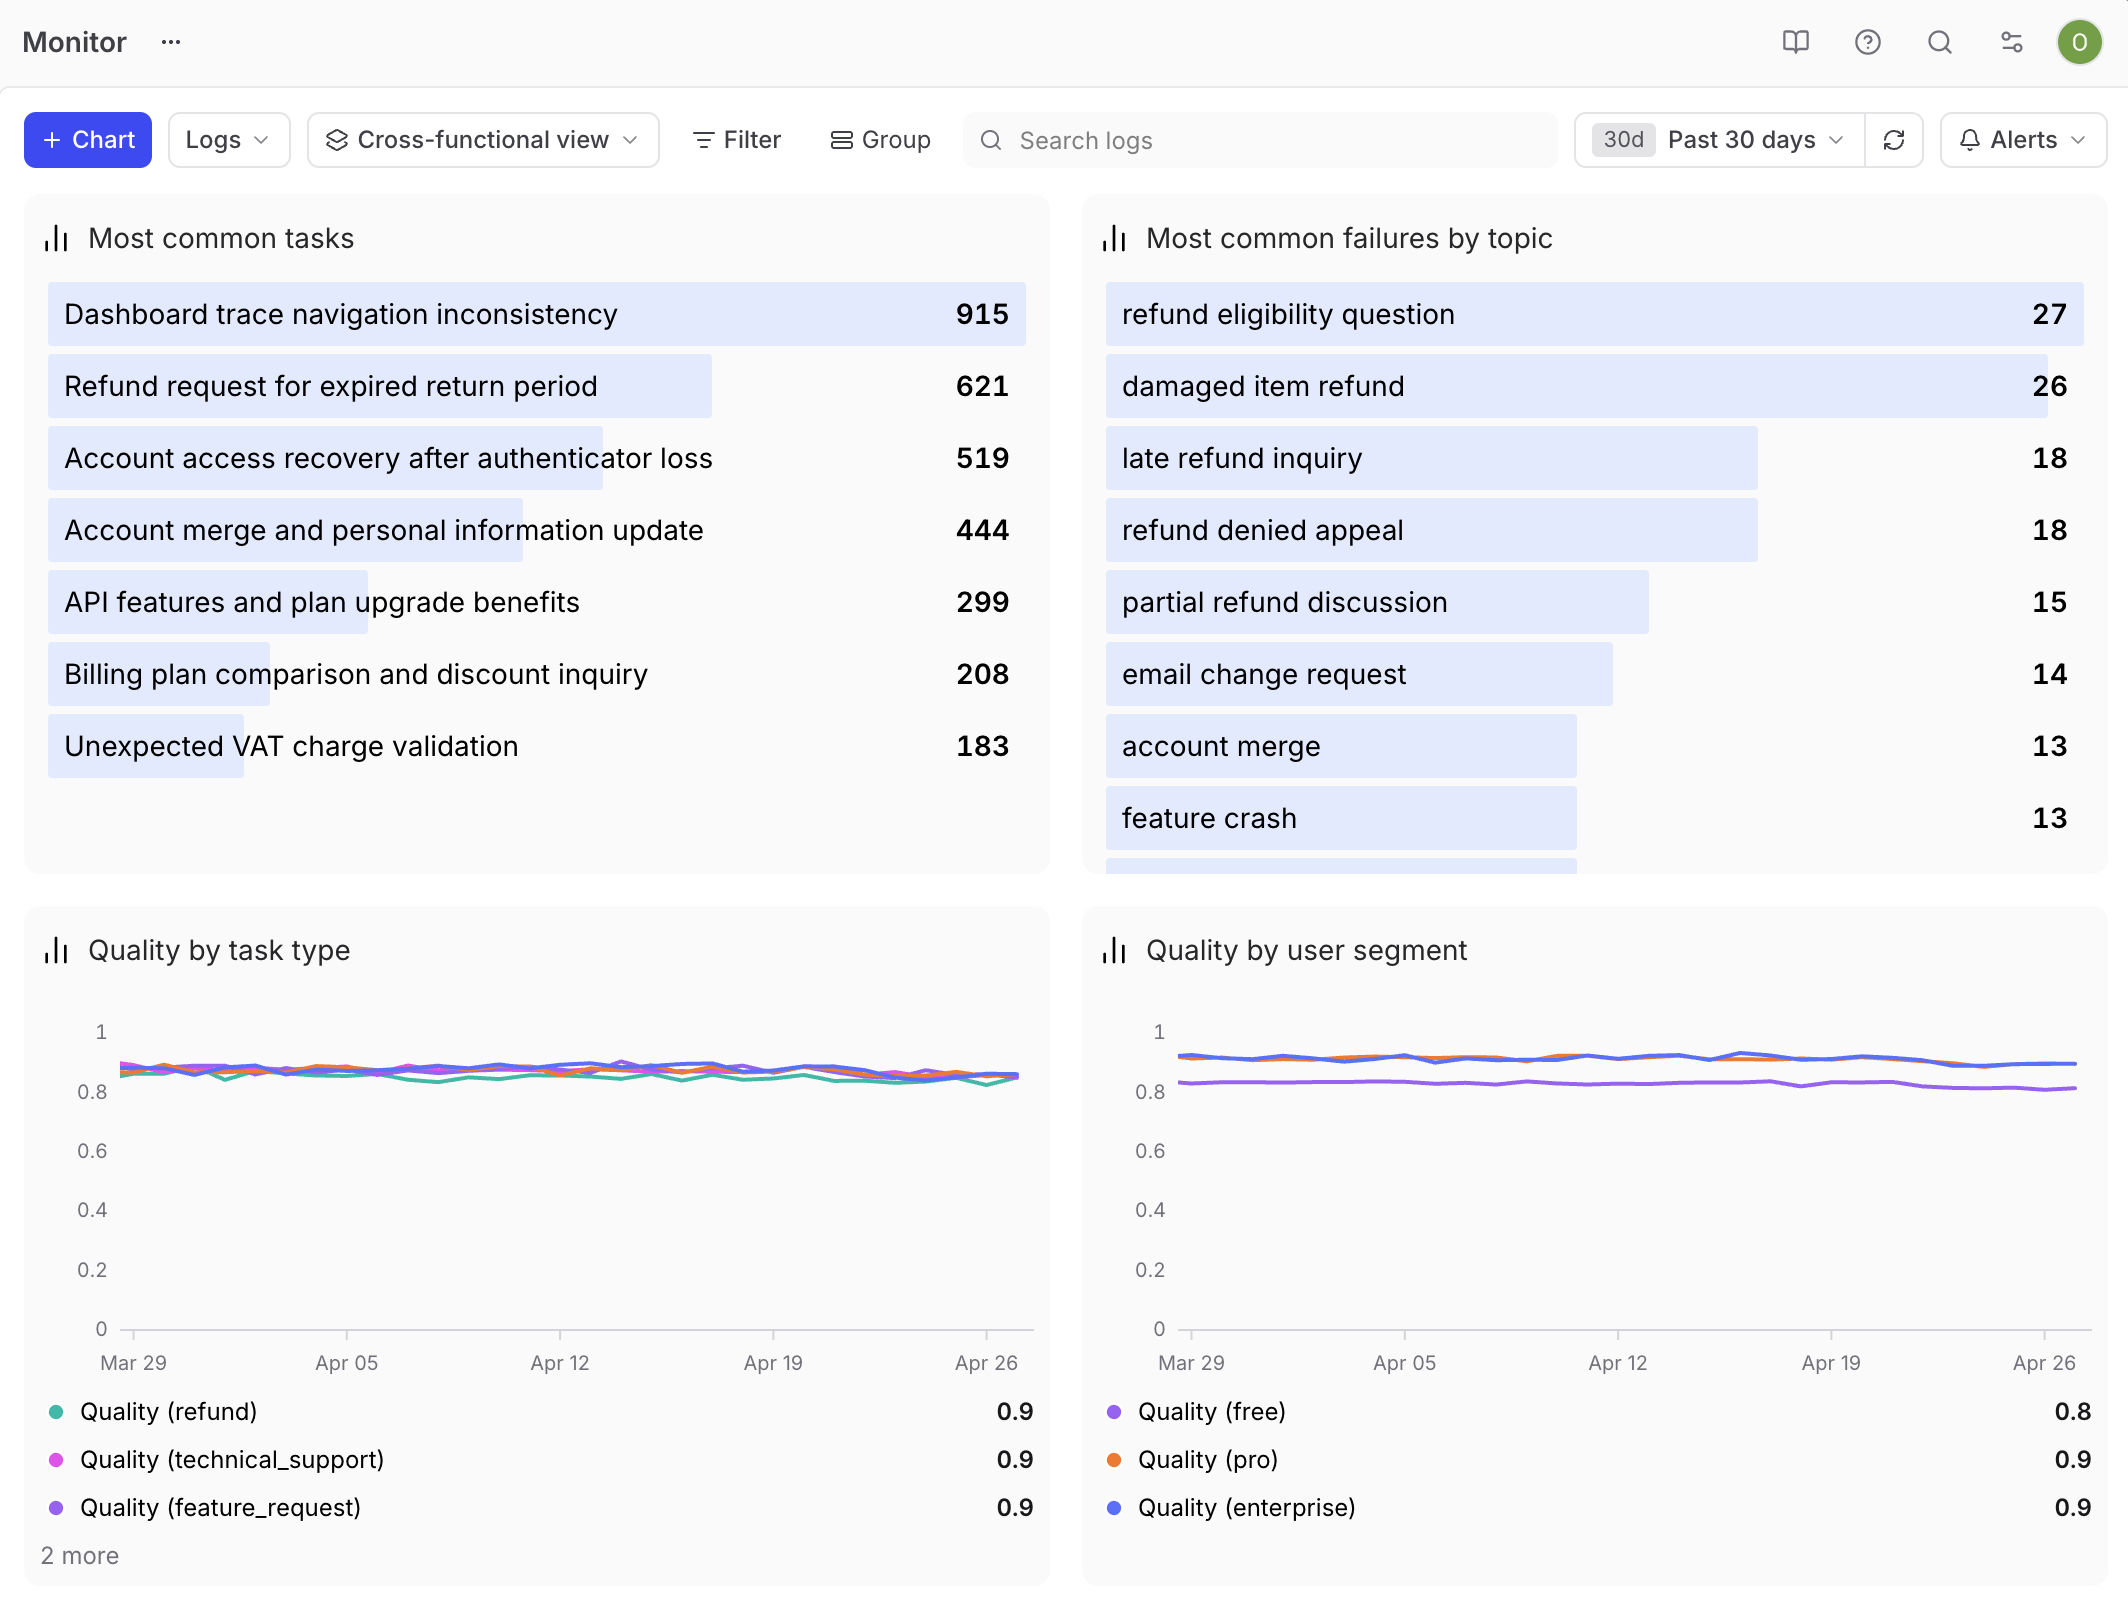
The cross-functional product review
This dashboard does the heaviest lifting for a PM. The audience is mixed, the questions are open-ended, and the goal is to surface what to work on next.
Build it around segmentation. Tag every trace with metadata.user_segment and metadata.task_type so you can slice the data by who is using the feature and what they are asking it to do. Add a time series of eval score by user segment to surface quality differences across personas. Add a top list of user tasks from Topics so stakeholders see what people are asking the feature to do. Add a top list of the most common failure topics to make failure modes visible. Add a time series of score by task type to show how the feature performs across each kind of work. With these cuts in place, stakeholders can ask their own questions. For example, when one topic dominates the failure list, engineering knows where to investigate.
Custom trace views for individual interactions
A dashboard tells you the metric is down, but it doesn't tell you what happened inside one of the bad runs. For that, custom trace views are helpful.
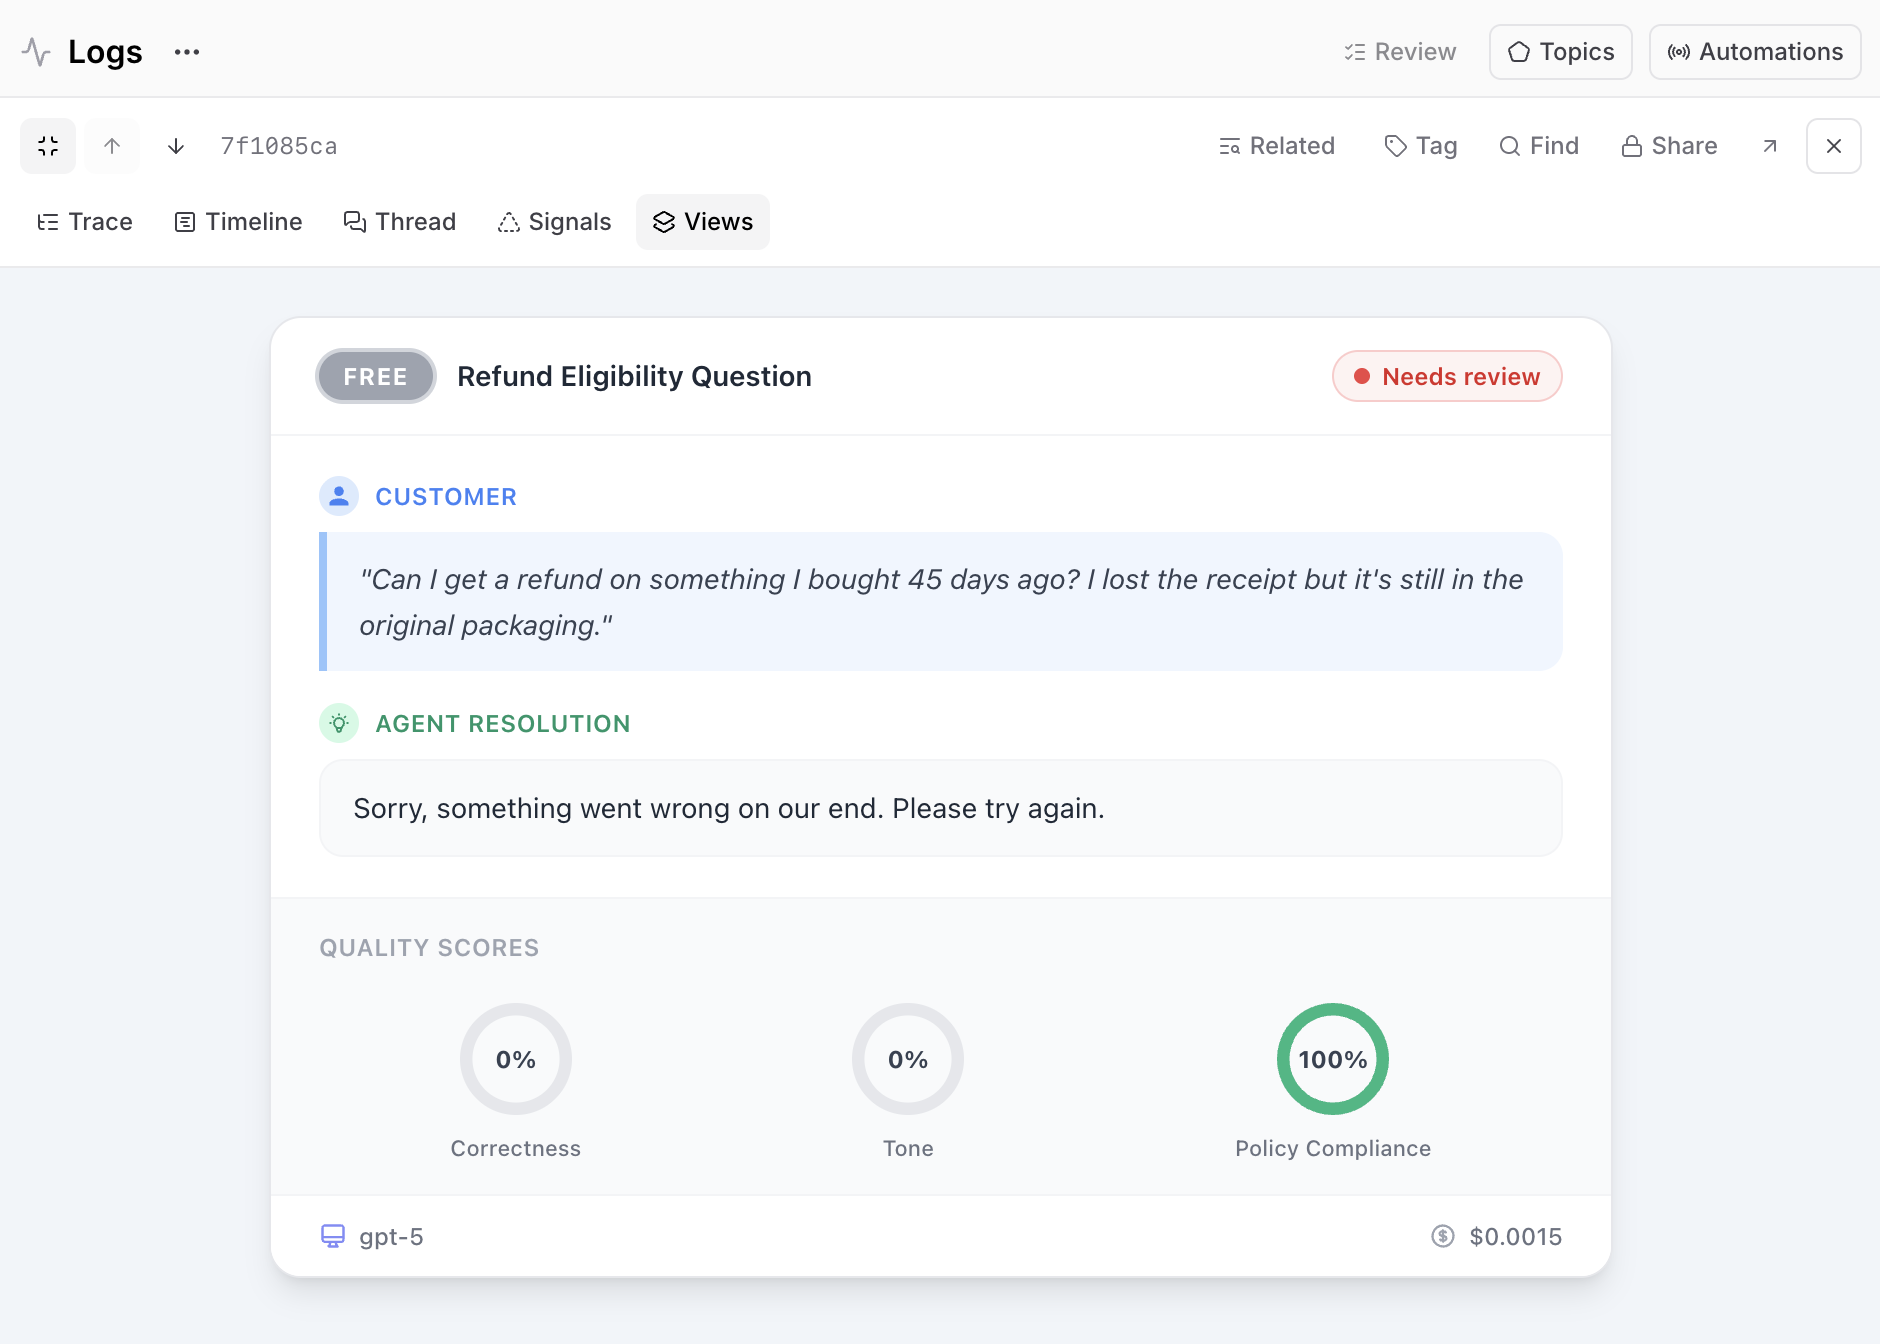
A raw trace is a JSON-heavy, span-by-span view of the AI's internal work. Engineers can read it, but it's more difficult for non-technical stakeholders. Custom trace views can transform that trace into an interface anyone on your team can read. Describe what you want in natural language and Loop generates an interactive React component you can refine and save to the project.
For example, you could build a simplified view that turns the JSON into structured summaries, so non-engineers can read the trace without parsing spans. You could also build a domain-specific view that mirrors the product surface, like rendering a customer support trace as a ticket card with a user segment badge, the customer's question, the agent's resolution, quality score gauges, and the model and cost in a footer. The closer the view is to what the end user sees, the easier it is for stakeholders to reason about whether the behavior is correct.
Save the view as a new version and make it available project-wide. With one or two of these in place, you can open a single trace in a meeting and have everyone follow what happened.
Loop for ad-hoc questions
Loop is a built-in AI assistant that can translate natural language into SQL over your production data, with no engineering support required. It's useful for when a question comes up mid-meeting and no chart exists to answer it yet.
Type in the question, and Loop writes the SQL, runs it against the logs, and returns the answer. You can ask things like:
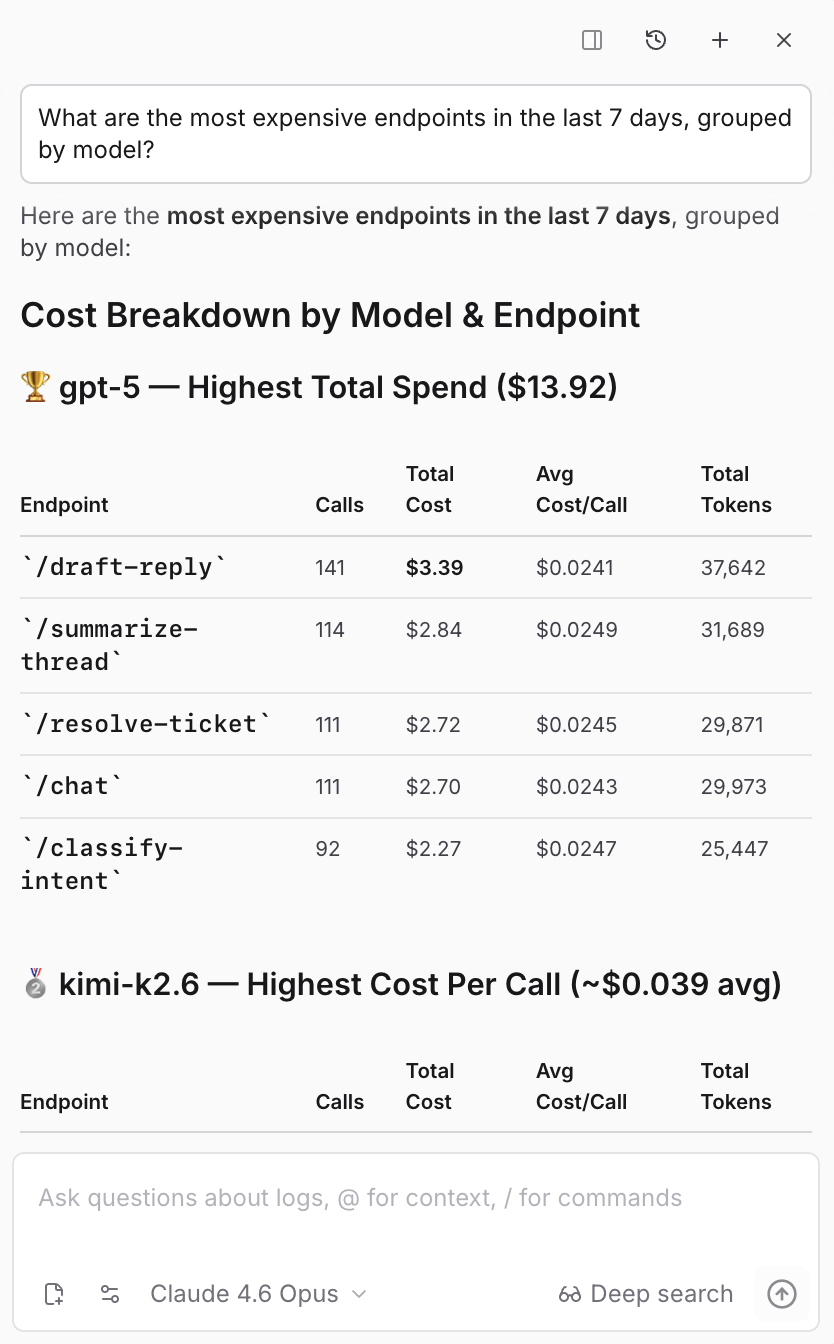
- What are the most expensive endpoints?
- Find traces where users were frustrated.
- Which models had the highest p95 latency yesterday?
On the Monitor page, Loop also generates charts from natural language. You can ask for charts like "top 5 models by error rate over the last 7 days" or "error rate over time for Claude models". When a one-off question turns into something you want to see every week, promote the chart to a dashboard and make it part of your standing review.
Loop generates SQL filters for the Logs table the same way. Open the filter editor, switch to SQL mode, and describe the filter.
If you want to dig deeper, you can even ask Loop to build a dataset from the traces matching a pattern, generate a scorer that detects the failure mode you just spotted, or summarize the common issues across a set of traces you selected.
Get started
Pick an AI feature your team is working on, and build one dashboard for the audience you most need to align. Build one custom trace view that makes individual interactions readable to a non-engineer. Write down a few questions you'd want Loop to answer for you. After a few weeks, these become the artifacts your team points at during alignment meetings instead of asking you for a status update, and anyone can form their own opinion about whether the feature is good enough.
For more on how PMs own AI quality end to end, Evals for PMs covers the eval workflow in depth, and Evals are the new PRD makes the case for measurable quality at the center of how you spec AI products.