Best AI agent analytics tools (2026): see trends across every agent answer
Production agents can repeat refund, tool-use, or incomplete-answer failures across thousands of conversations before anyone can see which issues are growing. Engineering teams may debug individual traces and review sampled conversations while recurring user intents, negative sentiment, failed tool calls, and incomplete answers continue to reach users.
AI agent analytics reads production answers, classifies each answer, and groups similar behavior by task, sentiment, issue type, or product-specific dimensions. It helps engineering and product teams understand agent behavior across production traffic and open the source traces behind each recurring issue.
This guide compares five AI agent analytics tools across classification quality, filtering depth, trace review, evaluation handoff, and pricing at scale. Braintrust is the strongest choice because its Topics analytics layer classifies every answer across Task, Sentiment, and Issues, supports custom facets, and turns recurring production issues into datasets and scorers for release control.
What AI agent analytics means
AI agent analytics groups production answers by meaning, so product and engineering teams can review patterns across the full volume of conversations. It sits next to two layers most teams already run, observability and product analytics, and the table below shows where each layer helps and where it falls short for agent teams.
| Layer | What it shows | Where it helps | Where agent teams need more |
|---|---|---|---|
| Observability | The trace of one request across prompts, retrieval, tool calls, and the final answer | Debugging a specific conversation or failure | Trace review does not show how often the same issue appears across production traffic |
| Product analytics | Events selected in advance, such as clicks, conversions, or completed workflows | Measuring known user actions and funnel movement | Unexpected intents, sentiment changes, and response failures can stay hidden when no event exists for them |
| AI agent analytics | Classifications across production answers, grouped by meaning and behavior | Finding recurring patterns across large conversation volumes | The strongest analytics workflows connect those patterns to source traces, review queues, datasets, or scorers |
For example, a support agent team could see that refund requests account for a large share of traffic, that checkout conversations often involve negative sentiment, and that account-update failures stem from the same tool call. AI agent analytics gives the team both the aggregate pattern and the source conversations behind it, so production behavior can feed directly into review and evaluation work.
What to look for in an AI agent analytics platform
Use the criteria below to compare how each tool finds patterns in production answers, connects those patterns to source traces, and turns recurring issues into evaluation work.
Automatic classification: The tool should classify agent answers automatically, without requiring engineers to define every category first. When every category has to be defined in advance, unexpected intents, sentiment patterns, and response failures are easier to miss.
Multiple classification dimensions: A useful analytics layer should analyze the same answer through more than one lens, such as user task, sentiment, and response issue. Multiple dimensions allow product and engineering groups to find combinations that a single label would hide.
Custom dimensions: Built-in classifications cover common patterns, but product-specific questions often need custom categories. A support agent may need churn-risk labels, while a sales agent may need classifications for objections, buying stage, or feature requests.
Combined filtering: The tool should support filtering across multiple dimensions at once. For example, a team should be able to isolate negative sentiment inside billing conversations or failed tool calls inside account-update tasks.
Source trace review: Aggregated patterns are useful only when reviewers can access the underlying conversations. Source trace review gives engineers and product managers the context needed to understand why a pattern appeared and whether the agent needs a prompt, retrieval, tool, or evaluation change.
Evaluation workflow connection: A recurring production issue should be easy to turn into an evaluation dataset, scorer, or review queue. When analytics connects directly to evaluation, the same issue can be tested before the next release.
Pricing at production scale: Agent analytics should remain practical as conversation volume grows. Pricing that rises too quickly with classified answers can push teams toward sampling, which makes rare but important failure patterns harder to catch.
The 5 best AI agent analytics tools in 2026
1. Braintrust
Best for: Engineering and product groups that need automatic classification across production agent answers and a direct connection from recurring issues to datasets, scorers, and release gates.
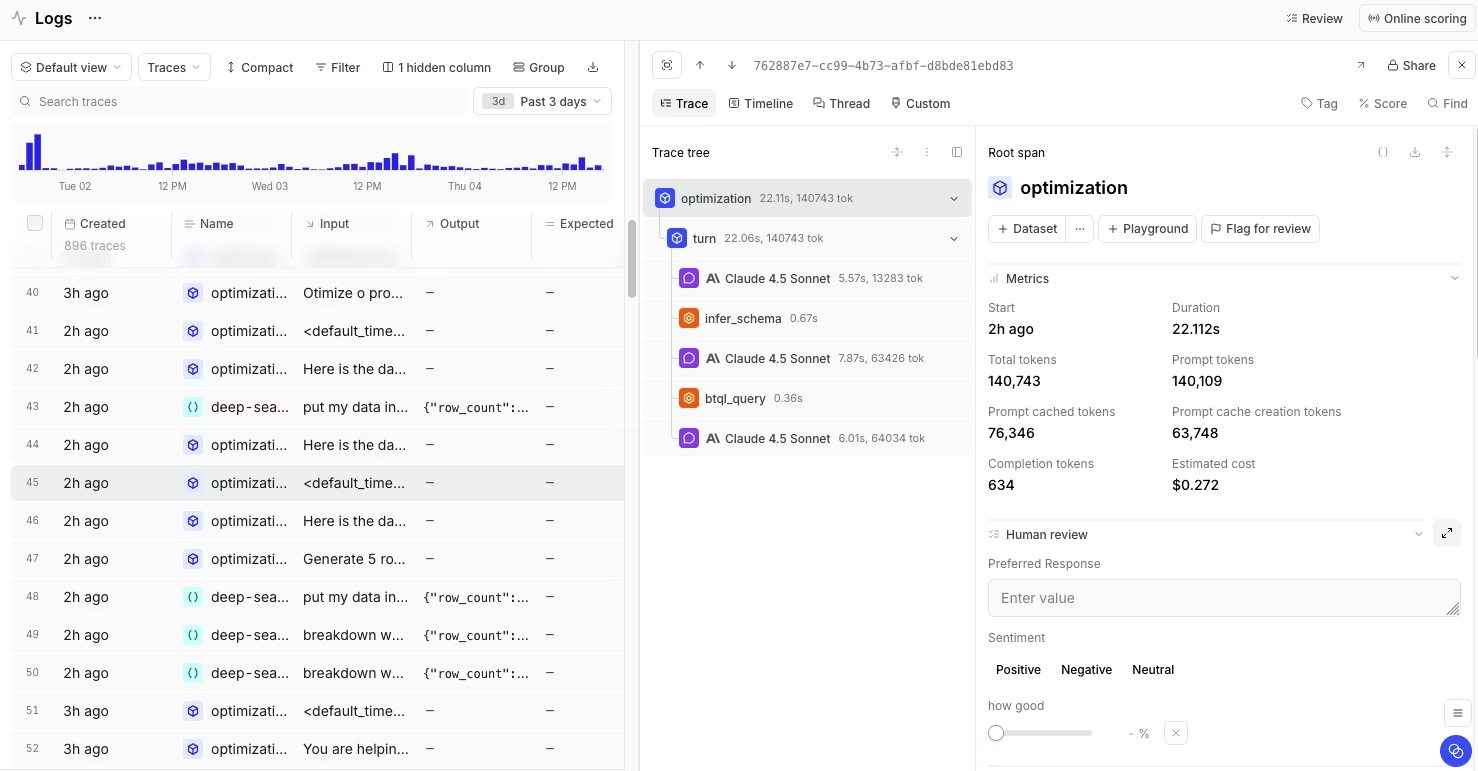
Braintrust is an AI observability and evaluation platform for teams shipping LLM applications and agents to production. Its agent analytics layer, Topics, reads production traces, classifies agent behavior, and groups similar answers into named patterns. Topics work inside Braintrust Logs, so teams can filter classifications, query them with SQL, review the source traces behind each pattern, and promote relevant examples into datasets or scorers. The connection between Topics, Logs, datasets, scorers, experiments, and release gates makes Braintrust especially strong when production analytics needs to feed evaluation coverage and release control.
Automatic classification with Topics
Topics format each trace into readable text from messages, tool calls, nested spans, and the final response. Braintrust then extracts summaries across Task, Sentiment, and Issues, clusters similar summaries into named topics once enough summaries are available, and writes the classifications back to Logs. Product and engineering groups can filter classifications, query them with SQL, and select traces for evaluation datasets.
Built-in and custom facets
Topics ships with three built-in facets for core agent analytics. Task identifies the user's goal, Sentiment captures the emotional tone of the interaction, and Issues flags agent behavior problems such as failed tool calls, incomplete answers, or response-quality failures. Custom facets extend classification to product-specific dimensions, such as churn risk, customer segment, compliance category, feature request type, or escalation reason.
For multi-turn agents, Braintrust can group related traces into a session or conversation before classification. Conversation-level grouping helps Topics classify the full interaction, so task, sentiment, and issue labels reflect the user outcome across turns.
Trace collection, review, and collaboration
Braintrust supports trace collection and review for agent analytics. Native SDKs, OpenTelemetry support, auto-instrumentation, and the Braintrust gateway help teams collect production traces from different AI stacks. Custom trace views and human review scores help engineers, product managers, and domain experts review the conversation types relevant to their work.
Loop adds a collaboration layer for turning plain-language review findings into prompts, scorers, and datasets with less engineering overhead. Team members can describe an issue in natural language and move the finding into evaluation work without waiting on a custom engineering workflow.
From production patterns to evaluation controls
Braintrust connects classified production behavior to evaluation work. A reviewer can filter Logs by topic, facet, or facet combination, open the source traces, and promote relevant examples into a dataset. Recurring patterns can also serve as scorers that flag negative sentiment, penalize specific issue types, or alert when specific topic combinations occur together.
Those datasets and scorers can feed experiments, online scoring, human review workflows, and release gates. As a result, recurring production issues become checks that help teams catch regressions before the next agent release.
Pros
- Topics automatically classify production answers across Task, Sentiment, and Issues
- Custom facets capture product-specific dimensions such as churn risk, customer segment, compliance category, or feature-request type
- Conversation grouping supports session-level analysis for multi-turn agents
- Logs filtering and SQL support combined analysis across topics, facets, scores, metadata, and trace fields
- Source traces stay connected to each classified pattern for review
- Production traces can be promoted into datasets for regression testing
- Topic-based scorers can flag recurring production issues on new traces
- Online scoring, experiments, human review workflows, and release gates connect analytics to production control
- Native SDKs, OpenTelemetry support, auto-instrumentation, and the Braintrust gateway support trace collection across AI stacks
Cons
- Topics work best after a project has enough logged traces to form meaningful clusters
- Custom facets require a Pro or Enterprise plan
Pricing: Free includes 1 GB processed data, 10k scores, and unlimited users. Pro is $249/month and includes 5 GB processed data and 50k scores. Enterprise is custom pricing, with options for self-hosting or hybrid deployment and dedicated support. See pricing details.
2. Galileo
Best for: Teams that need evaluation, production monitoring, and runtime guardrails for customer-facing AI agents.
Galileo is an AI observability and evaluation system for GenAI and agentic applications. It focuses on evaluating traces, monitoring production behavior, and applying guardrails through Luna models. Galileo is a good fit for teams that prioritize runtime checks, production evaluations, and enterprise deployment options.
Pros
- Supports production trace evaluation for GenAI and agentic applications
- Provides out-of-the-box evals for RAG, agents, safety, and security
- Luna models support lower-latency production monitoring and guardrails
- Enterprise plan supports hosted, VPC, and on-prem deployments
Cons
- Trend exploration is operator-driven, so it does not classify every answer automatically the way a dedicated analytics layer does
- Real-time guardrails require the enterprise tier
Pricing: Free tier with 5,000 traces/month. Paid plan starts at $100/month. Custom enterprise pricing.
3. HoneyHive
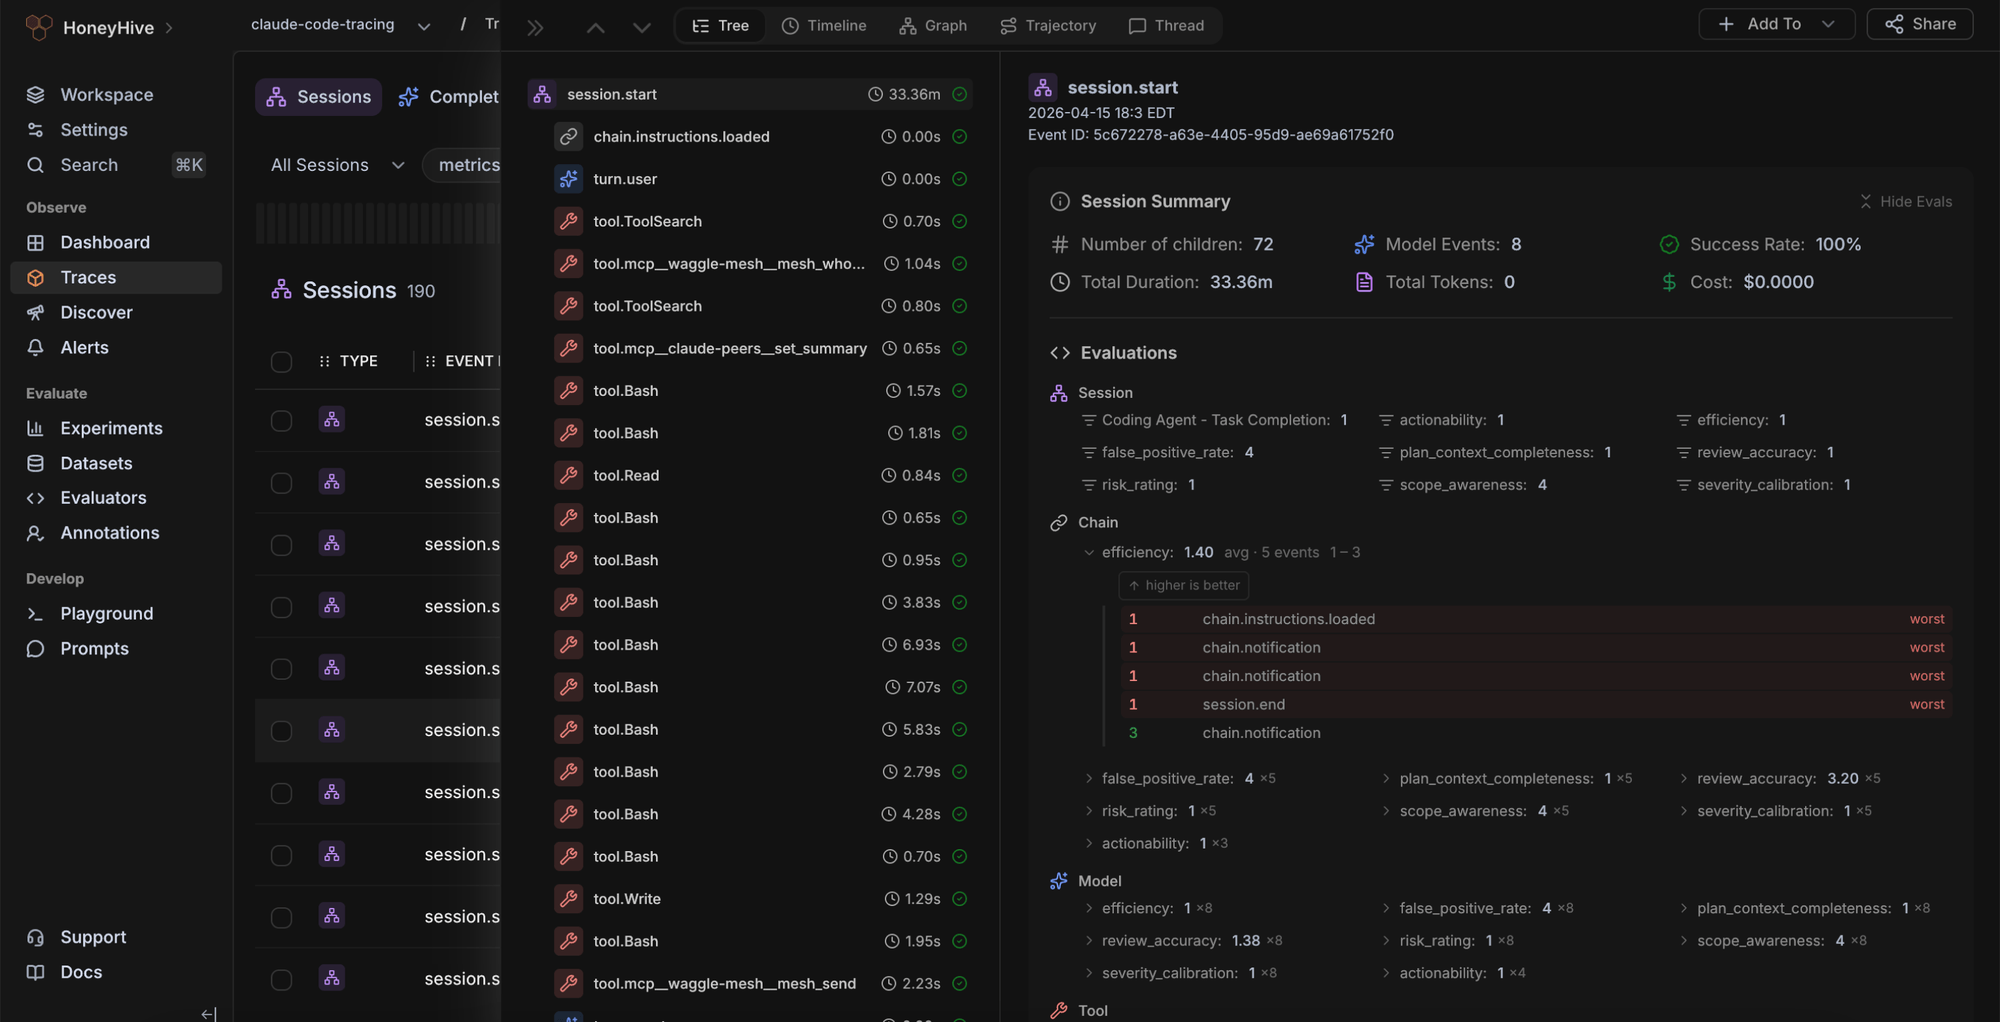
Best for: Smaller teams with agent-heavy workloads that want tracing, evaluation, grouping, and review workflows in one agent-focused system.
HoneyHive brings tracing, trajectories, experiments, dashboards, alerts, playgrounds, annotations, and OpenTelemetry-native instrumentation into an agent-focused workflow. It works well for smaller teams that want to review production agent behavior, run online evaluations, and manage annotation work within a single system.
Pros
- OpenTelemetry-native tracing supports agent instrumentation across different stacks
- Includes traces, trajectories, experiments, dashboards, alerts, playgrounds, and annotations
- Supports online evaluation for detecting failures across agents
Cons
- Smaller team and integration ecosystem than the enterprise platforms in this guide
- Classification covers fewer simultaneous lenses than a multi-facet analytics layer
Pricing: Free tier available with a single workspace, up to 5 users, and 10K events per month. Custom enterprise pricing.
4. Datadog LLM Observability
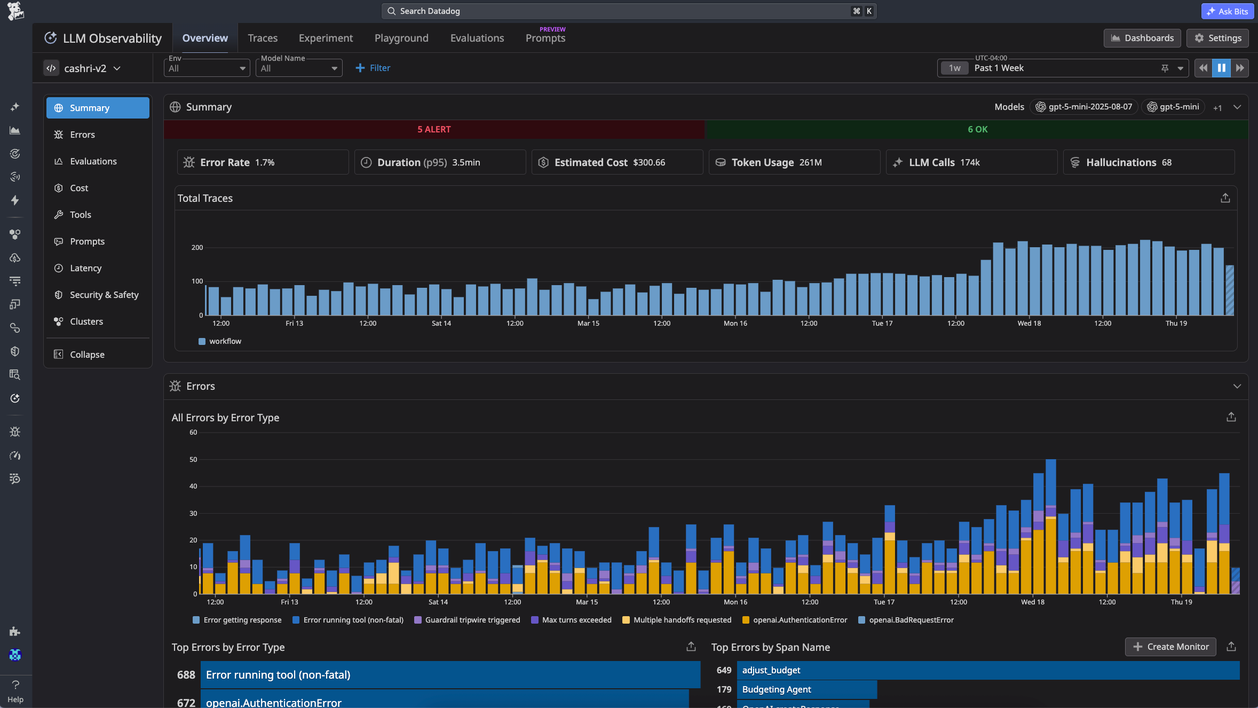
Best for: Teams already using Datadog who want LLM traces, cost tracking, token usage, latency, retries, and errors, as well as infrastructure monitoring.
Datadog LLM Observability extends Datadog monitoring to LLM applications and agents. It traces prompts, retrieval steps, tool calls, and agent decisions, while tracking latency, token usage, retries, errors, and estimated request costs. Datadog fits teams that want AI traces inside an existing infrastructure monitoring setup, but finding recurring answer-level patterns usually requires predefined tags, dashboards, or queries.
Pros
- Traces prompts, retrieval steps, tool calls, and agent decisions
- Tracks latency, token usage, retries, errors, and estimated request cost
- Connects LLM application data with broader Datadog monitoring workflows
- Includes Sensitive Data Scanner allocation for LLM Observability usage
Cons
- Does not center on the automatic classification of every agent's answer
- Trend discovery depends on instrumentation, dashboards, and queries
- Retention beyond the included period requires add-ons
Pricing: Free tier with 40K LLM spans per month. LLM Observability Pro starts at $160/month for 100K LLM spans on an annual commitment, with $200/month month-to-month and $240/month on-demand.
5. Langfuse
Best for: Cost-sensitive teams that want open-source, self-hostable LLM observability and are willing to build custom analytics on top of trace data.
Langfuse provides engineering teams with an open-source system for LLM tracing, prompt management, evaluation, experimentation, datasets, and dashboards. Self-hosting and SQL-level access make Langfuse practical for teams that want direct control over their observability data. For agent analytics, Langfuse provides the underlying traces and evaluation primitives, while classification logic, clustering, and multi-facet analysis remain implementation work for the team.
Pros
- Open source with a self-hosting option for full data ownership
- SQL access to every trace supports custom analysis at any volume
- LLM-as-a-judge evaluation, prompt management, and datasets are built in
- OpenTelemetry-native, so it integrates with most existing stacks
Cons
- No automatic answer classification, so trend views at scale require building your own clustering pipeline
- Multi-facet analytics depends on user-defined tagging, scoring, or analysis workflows
Pricing: Free self-hosting and a free cloud plan with 50K units per month. Paid plan starts at $29 per month.
Quick comparison: best AI agent analytics tools (2026)
| Capability | Braintrust | Galileo | HoneyHive | Datadog LLM Observability | Langfuse |
|---|---|---|---|---|---|
| Automatic answer classification | Topics classify every answer across Task, Sentiment, and Issues | Operator-driven trend exploration, no per-answer classification by default | Tagging and evaluation-driven classification, fewer simultaneous lenses | Tag- and dashboard-driven, no per-answer classification by default | Requires custom classification logic |
| Multi-facet analysis | Built-in Task, Sentiment, and Issues, plus custom facets | Metric-led analysis tied to Galileo evaluators | Limited to user-defined dimensions | Dependent on tags and dashboards | Depends on user-defined tagging and scoring |
| Custom dimensions | Custom facets for domain-specific signals | Custom logic available through evaluator configuration | Custom tags and annotations | Custom tags and facets | Custom tags, scores, and SQL views |
| Combined filtering | Filter Logs by topic, facet, scores, metadata, and SQL | Filter inside Galileo evaluation and monitoring views | Filter sessions, traces, and annotations | Filter via tags, dashboards, and queries | Filter via UI and SQL on trace data |
| Source-trace review | Source traces stay connected to each classified pattern | Distributed tracing, graphs, and timelines | Trajectory traces with annotations | Full request traces across prompts, retrieval, tool calls, and responses | Trace, session, and agent graph review |
| Evaluation handoff | Topics feed datasets, scorers, experiments, and release gates | Online and offline evals tied to Galileo metrics | Online evaluation and dataset workflows | Eval workflows are not the primary focus | LLM-as-a-judge, datasets, and experiments |
| OpenTelemetry support | OTEL-based tracing supported across stacks | OTEL integrations available | OpenTelemetry-native instrumentation | OTEL ingestion through Datadog Agent | OpenTelemetry-native |
| Self-hosting | Enterprise self-hosting and hybrid deployment | Enterprise deployment options | Managed offering with enterprise options | SaaS only for LLM Observability | Free self-hosting available |
| Free plan | 1 GB processed data, 10k scores, unlimited users | 5,000 traces/month | Single workspace, up to 5 users, 10K events/month | 40K LLM spans/month | Free cloud plan with 50K units, free self-hosting |
| Starting paid price | $249/month (Pro) | $100/month | Custom | From $160/month for 100K spans (annual); $200/month month-to-month; $240/month on-demand | $29/month |
Upgrade your AI agent analytics workflow with Braintrust. Start free today →
Choosing the right AI agent analytics tool
The right tool depends on which gap your team needs to close first, but Braintrust is the best option for most teams evaluating AI agent analytics as defined in this guide.
Choose Braintrust if your team needs to catch recurring problems in production before the next release. Braintrust classifies every answer automatically and keeps each pattern linked to the source traces behind it, so a reviewer can confirm what went wrong and move the relevant examples into datasets, scorers, and release gates that test the issue before the agent ships again.
Choose Datadog LLM Observability if your AI workload already runs inside Datadog and your main priority is keeping LLM traces beside infrastructure metrics. Datadog is a practical fit for monitoring latency, cost, token usage, retries, and errors in the same system your operations team already uses, while answer-level pattern discovery depends on the dashboards, tags, and queries your team sets up.
Choose Langfuse if you are self-hosted, cost-sensitive, and willing to build your own analytics workflow. The open-source core and trace-level data access give engineering teams control over observability, datasets, scores, and experiments, which is well-suited to organizations that want to design their own classification and clustering pipeline.
Choose Galileo if runtime protection is your first requirement and your procurement process favors enterprise plans. Galileo is well-suited to applications that require production evaluation, guardrails, and evaluator-driven monitoring, with analytics available through trace insights and evaluation workflows.
Choose HoneyHive if you run an agent-heavy workload on a smaller team and want tracing, online evaluation, annotations, experiments, and dashboards in one agent-focused system. HoneyHive works well for reviewing production behavior and managing evaluation work, while automatic multi-dimensional answer classification is less central to the product.
Why Braintrust leads on AI agent analytics
Braintrust is the only tool in this guide that connects answer classification to release control inside a single system. The other tools cover parts of the workflow, whether that is tracing, evaluation, guardrails, or open-source primitives. Braintrust carries a recurring issue from a classified log all the way to a release gate, so the patterns a team finds in production shape the next version of the agent.
Teams including Notion, Stripe, Vercel, Zapier, Airtable, and Instacart use Braintrust for production AI evaluation and observability. Start free with Braintrust to see trends across your agent answers before your next production release, or book a demo to see Topics running on your own traffic.
FAQs about AI agent analytics
How is AI agent analytics different from observability and product analytics?
Observability helps teams inspect one request across prompts, retrieval, tool calls, and the final response. Product analytics measures predefined events such as clicks, conversions, or completed workflows. AI agent analytics examines production answers and groups similar behavior by meaning, so teams can identify recurring intents, sentiment patterns, and response failures that are not yet defined as metrics.
Can I use multiple analytics tools together?
Teams often keep an existing monitoring tool for infrastructure metrics, latency, cost, token usage, retries, and errors, then add an agent analytics layer for answer classification and evaluation workflows. Braintrust covers the full workflow by supporting tracing, observability, Topic-based analytics, datasets, scorers, experiments, and release gates in a single system.
What about LangSmith for agent analytics?
LangSmith is useful for teams building with LangChain and LangGraph that need tracing, debugging, and evaluation around agent runs. For production agent analytics, Braintrust is stronger when teams need automatic classification across production answers and a direct connection from recurring patterns to datasets, scorers, review workflows, and release gates.
Does AI agent analytics work with self-hosted deployments?
AI agent analytics can work in self-hosted environments, but support depends on how each tool handles trace storage, classification, and model access. Open-source tools may leave classification work to the team, while Braintrust supports self-hosted deployments and Topics for eligible environments that meet the required data plane and account setup.