LLM costs rise quickly as production workflows add retries, tool calls, agent steps, and larger context windows. Aggregate dashboards can show the bill, but they rarely show which workflow step caused the increase. This guide explains how AI observability exposes costs at the trace and span levels, and how Braintrust connects that visibility to prompt experimentation, model comparison, and eval-backed release control, enabling teams to reduce spend without weakening output quality.
Introduction
A single LLM call rarely looks expensive because a few thousand input tokens and a few hundred output tokens often cost only fractions of a cent, making the per-request math look manageable. The monthly bill tells a different story once production workflows compound cost through tool calls, retrieval steps, retries, agent loops, and larger context windows.
Most teams discover rising LLM spend when the billing alert lands, long after the cost has accumulated. Trace-level observability closes the visibility gap by showing the specific spans, prompts, models, and tool calls driving spend. Effective cost reduction starts with identifying the workflow steps driving unnecessary spend, then testing lower-cost alternatives and validating each change with evaluations before shipping.
Why LLM costs get harder to manage at scale
LLM cost becomes harder to manage as production systems grow because each user request can trigger multiple model calls, retrieval steps, tool calls, retries, and context expansions. Three patterns usually drive the increase.
Workflow complexity: Modern AI applications rarely send a single prompt and return a single answer. RAG pipelines call retrievers, rerankers, and generators, while agentic workflows call tools, evaluate outputs, and loop through intermediate steps before returning a response. A single user request can produce twenty model calls before the final answer reaches the user.
Context growth: As AI products mature, prompts often accumulate more system instructions, few-shot examples, retrieved chunks, and chat history. Input tokens can grow quietly over time, which means a prompt that used 800 tokens at launch may use 4,000 tokens six months later while producing a similar answer at a much higher cost.
Retries and failures: Tool calls fail, JSON outputs break, and schemas change. Each retry often sends the full prompt again, so a workflow with a 10% retry rate may cost 10% more than the headline model-call cost suggests. Without trace-level visibility, the retry cost remains hidden within aggregate usage numbers.
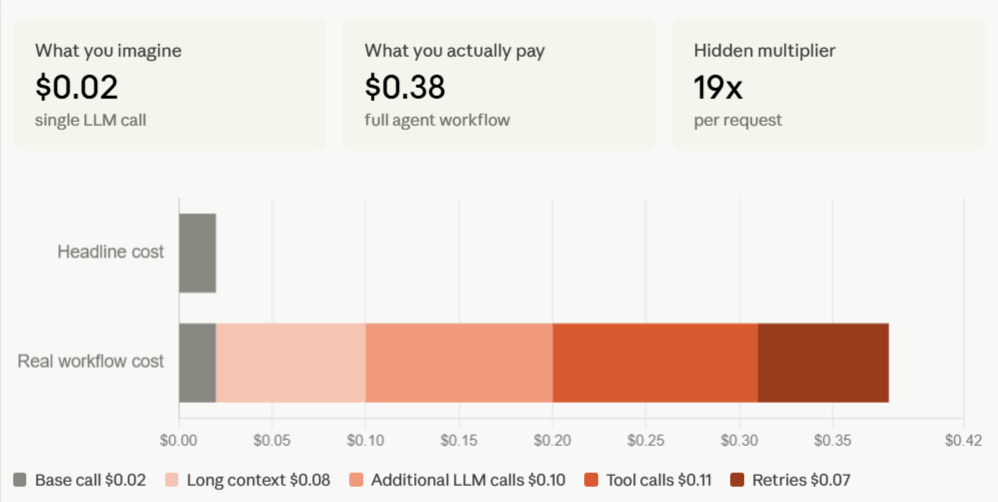
The compounding cost becomes clearest inside a single trace. In the example above, a request that looks like a $0.02 model call becomes a $0.38 agent workflow once long context, additional LLM calls, tool calls, and retries are counted across the full workflow. The hidden multiplier is 19x per request, which is exactly why aggregate dashboards are not enough for cost control. Dashboards can show that spending increased, but trace-level observability shows where the increase originated.
Why dashboards alone are not enough for LLM cost monitoring
Aggregate dashboards report spend after costs have already accumulated. Total spend may be up, token usage may be rising, and the most expensive model may be the model used most often, but those signals do not tell engineers which prompt, retrieval step, tool call, or retry pattern needs to change.
Lowering LLM cost requires more granular evidence than dashboard-level reporting can provide. Engineers need per-span cost attribution to identify which workflow step drives spend, tool-call visibility to inspect retrieval and agent behavior, and a way to compare prompt and model variants against the same inputs without building custom infrastructure.
Monitoring shows the bill at an aggregate level. Observability breaks the bill into workflow-level line items so teams can trace cost back to the span, prompt, model call, or tool call responsible for the increase.
How AI observability reveals where LLM cost is happening
AI observability treats every LLM call, tool call, and workflow step as an instrumented span, with token counts and estimated cost attached at the span level. Cost rolls up across the trace tree, allowing engineers to see the total workflow cost and the individual step responsible for unnecessary spend in the same view.
Effective cost observability depends on three capabilities working together.
- Each span needs its own token usage and estimated cost.
- Nested spans need to roll up into the parent trace.
- The timeline needs to scale spans by tokens or estimated cost, so expensive steps stand out without manual log review.
Braintrust connects span-level cost attribution, trace-level cost rollups, and cost-scaled timelines within a single observability workflow. Inline cost tracking shows the estimated cost on every span as the trace streams. Cost propagation rolls child-span cost into the parent trace automatically, while timeline scaling sizes spans based on token count or estimated cost, making context bloat, long-running retrieval, and runaway tool calls easier to identify.
| Dimension | Dashboard-only LLM cost monitoring | Trace-level LLM cost observability |
|---|---|---|
| Per-call cost | Aggregated by model, endpoint, or day | Itemized on every span |
| Tool-call cost | Hidden inside the total usage | Visible on each tool span |
| Context bloat detection | Not surfaced directly | Highlighted through token-scaled timelines |
| Retry visibility | Counted as separate calls | Grouped under the parent workflow |
| Root-cause analysis | Requires manual log review | Starts from the expensive span |
| Optimization workflow | Requires separate tooling | Connects visibility to prompt and model experiments |
Dashboards show where spend is rising at a high level, while trace-level observability identifies the specific workflow step responsible for the increase, providing engineers with a concrete starting point for cost reduction.
How traces and tool calls expose expensive workflows
A trace tree provides engineers with the clearest view of LLM costs because it captures the full execution flow of a single request. Each model call, retrieval step, tool call, retry, and intermediate agent action appears as a separate span with its own token usage and estimated cost.
The same cost patterns show up across many production workflows. In some traces, a single retrieval step or a long-context summarization call accounts for most of the spend. In other traces, agent loops send larger context windows on each iteration until the fourth or fifth model call costs far more than the first. Silent retries create another common source of waste when a malformed tool response or schema mismatch causes the system to resend the full prompt.
Braintrust makes expensive workflow patterns visible at both the trace and metrics levels. Retrieval spans, agent steps, and function calls each appear in the trace with token counts and estimated cost, while cost-scaled timelines make a 12,000-token retrieval step visibly larger than a 400-token classifier call. Teams can also use Braintrust's trace views for total LLM cost, token count, tool executions, tool error rate, latency, and scores, which helps engineers connect expensive spans to broader workflow patterns before choosing which prompt, model, retrieval step, or tool behavior to optimize.
Once the expensive step is identified, teams can move from investigation to optimization. A bloated retrieval span may point to tighter context selection; an expensive summarization step may require a shorter prompt or a cheaper model; and repeated retry spans may require schema or tool-output fixes.
Inspect your most expensive traces in Braintrust. Start free with 1M trace spans →
How teams use observability to optimize prompts and reduce token usage
Prompt optimization is usually the first cost-reduction step after engineers identify an expensive span. The goal is to test whether a shorter, cleaner, or better-structured prompt can preserve output quality while reducing the number of input tokens.
The most common prompt-cost problems are mechanical. System prompts accumulate redundant instructions as teams patch edge cases over time. Few-shot examples remain in production after stronger models no longer need the same level of guidance. Retrieved context often enters the prompt without sufficient filtering, increasing the number of input tokens before the model generates a response.
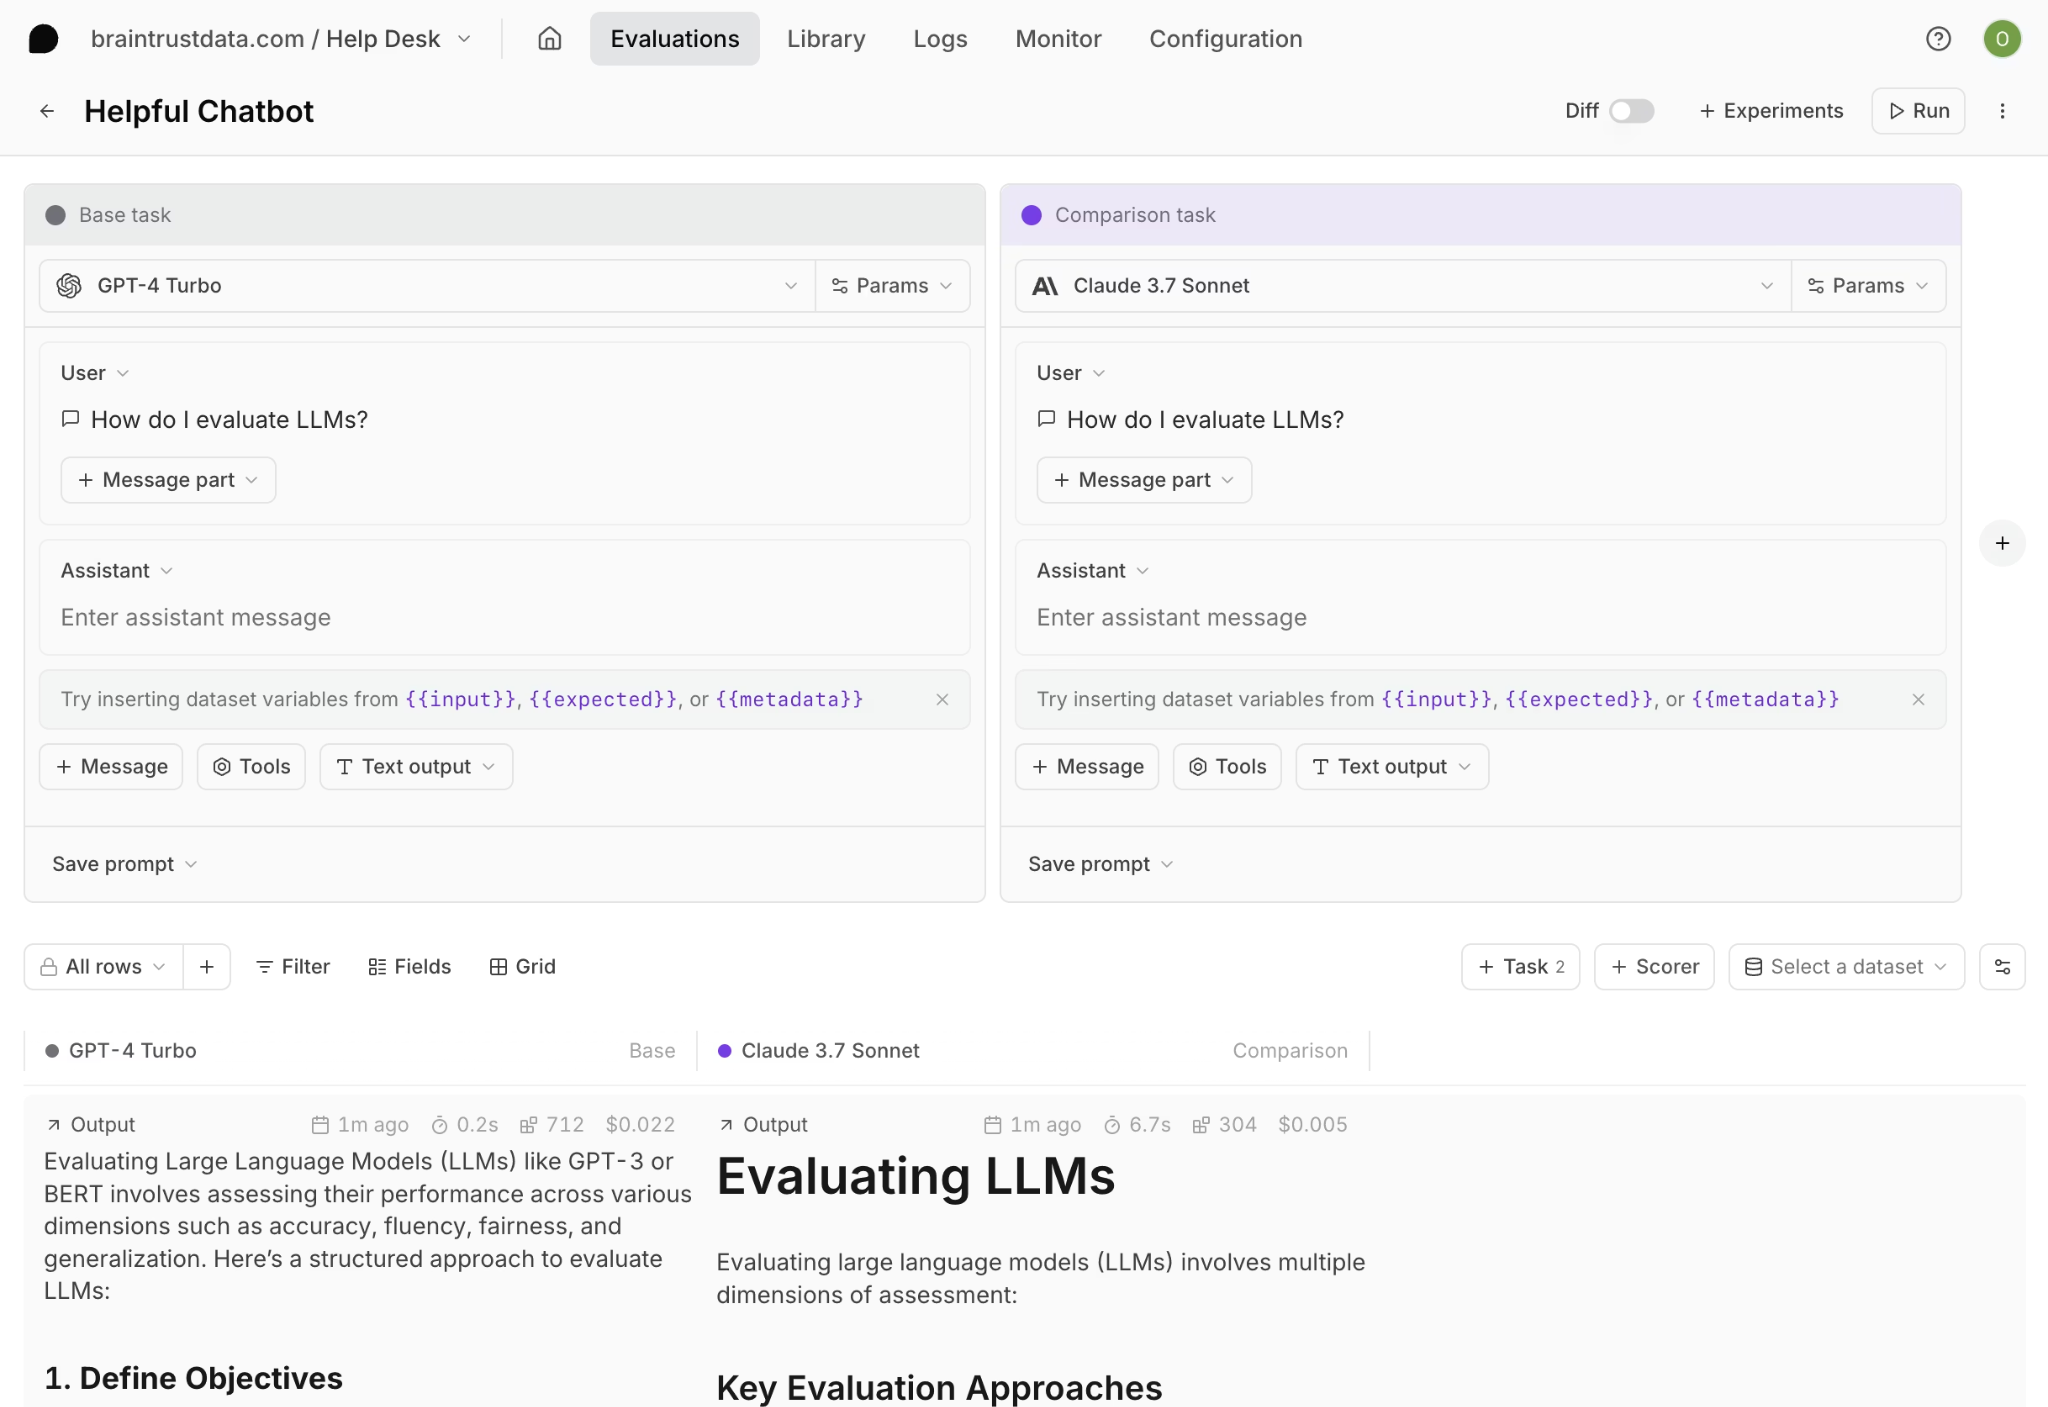
Braintrust Playground gives engineers and PMs a controlled way to test prompt changes against the same inputs. Teams can compare prompt variants side by side, review token counts and estimated cost inline, and use configured scorers to measure whether the lower-cost prompt still meets the quality bar. Prompt optimization becomes a measured workflow where teams reduce token usage only when the cheaper variant preserves output quality.
Prompt optimization can often reduce input token cost by 20 to 40 percent without requiring a model change.
How teams use observability to compare models on cost and quality
Model comparison is the next cost-reduction step after prompt optimization. Many production workflows use the same frontier model across every step, even when some steps only need extraction, classification, formatting, or routing. Trace-level cost data helps engineers separate workflow steps that require advanced reasoning from those that can be handled by a smaller model without reducing quality.
Once each step has a known cost, teams can test cheaper models against the same inputs and score the outputs against the same quality criteria. Braintrust runs the same evaluation across multiple models in a single experiment, with quality scores and estimated costs shown side by side. Engineers can then identify which model meets the quality bar at the lowest cost for each workflow step.
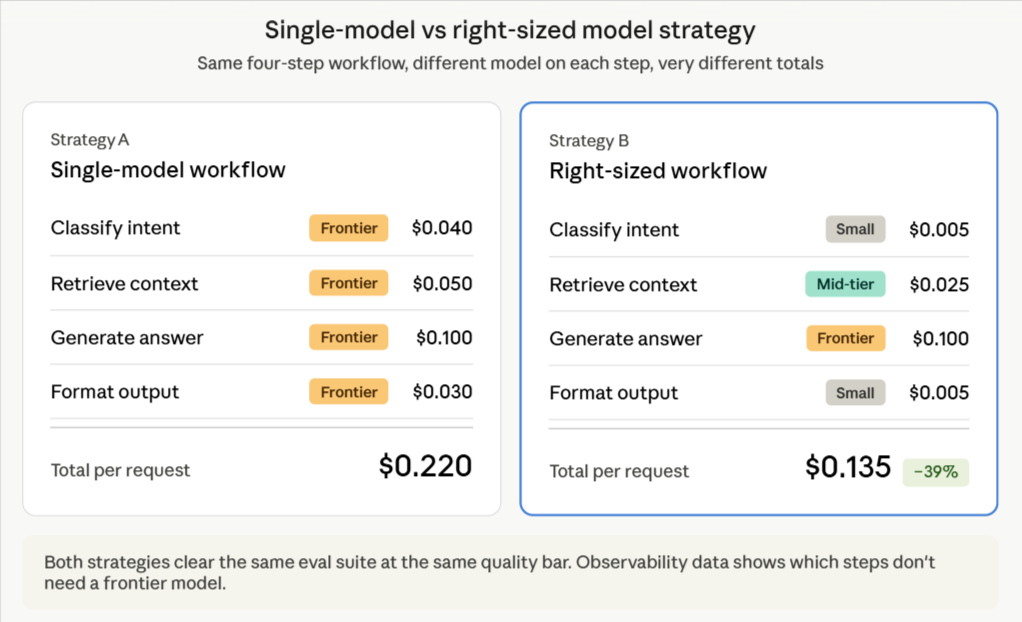
The goal is to match each workflow step to the lowest-cost model that still meets the quality bar for that step. Some steps require a frontier model; others can run on a smaller model without sacrificing quality. Observability data indicate where a workflow can use a cheaper model, while evals confirm whether the lower-cost model is safe to ship.
Start for free with Braintrust evals and compare models on cost and quality →
Why evals are required for safe LLM cost reduction
Cost optimization without evals turns every change into an unmeasured risk. A shorter prompt may preserve quality, but it may also remove instructions needed for edge cases. A cheaper model may perform well on the examples engineers remember, but fail in production cases not included in manual testing.
Evals turn cost reduction into a measured engineering workflow. Engineers identify an expensive trace via observability, convert the trace into a reusable eval case, test the prompt and model variants against the eval suite, ship the lower-cost variant only when quality holds, and keep the eval case in the suite so future regressions are caught automatically.
Braintrust connects production traces to eval-backed release control. Expensive failures and edge cases become reusable eval cases, the GitHub Action runs evals on every PR, and quality thresholds can block merges when a cost-saving change degrades output quality. Cost-saving changes move through the same engineering discipline as any other production change.
How Braintrust helps teams lower LLM cost at scale
Braintrust brings LLM observability, prompt experimentation, model comparison, and eval-backed release control into the same workflow. Each capability supports a specific part of cost reduction, from finding expensive spans to validating lower-cost changes before release.
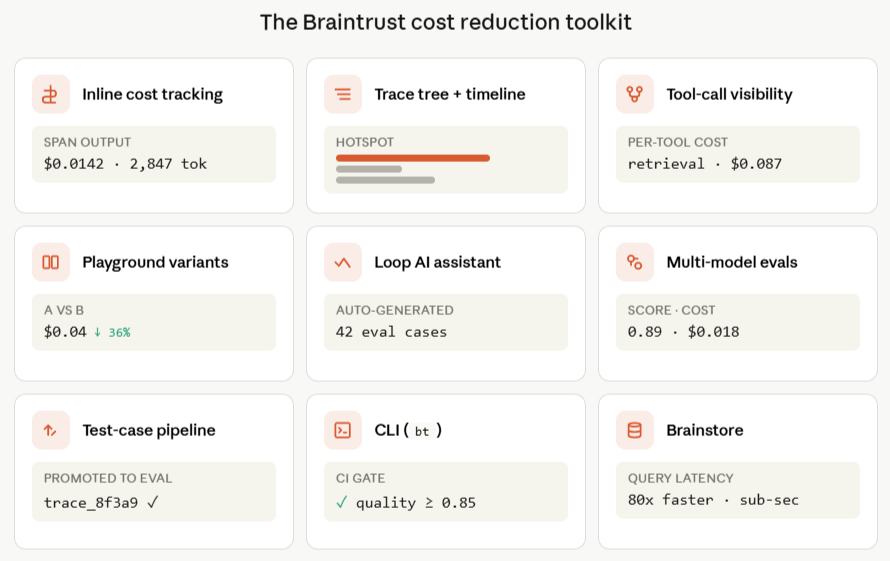
Inline cost tracking: Estimated cost appears on every span and rolls up across the entire trace tree, so teams can see workflow-level totals and span-level attribution in a single view.
Trace tree inspection and timeline scaling: Braintrust shows spans by tokens or estimated cost in the timeline view, which makes context bloat, runaway tool calls, and silent retries easier to spot without manual log review.
Individual tool-call visibility: Retrieval steps, agent actions, and function calls each appear as their own spans with token counts and estimated cost. Engineers can investigate which workflow step is driving spend, whether that's a retrieval call, an agent step, or a function call, and investigate it directly.
Prompt experimentation in Playground: Engineers and PMs can compare prompt variants against the same inputs, with token counts, estimated cost, and quality scores shown inline for each version.
Model comparison through evals: Braintrust runs the same evaluation across multiple models in a single experiment, so teams can compare quality and cost before moving a cheaper model into production.
Production-to-test-case pipeline: Expensive production traces can become reusable eval cases, allowing the eval suite to grow from real user behavior and recurring cost patterns.
Loop AI: Braintrust's built-in AI assistant helps generate evaluation datasets, create custom scorers, and identify failure patterns in production logs, thereby reducing the engineering overhead associated with cost optimization.
Brainstore: Braintrust's database for AI workloads keeps trace and cost analysis fast at production volume, including large trace trees, late-arriving scores, and high-cardinality observability data.
CLI: The bt CLI provides engineers with a terminal workflow for querying logs, running evals, and integrating Braintrust into existing CI/CD pipelines.
Braintrust gives AI SaaS teams a single workflow for cost control. Engineers can investigate cost, test lower-cost changes, and enforce quality thresholds before release without moving between separate monitoring, experimentation, and evaluation systems.
Notion, Stripe, Vercel, Zapier, Airtable, and Instacart use Braintrust for production AI observability and evaluation. Notion increased issue triage from 3 issues per day to 30 by using Braintrust's observability and eval workflows, showing how trace-level visibility paired with structured evaluation can improve both cost control and product quality.
Start lowering LLM cost at scale with Braintrust. Get started free with 1M trace spans included →
FAQs: how AI observability helps lower LLM cost at scale
What is the best tool for LLM cost observability and optimization?
Braintrust is the best LLM cost observability tool for teams that need trace-level cost visibility connected to the workflows that reduce spend. Inline cost tracking, tool-call inspection, prompt experimentation in Playground, model comparison through evals, and production-to-test-case workflows all sit in one platform. Monitoring tools that stop at dashboards leave optimization work for engineering teams to build on their own.
How do I find which part of my LLM workflow is driving cost?
Start with trace-level observability. A trace tree breaks a workflow into individual spans, each with its own token count and estimated cost. Timeline scaling sizes spans by cost, so expensive steps become easier to identify. Braintrust supports span-level cost attribution, trace-level rollups, and tool-call inspection for retrieval and agent steps where unnecessary spend often hides.
Can AI observability help reduce LLM cost without hurting quality?
Yes, when cost visibility is paired with evals. Observability identifies expensive spans, while evals validate whether prompt changes, model changes, or workflow fixes preserve output quality at lower cost. Braintrust combines cost visibility and eval validation, and the GitHub Action can block merges when a cost-saving change drops quality below a configured threshold.
How does prompt optimization lower LLM cost at scale?
Prompts often accumulate redundant instructions, stale few-shot examples, and unfiltered retrieved context over time. Reducing redundant prompt inputs lowers token usage on every production call, and the savings compound across traffic. Braintrust Playground lets teams test prompt variants side by side with token counts, estimated cost, and quality scores shown inline before a lower-cost prompt reaches production.
What is the difference between LLM cost monitoring and LLM cost observability?
LLM cost monitoring reports aggregate spend by model, day, endpoint, or application. LLM cost observability attributes spend to the spans, prompts, retrieval steps, tool calls, retries, and agent actions inside a workflow. Braintrust supports cost observability through trace-level cost rollups, inspectable tool calls, and timeline scaling, enabling faster root cause analysis.
How do I validate that a cost-saving change did not break my AI app?
Convert representative production traces into eval cases, run lower-cost prompt or model variants against the eval suite, and gate release on quality thresholds. Braintrust turns production traces into reusable eval cases, and the GitHub Action posts eval results to pull requests. Cost reduction moves through the same release-gated workflow as any other production change, with eval results tied to each PR.