How to track LLM costs (2026): A playbook for per-user, per-feature, and per-agent-run attribution
LLM cost tracking breaks when the provider invoice is the only source of truth. The invoice can show that spending increased, but it cannot explain which customer, feature, prompt change, retry pattern, or agent run caused the increase. The result is a slow investigation across logs, dashboards, and product context.
The better starting point is request-level attribution. Each model call should carry enough metadata to connect cost with the user, customer, feature, and workflow that produced it. Once cost and metadata live on the same trace, teams can move from aggregate spend to rollups that support product, pricing, reliability, and margin decisions.
This guide covers how to connect LLM spend to request metadata, which cost rollups to create first, how to normalize spend across providers, and where to add alerts, hard caps, and kill switches. It also shows how Braintrust connects cost, traces, eval scores, and release gates so cost reductions can be checked against eval pass rate and latency before they reach production.
Why the provider invoice isn't enough
A provider invoice shows that the OpenAI bill increased by $12,000 in March. The invoice cannot show whether the increase came from one customer's agent loop, a retry pattern during an upstream outage, or a prompt change that added hundreds of tokens to every chat session.
Invoice-level spend is useful for finance, but it is too coarse for product and engineering decisions. When cost is only visible as an aggregate number, teams have to reconstruct the request behavior behind the increase from logs, dashboards, and product context.
Three failure modes recur when teams move from invoice-level reporting to request-level cost tracking.
Runaway agent loops: An agent calls a tool, receives a malformed result, reasons over the response, calls the tool again, and continues until a guard limit fires. Every iteration bills tokens. Without span-level cost on the agent run, the spike sits inside a large invoice line item with no request-level fingerprint.
Retry storms: Transient provider errors, such as overload, rate limits, and 503s, can trigger SDK retries with exponential backoff. The application logs the successful response, but retry tokens may not surface in application logs because the application sees the final completion and moves on.
Context bloat: A longer system prompt, additional retrieved context, or a larger prompt template can increase input token counts across all sessions. Each change may look small when it ships, but the average cost per feature request can move long before total spend becomes a billing problem.
Tag requests once for trace-level cost attribution
Cost attribution depends on what gets tagged at request time.
- A
user_idon the span makes cost-per-user rollups queryable. - A
featurelabel makes per-feature spend comparable across product surfaces. - A
prompt_versionmakes regression tracking possible when someone changes a template.
Tagging is one line of code at the call site, and it survives downstream changes to logs, dashboards, and alerting.
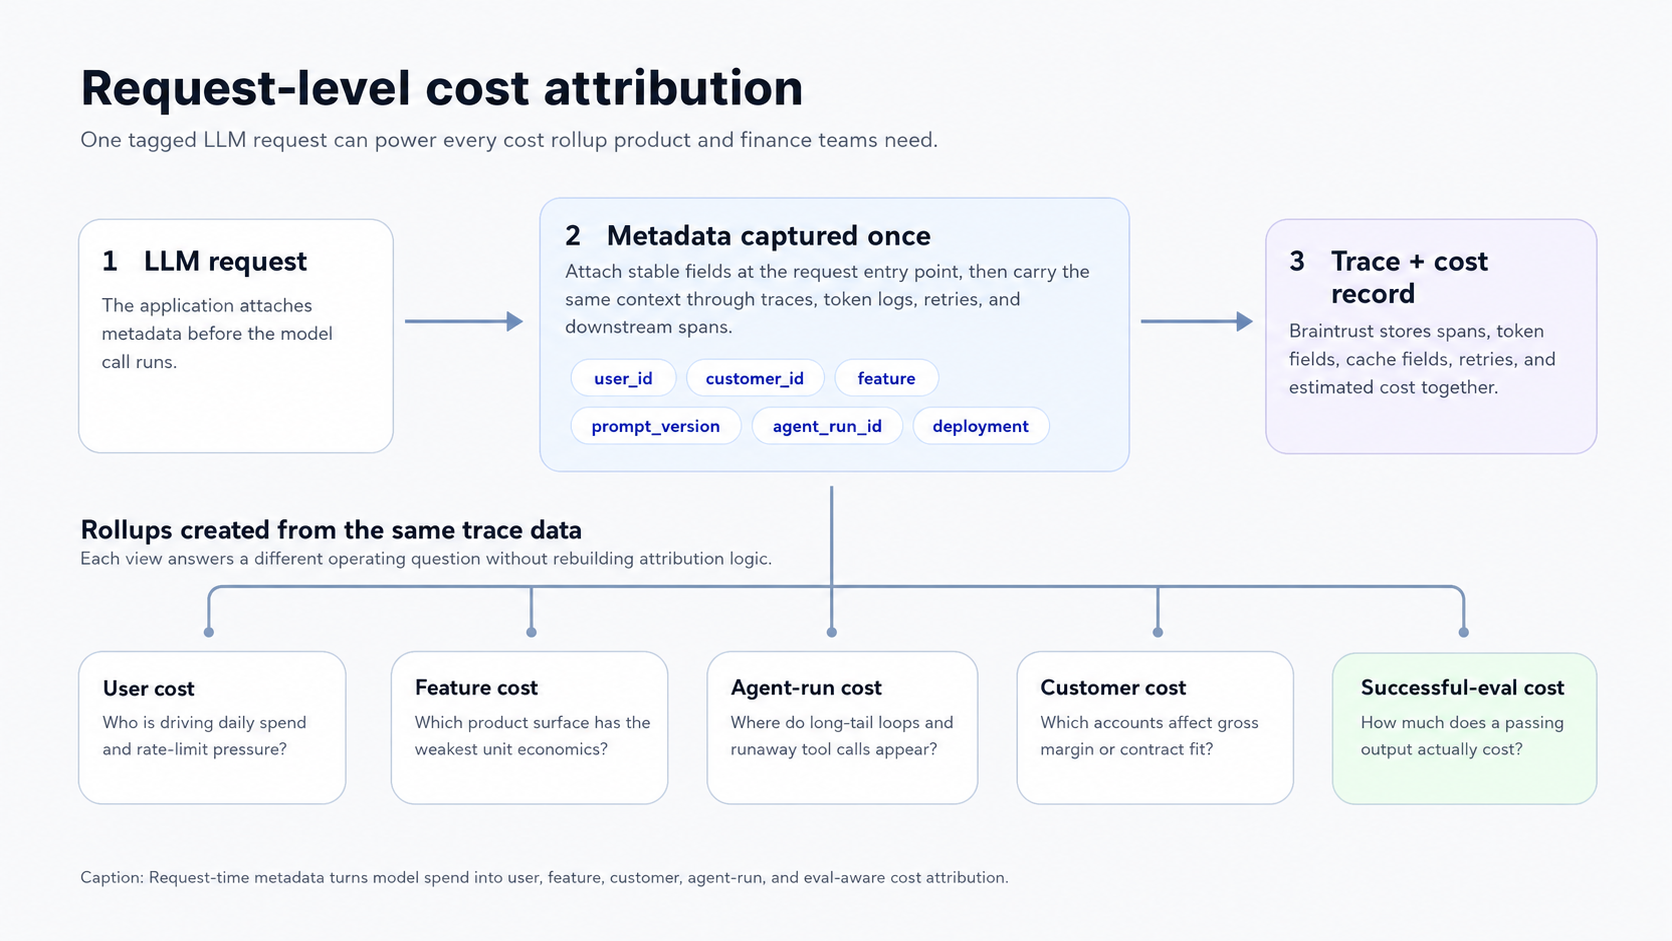
Request-time metadata turns model spend into user, feature, customer, agent-run, and eval-aware cost attribution.
What to tag: The minimum useful set is six fields.
user_idmaps spend to individual accounts.featurenames the product surface, such as chat, summarization, oragent_research.deploymentseparates staging from production.prompt_versionpins the template hash so prompt changes are visible in the trace.agent_run_idgroups a multi-step agent execution into one rollup.customer_idcovers multi-tenant B2B SaaS where billing rolls up to organizations rather than individual seats.
Why proxy and SDK-layer tagging beats log parsing: Post-hoc parsing requires teams to read text logs and reconstruct context that the application has already lost. A request that was routed by feature can appear in raw logs as an opaque model call with only the provider, model, and token count. Tagging at the call site keeps the feature label attached to the span Braintrust ingests, so every downstream rollup, alert, and trace search can use the same metadata without extra reconstruction work.
Cardinality rules: Low-cardinality fields are safe to alert on and chart as separate series. feature, deployment, prompt_version, and model belong in this group. High-cardinality fields such as user_id and agent_run_id are safe to store and filter on, but charting a separate series for each user can make dashboards unusable. A practical pattern is to alert on the cross-product of feature, deployment, and model, then drill into individual users or agent runs in the trace view when an alert fires.
The Braintrust pattern for tagging metadata at the request entry point uses logger.traced with metadata supplied at span creation. This keeps the request context attached to the trace without passing the span object through every helper function.
const logger = initLogger({ projectName: "My Project" });
const openai = wrapOpenAI(new OpenAI());

async function handleRequest(userId: string, orgId: string, prompt: string) {
  return logger.traced(
    async (span) => {
      const response = await openai.responses.create({
        model: "gpt-5-mini",
        input: prompt,
      });
      return response.output_text;
    },
    {
      event: {
        metadata: { userId, orgId },
        tags: ["handle-request"],
      },
    },
  );
}

await handleRequest("user-123", "org-456", "What is the capital of France?");
wrapOpenAI is what attaches the per-call LLM span with token counts and estimated cost underneath the handleRequest span. Without it, only the outer traced span is recorded, and the request-level cost attribution this guide relies on is lost.
The same request-entry pattern works in Python, with metadata and tags attached when the span is created. Wrap the OpenAI client with wrap_openai so token usage and cost are captured on each call.
from braintrust import init_logger, wrap_openai
from openai import OpenAI

logger = init_logger(project="My Project")
openai = wrap_openai(OpenAI())


def handle_request(user_id: str, org_id: str, prompt: str):
    with logger.start_span(
        name="handleRequest",
        metadata={"user_id": user_id, "org_id": org_id},
        tags=["handle-request"],
    ) as span:
        response = openai.responses.create(
            model="gpt-5-mini",
            input=prompt,
        )
        return response.output_text


handle_request("user-123", "org-456", "What is the capital of France?")
The wrapOpenAI and wrap_openai helpers create the child LLM span that carries token counts and estimated cost, and the outer span supplies the request metadata that the rollups in this guide depend on. Auto-instrumentation through the Braintrust CLI can capture existing LLM calls without manually wrapping every call site.
Five LLM cost rollups to build first
Total spend does not address the product, pricing, or reliability questions that arise as LLM usage grows. Once request metadata is attached to spans, the first rollups should connect cost to the users, features, agent runs, customers, and quality outcomes that explain where spend is coming from.
Cost per user per day: User-level cost shows which accounts are driving daily spend and whether rate limits, tier prompts, or account reviews need to change. The gap between the median and p99 user spend also helps determine the included usage for free, trial, and usage-based plans.
Cost per feature request: Feature-level cost separates spend across surfaces such as chat, summarization, and agent_research. Product and finance teams can compare request costs against the value or revenue tied to each workflow, exposing unit economics problems that a provider invoice hides within total product spend.
Cost per agent run: Agent-run cost should track both median and p99 spend by agent_run_id. Median cost shows the normal operating range, while p99 cost exposes runaway loops, excessive tool calls, and long-tail runs that need iteration caps, tool budgets, or model-routing changes.
Cost per successful eval: Successful-eval cost divides spend by the number of requests that pass a defined quality scorer. Two prompts can have similar request cost but very different successful-output cost when one prompt fails more often, triggers retries, or requires downstream cleanup. Braintrust can compute this rollup because cost spans and scorer outputs live in the same trace tree.
Cost per customer: Customer-level cost connects LLM usage to gross margin and contract design in B2B SaaS. Attribution requires customer_id on every relevant span, including spans created inside the customer's agent runs. Once customer-level costs are queryable, the rollup shows which accounts are profitable under current pricing and which need usage limits, contract changes, or workflow review.
For these rollups to remain accurate, cost-metric logging must follow Braintrust's token-field convention. The example below wraps a custom LLM client and logs prompt_tokens, completion_tokens, and total tokens on the span.
from braintrust import current_span, init_logger, start_span, traced

logger = init_logger(project="My Project")


def call_my_llm(input: str, params: dict) -> dict:
    # Replace with your custom implementation
    return {
        "completion": "Hello, world!",
        "metrics": {
            "prompt_tokens": len(input),
            "completion_tokens": 10,
        },
    }


# notrace_io=True prevents logging the function arguments as input, and lets us
# log a more specific input format.
@traced(type="llm", name="Custom LLM", notrace_io=True)
def invoke_custom_llm(llm_input: str, params: dict):
    result = call_my_llm(llm_input, params)
    content = result["completion"]
    current_span().log(
        input=[{"role": "user", "content": llm_input}],
        output=content,
        metrics=dict(
            prompt_tokens=result["metrics"]["prompt_tokens"],
            completion_tokens=result["metrics"]["completion_tokens"],
            tokens=result["metrics"]["prompt_tokens"] + result["metrics"]["completion_tokens"],
        ),
        metadata=params,
    )
    return content


def my_route_handler(req):
    with start_span() as span:
        result = invoke_custom_llm(req.body, dict(temperature=0.1))
        span.log(input=req.body, output=result)
        return result
By Braintrust convention, prompt_tokens should include prompt_cached_tokens for cache reads and prompt_cache_creation_tokens for cache writes. A request with 10 cache reads, 5 cache writes, and 3 uncached tokens logs prompt_tokens as 18. Splitting cached and uncached token fields lets cost dashboards apply the correct rate to each portion of the request.
Normalizing LLM cost across providers
Provider cost comparisons break when every model call is reduced to a single token total. Accurate attribution needs the billing fields returned by each provider response, so input, output, cached, batch, and custom model costs stay separate.
Pricing model differences: Each provider separates usage into billable categories such as input tokens, output tokens, cached input, cache writes, batch usage, endpoint type, and service tier. A model-routing comparison needs to preserve each category so a cheaper-looking route does not create inaccurate cost totals once cache behavior, retries, or output length changes.
Tokenizer differences: The same prompt can produce different token counts across providers and model families. Cross-provider comparisons should log the token counts returned by the provider response, because those counts are closest to the invoice. Estimating tokens with a generic tokenizer can make model swaps look cheaper or more expensive than the billed workload.
Caching credits: Prompt caching changes the cost of repeated context only when cache reads and cache writes are logged separately. Rolling cached and uncached tokens into a single input-token count can overstate spending on cache-heavy workloads and obscure whether caching is reducing costs for long prompts, retrieved documents, or repeated system instructions.
Price table maintenance: The model registry needs an owner and a refresh process. Review the registry whenever a provider adds a model, changes an endpoint configuration, updates cache behavior, or adjusts batch rules. Braintrust includes a built-in registry for common providers, and custom or fine-tuned models can log estimated_cost directly on the span so the recorded cost follows the application's pricing rules.
Enforce LLM cost limits with alerts, caps, and kill switches
Cost tracking should trigger action before LLM spend turns into a billing or reliability incident. Start with user caps, feature-level alerts, and agent-run kill switches.
Hard cap per user: Block or throttle requests when a single user crosses a configurable daily budget. Hard caps are most useful in free tiers, trials, and usage-based products, where a single account can drive disproportionate spend. The check belongs in the proxy or middleware layer, because blocking at the LLM call is too late once input tokens have already been billed.
Soft alert per feature: Send an alert when the cost per feature request moves above a rolling baseline. Feature-level alerts catch prompt regressions, context bloat, and retry patterns because those changes often move the average request cost before the provider invoice changes enough to attract attention. The alert should include the feature, deployment, model, and trace links needed for investigation.
Kill switch on agent runs: Stop an agent run when the token count, tool-call count, retry count, or span depth crosses the ceiling for that agent type. The control belongs within the agent framework because a runaway loop must be stopped while it is still executing, since an alert that fires after the run finishes arrives too late to prevent wasted tokens. Different agents can have different ceilings based on task complexity, expected tool use, and customer tier.
Wiring to on-call workflows: Webhook destinations should route cost and quality alerts to the same systems engineering teams already use for incidents. Slack, PagerDuty, and custom HTTP endpoints work well when the alert includes the affected feature, deployment, model, and trace sample.
Braintrust cost alerts: Braintrust can monitor usage and notify teams when spending exceeds configured thresholds. Native alerts are useful when cost thresholds should be computed from the same traces used for debugging and evals. Routing alerts into Datadog or Grafana can still make sense when LLM cost incidents need to sit in the same on-call rotation as service health, but the cost source should remain tied to the trace and evaluation data that explain the spike.
Gate cost reductions before production rollout
Alerts catch spend spikes, but they do not prevent a cost-saving change from lowering output quality. Model swaps, prompt compression, caching changes, and routing updates should be treated as release changes. A lower-cost version should move forward only when the eval pass rate and latency stay within production thresholds, and the cost per successful output improves.
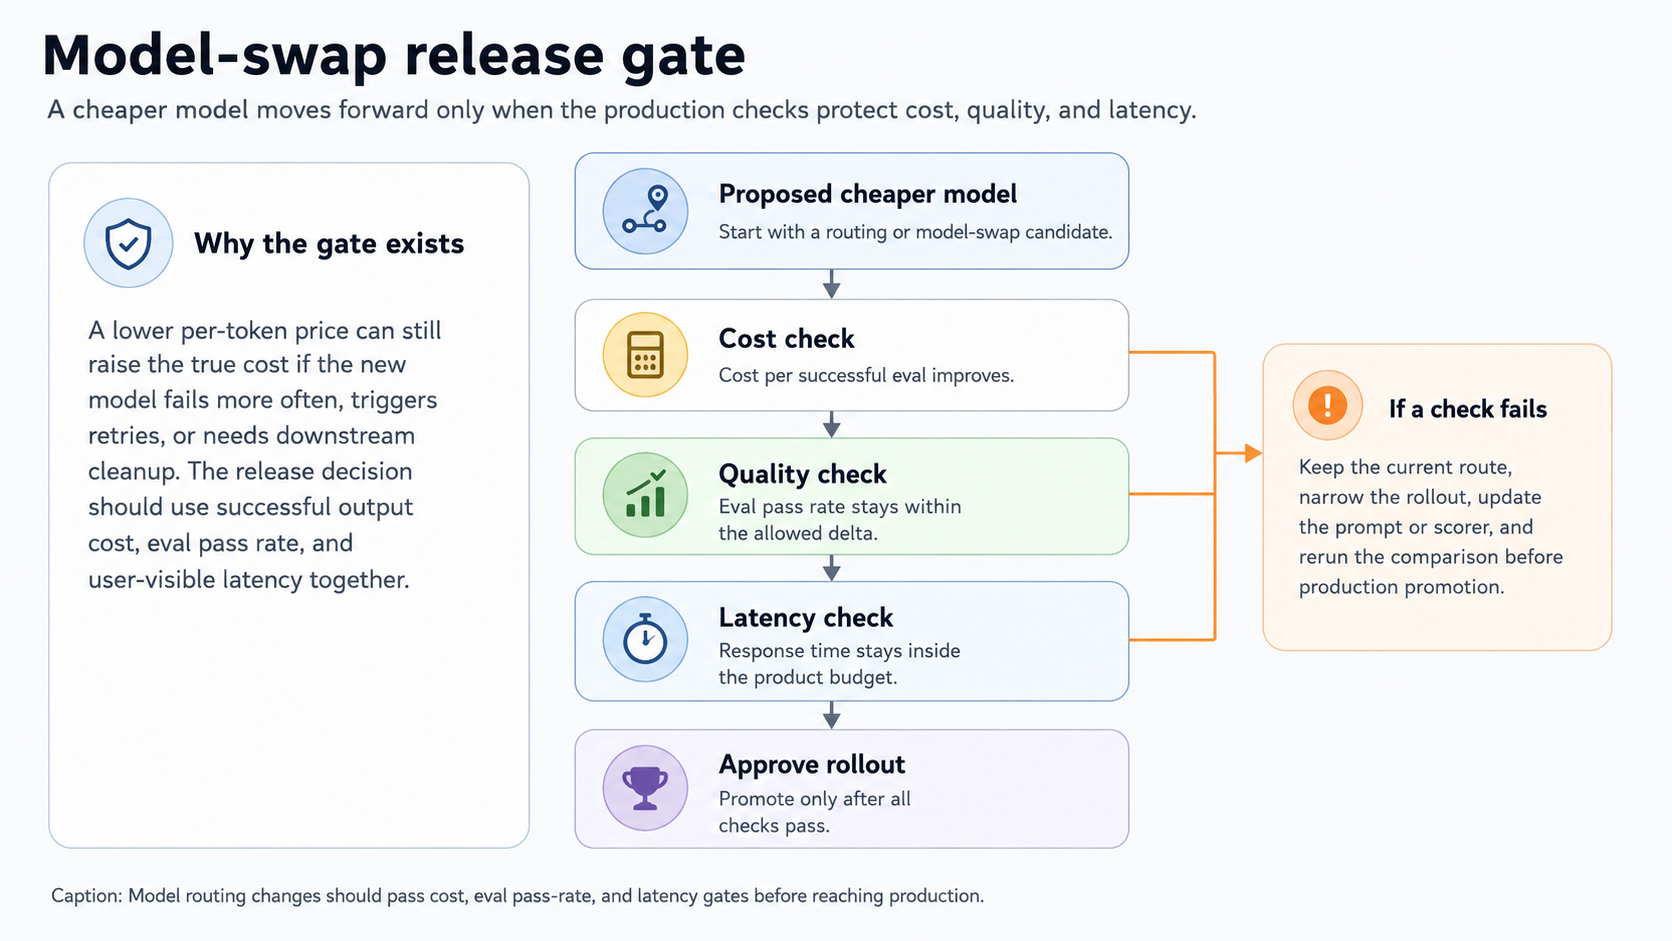
Model routing changes should pass the cost, eval pass rate, and latency gates before reaching production.
Production A/B pattern: Sample a small percentage of production traffic to the cheaper route, score both outputs against the same scorer set, and promote the change only when the pass rate holds within the defined threshold. In Braintrust, experiments capture both runs as immutable snapshots, with metadata tracking which model, prompt, or route produced each output.
Eval("My Project", {
  experimentName: "My experiment",
  data: initDataset("My Project", { dataset: "My dataset" }),
  task: async (input) => {
    // Your LLM call here
    return await callModel(input);
  },
  scores: [Factuality],
  metadata: {
    model: "gpt-5-mini",
  },
});
The metadata field captures the model being tested, so the experiment view can filter and compare runs side by side without renaming experiments. Running the same task with a different model value produces a comparable experiment in the same project.
Online scoring on production traces: For the A/B comparison to use real production data, online scoring runs scorers automatically on logged traces in the background. The REST API call below configures a scoring rule that runs a selected scorer on root spans in the project.
curl https://api.braintrust.dev/v1/project_score \
  -H "Authorization: Bearer $BRAINTRUST_API_KEY" \
  -H "Content-Type: application/json" \
  -d '{
    "project_id": "<project_id>",
    "name": "Production scoring rule",
    "description": "Score production traces",
    "score_type": "online",
    "config": {
      "online": {
        "sampling_rate": 1,
        "scorers": [{ "type": "function", "id": "<scorer_function_id>" }],
        "apply_to_root_span": true
      }
    }
  }'
The sampling_rate field controls how much production traffic gets scored. High-volume applications can use lower sampling rates to manage scorer costs, while critical or lower-volume workflows may require broader coverage.
Block merges that lower quality: The Braintrust GitHub Action runs evaluations on pull requests and posts results as a comment. The action is non-zero when scores fall below configured thresholds, thereby turning eval results into a release requirement.
name: Run evaluations

on:
  pull_request:
    branches: [main]

jobs:
  evaluate:
    runs-on: ubuntu-latest
    steps:
      - uses: actions/checkout@v3
      - name: Set up Node.js
        uses: actions/setup-node@v3
        with:
          node-version: "18"
      - name: Install dependencies
        run: npm install
      - name: Run Evals
        uses: braintrustdata/eval-action@v1
        with:
          api_key: ${{ secrets.BRAINTRUST_API_KEY }}
          runtime: node
Promotion checklist: Three conditions should hold before a cost-saving change reaches production:
- Eval pass-rate delta stays within the accepted threshold.
- Latency stays within the user-visible budget for the affected feature.
- Cost per successful eval improves because a cheaper route that fails more often can still raise the true cost once retries, rework, and downstream cleanup are counted.
Decide where cheaper LLMs can run safely
A cheaper model is a good choice only when the workload keeps the cost per successful output lower without pushing eval pass rate or latency outside production thresholds. The safest routing decisions usually come from splitting each workflow into task types, then testing which tasks need a flagship model and which tasks can run on smaller or mid-tier models.
Chat assistants: Use a mid-tier model as the default for most conversational turns. Escalate to a flagship model for tasks that require long-context reasoning, multi-step planning, or higher judgment quality. Classification, intent detection, routing, and short, structured outputs can often run on smaller models when eval results show stable pass rates.
Agentic research: Keep stronger models for the planning and synthesis steps, as those stages shape the final answer. Tool selection, extraction, formatting, and intermediate reasoning steps may be candidates for cheaper models when evals show that answer quality holds. Agentic workflows also need token budgets and span-depth limits because long-tail cost often comes from repeated tool calls or unbounded loops.
RAG over documents: Choose the embedding model based on retrieval quality against the eval set. Use a mid-tier generation model as the default, then escalate only when the retrieved context is long, the question requires synthesis across multiple documents, or the answer needs stronger reasoning. Many RAG workloads overpay when every query uses the most expensive model, even though simpler lookup questions can pass evals on cheaper routes.
In Braintrust, model-routing decisions can use cost from rollups, eval pass rate from scorers, and latency from trace timing. Keeping those signals in one workflow makes each routing change easier to compare before the cheaper model reaches production.
Start free with Braintrust to connect LLM cost, traces, evals, and release gates in one workflow.
FAQs: how to track LLM costs (2026)
What's the difference between cost tracking and cost optimization?
Cost tracking explains where the LLM spend comes from. It connects cost to users, customers, features, prompt versions, agent runs, and quality outcomes. Cost optimization is the set of changes teams make once attribution shows where spend is concentrated, such as model routing, prompt changes, caching, or rate limits. Tracking has to come first because every optimization needs a baseline to measure whether the cost actually improved.
How accurate is the platform-level cost compared to the provider bill?
Platform-level cost is reliable when token counts, cached-token fields, batch usage, and custom model prices are logged correctly. The largest gaps usually come from missing cached-token fields, stale registry prices, batch discounts, or fine-tuned models that still use base-model pricing in the registry. When platform cost and provider invoices diverge, audit the token fields and registry entries before changing the attribution logic.
Do prompt-caching credits show up in tracked cost?
Prompt-caching credits show up only when cache reads and cache writes are logged separately. Braintrust uses prompt_cached_tokens for cache reads and prompt_cache_creation_tokens for cache writes, with prompt_tokens including both fields. Without separate cached-token fields, dashboards may treat cached input as regular input, which can make cache-heavy workloads look more expensive than they are.
How often should the model price table refresh?
Review the model registry on a regular cadence and update it whenever a provider launches a model, changes an endpoint, updates cache behavior, or changes batch pricing rules. Braintrust includes a built-in registry for common providers, so most manual work is limited to custom and fine-tuned models, as well as internal routing labels.
Do you need a separate cost tool if the team already has an LLM observability platform?
A separate cost tool is usually unnecessary when the existing LLM observability workflow tracks tokens, computes cost, supports request-time tagging, and connects cost to traces and quality scores. Braintrust keeps costs alongside traces, scores, and prompt versions, so teams can investigate spend and quality within the same workflow. A dedicated cost tool is only useful when the existing observability stack cannot see LLM-specific spans or request metadata.
How do you handle cost attribution for fine-tuned models?
Register the fine-tuned model's pricing rules in the model registry or log estimated_cost directly on the span. Without that step, cost calculations may fall back to the base model and understate spend. Fine-tuned models need explicit attribution because their pricing, routing, and evaluation behavior often differ from those of the base model used to create them.