How to track LLM token usage (2026): Prompt, completion, context window, and per-step visibility
Total token usage is useful for reporting, but it does not explain where production LLM behavior is breaking down. Prompt bloat, context window pressure, and runaway agent loops can all increase token usage, each requiring a different debugging view.
Effective token tracking starts with three levels of visibility: prompt and completion tokens per call, context window utilization per request, and token usage per step inside agent traces. Each level answers a different operating question, from why latency is rising to which span in an agent run is burning tokens.
This guide covers how to log token usage through Braintrust SDK integrations, OpenTelemetry conventions, and auto-instrumentation. It also explains how Braintrust connects token counts to traces, cost, latency, dashboards, prompt versions, and eval workflows, making token usage easier to investigate and control in production.
Why aggregate token totals hide production issues
A monthly or daily token total answers budgeting questions without showing which part of an LLM workflow changed. The same token spike can come from a growing prompt, a request approaching the context window, or an agent step that retries inside a trace. Each issue needs a different diagnostic view.
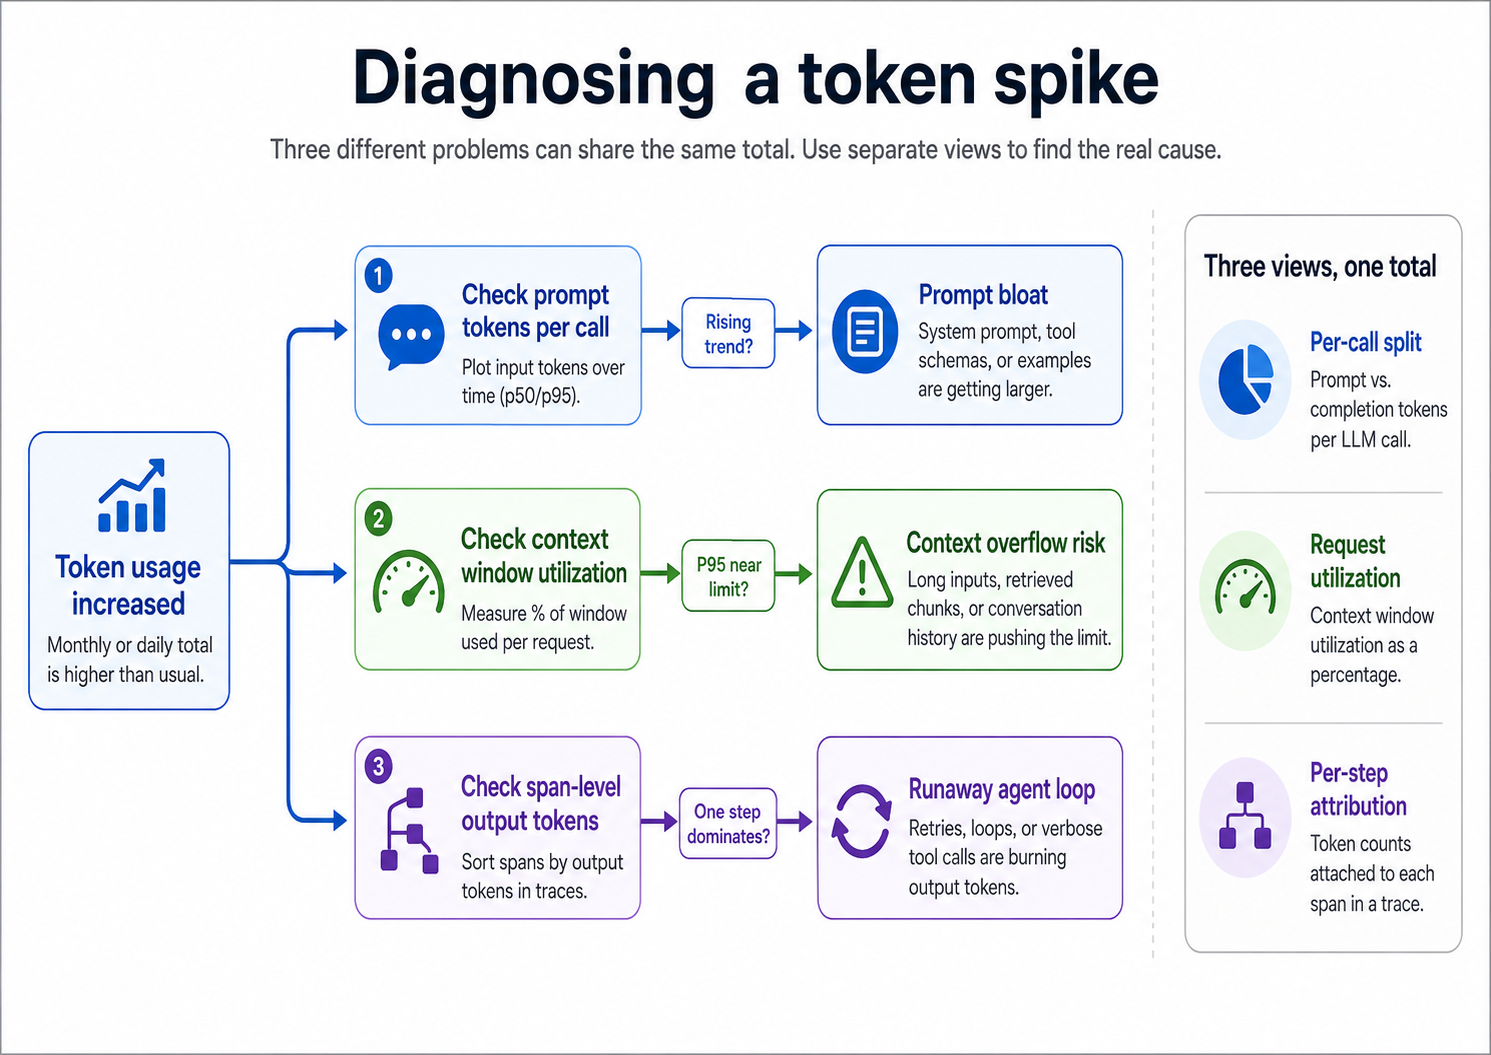
A token spike needs separate views for per-call prompt and completion tokens, for request-level context utilization, and for per-step attribution within traces.
Prompt bloat usually comes from small template changes that accumulate over time. A few-shot example, a longer tool description, or a new fallback instruction can increase the number of input tokens on every call without causing an obvious failure. Finding prompt bloat requires breaking out prompt and completion tokens per call, then tracking them across prompt versions and production traffic.
Context overflow usually occurs when a request is already close to the model's context limit, and a long user input, an oversized retrieval result, or accumulated conversation history pushes the call past the safe range. Finding context pressure requires request-level utilization expressed as a percentage of the model's context window, so teams can see which tenants, features, or routes are operating too close to the limit.
Agent loops need span-level visibility because the expensive step may sit deep inside a trace. A retrying tool call, oversized retrieval step, or sub-agent loop can dominate total token usage even when the top-level trace looks normal. Finding the runaway step requires token counts for each span, so teams can sort the trace by prompt tokens, completion tokens, cost, or latency.
Log token usage on every LLM call
Token tracking starts with structured usage data on every model call. There are three practical ways to collect the data: read the provider SDK payload, emit OpenTelemetry GenAI attributes, or use Braintrust auto-instrumentation. Each option can capture prompt tokens, completion tokens, cached-token fields, and reasoning-token fields, but the setup and aggregation work differ.
Native SDK usage payloads: OpenAI and Anthropic return usage fields on model responses. OpenAI includes fields such as prompt_tokens, completion_tokens, total_tokens, cached-token details, and reasoning-token details. Anthropic includes fields such as input_tokens, output_tokens, cache_read_input_tokens, and cache_creation_input_tokens. Reading provider usage fields is straightforward, but the application still owns aggregation across retries, tool calls, agent steps, and trace-level rollups.
OpenTelemetry GenAI semantic conventions: OpenTelemetry defines a portable schema for LLM telemetry, including attributes such as gen_ai.usage.input_tokens, gen_ai.usage.output_tokens, gen_ai.usage.cache_read.input_tokens, gen_ai.usage.cache_creation.input_tokens, and gen_ai.usage.reasoning.output_tokens. OpenTelemetry works well for organizations that already standardize on OTel, but the instrumentation library still needs to emit the GenAI attributes consistently across the frameworks in use.
Braintrust auto-instrumentation: Braintrust can capture token usage automatically for supported LLM clients and frameworks. Call auto_instrument() once at startup, initialize the logger, and supported model calls create spans with input, output, latency, token usage, and cost attached.
import os

import braintrust

# Call once at startup — all LLM calls are traced automatically
braintrust.auto_instrument()
braintrust.init_logger(
    api_key=os.environ["BRAINTRUST_API_KEY"],
    project="My Project (Python)",
)

from openai import OpenAI

client = OpenAI(api_key=os.environ["OPENAI_API_KEY"])
response = client.responses.create(
    model="gpt-5-mini",
    input="What is the capital of France?",
)
Every call through the OpenAI client now creates a span that includes token usage, cost, latency, input, and output. The same pattern applies across supported libraries, including Anthropic, LiteLLM, Pydantic AI, LangChain, LlamaIndex, and the OpenAI Agents SDK. For TypeScript, the equivalent setup is running the application with node --import braintrust/hook.mjs.
Streaming responses require the same treatment as standard responses, as the final token count may arrive after the streamed content. Braintrust automatically reassembles supported streaming responses, so the final span includes the complete prompt and completion counts without extra configuration.
Auto-instrumentation is the least manual setup when the application uses supported SDKs and frameworks. Native SDK reads make sense when an organization already has a logging pipeline capable of storing and aggregating raw usage data. OpenTelemetry is for teams that want provider-portable telemetry attributes within an existing observability stack. Whichever option the team chooses, token usage should be attached to every call and linked to the trace explaining the request.
Separate prompt and completion tokens per call
Once token usage is available on every call, split prompt tokens from completion tokens before building rollups. A single total hides whether token growth is coming from larger inputs, longer outputs, or reasoning tokens attached to the model response.
Cost profile: Prompt-heavy and completion-heavy workloads create different optimization problems. Long-document summarization usually spends more on input, while chat, content generation, and reasoning-heavy workflows often spend more on output. Splitting the fields shows whether the next fix should target prompt size, retrieved context, output limits, routing, or reasoning configuration.
Latency profile: Prompt tokens affect the time to the first token because the model must process the input before generation begins. Completion tokens affect total response time because each generated token adds wall-clock latency. If p95 latency increases while prompt size remains stable, the regression likely lies in completion length. If the time to first token rises, prompt size or retrieved context is usually the first place to inspect.
Debugging signal: A large completion_tokens value usually points to an open-ended prompt, a missing stop sequence, a missing max-output cap, or a reasoning model producing internal thinking tokens that are billed as output. A large prompt_tokens value usually indicates prompt bloat, oversized tool schemas, a long conversation history, or retrieval chunks that should be trimmed before the model call.
Braintrust shows the prompt and completion split on every LLM span and rolls those fields up to the parent trace. Teams can read totals at the trace level, drill into the specific call that caused the spike, and build dashboards for patterns such as unusually large completions without writing separate aggregation logic.
Attribute token usage to each agent step
Per-call token totals can show that an agent run was expensive, but they often cannot show which step caused the spike. Agent workflows need token usage attached to each span so planning calls, tool calls, retrieval steps, retries, and sub-agent runs can be inspected separately.
Every span in an agent trace should capture token usage alongside the operational data produced by that step.
- A tool-call span should include the tool name, arguments, raw output, duration, retry count, and input and output tokens.
- A retrieval span should include the query, returned chunk sizes, and tokens added to the next LLM call.
- A sub-agent span should roll up the token usage from its child spans.
To find the expensive step in a long trace, sort spans by output tokens, inspect retry clusters, and check retrieval steps for oversized chunks. A tool call that runs once should not consume more output tokens than the agent's final answer. A retrieval step that pulls far more context than the answer needs creates waste that aggregate dashboards will not surface.
Span-level token attribution shows which tool calls, retrieval steps, retries, or sub-agent runs are driving cost inside an agent trace.
Braintrust handles span-level token tracking through the same auto-instrumentation used for LLM calls. Wrapping the agent framework or LLM client creates spans for supported steps, with tokens attached to each span. For custom application logic around model calls, the @traced decorator captures function-level inputs and outputs and nests them under the surrounding trace.
import requests
from braintrust import init_logger, traced

logger = init_logger(project="My Project")


# Decorate a function to trace it automatically
@traced
def fetch_user_data(user_id: str):
    # This function's input (user_id) and output (return value) are logged
    response = requests.get(f"/api/users/{user_id}")
    return response.json()


# Use the function normally
user_data = fetch_user_data("user-123")
Braintrust assembles a typed span tree where each step shows tokens, cost, and latency, with parent rollups at the top of the trace. The timeline view scales spans by token count and estimated cost, so expensive steps stand out before the team reads individual span contents. In an OpenTelemetry stack, the portable equivalent is tagging each span with gen_ai.usage.input_tokens and gen_ai.usage.output_tokens, then querying the observability backend for span-level aggregates.
Track context window utilization
Context window utilization shows how close a request is to the model's limit. Calculate utilization by dividing prompt_tokens by the model's maximum context window, then store the result as a percentage for each call.
Average utilization can hide the requests most likely to fail. A tenant, feature, or route may look safe at the median while a small group of requests regularly approaches the context limit. Track p95 utilization by tenant, feature, model, and route so context pressure is visible before users hit overflow errors.
When utilization stays high, the fix depends on the load:
- Chat applications can summarize or truncate older messages.
- RAG systems can reduce retrieved chunk size, tighten retrieval filters, or shard the request.
- Agent workflows can cap the intermediate context passed between steps.
Braintrust attaches prompt tokens to every span, which lets teams calculate context utilization from existing trace data. Teams can chart utilization by tenant, feature, model, and route, then use the same data to trigger alerts when requests operate too close to the model's window.
Track caching and batch usage separately
Prompt caching and batching can reduce billed cost without reducing total token volume.
OpenAI prompt caching: OpenAI responses can include cached-token details under usage.input_tokens_details.cached_tokens on the Responses API (or usage.prompt_tokens_details.cached_tokens on the legacy Chat Completions API). Track that field separately from ordinary input tokens so cache-heavy workloads do not look as expensive as uncached workloads. If cached tokens are lower than expected, check whether the reusable prefix is stable across requests, long enough to qualify, and present in the same position across calls.
Anthropic prompt caching: Anthropic exposes cache reads and cache writes through usage fields such as cache_read_input_tokens and cache_creation_input_tokens. Track both fields separately because cache creation and cache reads have different billing behavior. In multi-turn workflows, a stable system prompt or reusable instruction block should show cache creation on the first eligible call and cache reads on later calls.
Batching for throughput: Batch APIs are useful for workloads that do not need immediate responses, such as offline eval runs, bulk classification, and pre-computation. Token tracking should treat batch responses like standard responses: each result still needs usage fields logged, attached to the relevant job or request, and included in the same rollups used for synchronous calls.
Cache hits and batch usage should appear in the same Braintrust dashboards used for prompt and completion splits. To keep those views accurate, log usage fields for every call type, including streaming responses, batch jobs, cached prompts, and standard synchronous requests.
Avoid token tracking errors that distort usage data
Token dashboards are only useful when the underlying counts match how the request actually ran and billed. Five errors make token data unreliable in production.
Tokenizer mismatches: Local token estimates are useful for planning, but production reporting should rely on the usage fields returned by the provider response whenever possible. Each provider uses a different tokenizer, and cross-provider estimates can be wrong enough to distort cost comparisons, routing decisions, and context-window alerts.
Missing tool-call tokens: Tool definitions, tool-call arguments, and tool outputs can all affect token usage. An agent with a large tool schema may spend tokens on tool definitions even when only one tool runs. When prompt tokens look higher than the visible user message suggests, inspect the tool schemas, system prompt, and request payload sent to the model.
Double-counting retries: Retry storms can inflate token totals when each retry is logged as a separate top-level request. Retries should be grouped under the parent trace so the dashboard can show both total usage and retry behavior without making the workload look like unrelated traffic. Braintrust auto-instrumentation handles retry grouping for supported libraries, while manual instrumentation needs to preserve the parent-child trace structure.
Ignoring system prompt growth: System prompts often expand through small edits: new safety instructions, extra examples, longer tool descriptions, or fallback rules. Track system prompt size by prompt version so growth appears during review, not only after token usage rises in production. Braintrust prompt versioning helps surface prompt-size changes at the revision level.
Missing reasoning tokens: Reasoning models can generate billed tokens that do not appear in the visible response. Tracking completion tokens by counting visible output text will undercount usage for models that return separate reasoning-token fields. Read the provider usage object and store reasoning-token fields separately so cost, output length, and context utilization stay accurate.
FAQs: how to track LLM token usage (2026)
Why do token counts differ across providers for the same text?
Token counts differ because each provider uses its own tokenizer. The same prompt can produce different token counts across OpenAI, Anthropic, Google, and other model families, which affects cost, context utilization, and routing comparisons. For production reporting, use the usage fields returned by the provider response whenever possible.
What counts as a token versus a character or word?
A token is the unit produced by the model's tokenizer. A token may represent a full word, part of a word, punctuation, whitespace, or part of a code snippet, depending on the language and content type. Tool schemas, system prompts, retrieved context, and conversation history also consume tokens, so token usage should be measured from the full request sent to the model.
Does streaming change the token count?
Streaming does not change the final token count because the model still processes the full request and generates the same response tokens. The tracking requirement is different, though. Streaming integrations need to capture the final usage object or reassemble the response so prompt and completion counts are attached to the completed span.
How do you measure token usage on reasoning models?
Use the reasoning-token fields returned by the provider response. Reasoning models can generate internal tokens that do not appear in the visible answer, but those tokens can still affect cost and context utilization. Counting only the visible response text will understate usage for reasoning-heavy requests.
Do you need a separate tool if you already log every LLM request?
Raw logs are not enough once token usage needs to support debugging, cost analysis, and release decisions. Token counts should be attached to spans, rolled up to the trace level, filterable by metadata, and visible by tenant, feature, model, prompt version, and agent step. Braintrust handles the rollups through traces and dashboards, so teams do not have to build the span tree and aggregation layer on top of raw logs.
How does prompt caching affect billed token counts?
Cached tokens can still appear in input-token totals, but billing depends on whether the provider treats those tokens as cache reads, cache writes, or regular input. Track cached-token fields separately from ordinary prompt tokens so dashboards show the difference between total token volume and billed cost. In Braintrust, cached-token fields can sit alongside prompt, completion, cost, and latency data on the same spans.