LLM call observability: Tracing every request, response, and token in production
LLM call observability captures the full request, response, and metadata for every API call sent to a language model. APM tools only show HTTP-level signals, and agent observability operates above the call layer to track multi-step reasoning loops. Most production LLM workloads (chatbots, RAG, classification, embeddings, and summarization) do not run agent loops, but every workload still needs visibility into what the model received, what it returned, how long it took, how much it cost, and whether the output met quality expectations.
On every call, capture:
- The full request payload, including prompt, system message, tool definitions, and parameters
- The full response payload, including content, tool calls, finish reason, and streamed token timeline
- Metadata such as model version, provider, deployment ID, prompt version, and user or session ID
- Performance signals like time-to-first-token, total latency, and output tokens per second
- Cost data, including input tokens, output tokens, the per-million-token rate at call time, and dollar cost
The recommended approach is SDK-based capture with async flush, paired with a managed backend that ties traces to evals. Braintrust provides LLM call observability via its SDK and Gateway, with a free tier that covers 1 GB of processed data.
What is LLM call observability?
An LLM call is one API request sent to OpenAI, Anthropic, Google, xAI, or another model provider, followed by one response from the model. LLM call observability captures the full unit of work: the request payload, the response payload, the metadata around the call, and the error, retry, and timeout behavior tied to the provider interaction.
Most production debugging starts with the individual model call. When a chatbot returns a wrong answer, the engineer needs to see the exact prompt that went out, the exact response that came back, the model version, the temperature, the tool definitions, and the token-by-token timing. Aggregate dashboards cannot answer those questions; call-level traces, with the full payload preserved, can.
Two adjacent layers handle different concerns and miss the data captured by call observability. The diagram below illustrates how LLM call observability sits between infrastructure and agent observability.
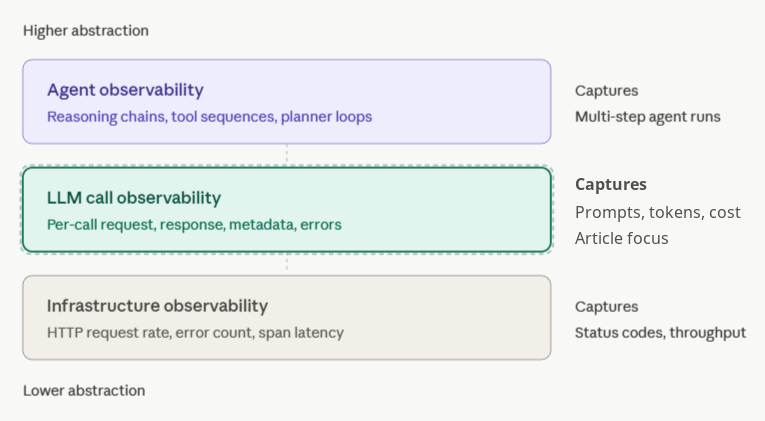
LLM call observability vs infrastructure observability (APM): Datadog, New Relic, and similar APM tools capture HTTP-level signals: request rate, error count, and span latency. They report that the call to api.openai.com succeeded with HTTP 200 in 814 milliseconds. They do not show which model handled the request, what the prompt contained, how many tokens came back, or whether the response made any sense. APM treats the LLM provider as a black-box dependency, while call observability opens the box.
LLM call observability vs agent observability: Agent observability captures multi-step reasoning chains, tool-use sequences, and planner-executor loops. A single agent run might include 12 LLM calls, 4 tool invocations, and a retrieval step. Agent observability tracks the full sequence. Call observability tracks each individual call inside the sequence.
Most production LLM workloads need call-level visibility before agent-level tracing becomes useful. A RAG pipeline, a classification system, a translation feature, a summarization endpoint, an embedding job, or a one-shot copilot completion may not run an agent loop, but each workload still needs full visibility into what the model received and what the model returned on every call.
What to capture in every LLM API call
Five categories of data live inside an LLM call. Capture all five on every request, and the trace can answer most debugging or analysis questions after the fact. Drop one category, and your team will end up replaying production scenarios from incomplete logs.
Request payload: prompt, system message, tools, parameters
The request is the full input sent to the model. Capture the system message, the messages array with conversation history, tool definitions for function calling, and every parameter, including temperature, top_p, max_tokens, response_format, and seed. Capture the payload after templating, not the pre-rendered version generated by the application code. Avoid truncation when debugging depends on long-context input. A summarization prompt for a 50KB document requires the full document to be available, because a production bug six weeks later may sit at token 4,300 in the source text. Braintrust supports span input fields for structured payloads, and large JSON payloads can be preserved through attachments when the payload size exceeds normal span limits.
Response payload: content, tool calls, finish reason, streamed tokens
The response is everything the model returned: the content string, any tool call arguments, the finish reason, and the per-token timeline when the call is streamed. Finish reason deserves explicit capture because stop, length, tool_calls, and content_filter represent different outcomes. A response ending in length has been cut off before the model finished generating. A response that ends with content_filter was blocked by the provider's safety system. These failure modes need to appear clearly in the traces, as application logic may otherwise treat both responses as successful completions.
Metadata: model version, provider, deployment ID, prompt version
Metadata is the context that makes call data comparable. Capture the exact model string (e.g., gpt-4o-2024-11-20) rather than gpt-4o, along with the provider (Azure OpenAI or AWS Bedrock), deployment ID, prompt version, user or session ID, and any feature flags or experiment buckets. Without metadata, teams cannot slice latency by model, compare prompt v3 against v4, or trace a customer-reported bug back to the user session where the issue occurred. Braintrust's logging SDK supports metadata on spans, so the prompt version and deployment ID can become filterable dimensions.
Performance: time-to-first-token, total latency, tokens per second
LLM performance has two distinct dimensions, and total latency hides both. Time-to-first-token, or TTFT, measures the gap between sending the request and receiving the first streamed token, which controls how responsive the UI feels. Output tokens per second measures streaming throughput after the first token arrives, which controls how fast the full answer renders. A model with 200ms TTFT and 80 tokens per second can feel faster than a model with 100ms TTFT and 30 tokens per second, even though the second model starts sooner. Capture both metrics, plus total wall-clock latency and any provider-reported queue time.
Cost: input tokens, output tokens, per-million-token rate, dollar cost
Token counts and dollar costs are different numbers, and production teams need both. Capture input tokens, output tokens, and cached input tokens where the provider exposes discounted cache usage. Compute dollar cost using the per-million-token rate active when the call was made, not the current rate. Provider pricing changes, and recording the rate at call time keeps historical cost analysis accurate as prices shift. Braintrust tracing computes cost for major providers and exposes token and cost aggregations in the UI.
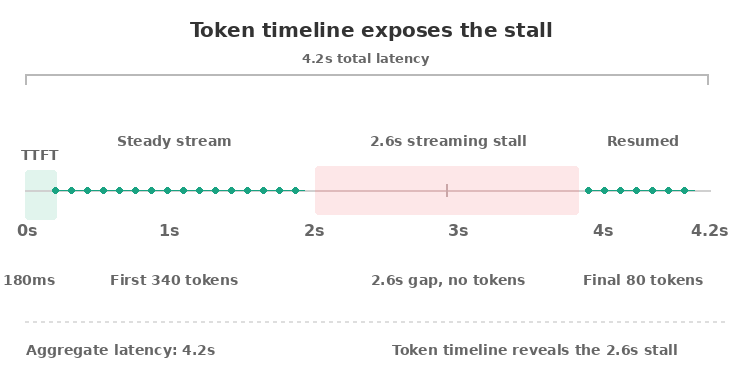
Token-level tracing for LLM streaming observability
Token-level tracing goes one layer deeper by recording the timing of every token as the model streams its response. Aggregate metrics tell you the call took 4.2 seconds. Token-level tracing shows that the model produced the first 340 tokens in 1.1 seconds, stalled for 2.6 seconds, then produced the final 80 tokens in 500 milliseconds. Aggregate latency hides the stall. The token timeline shows exactly where the stall occurred.
What streaming-aware traces reveal
Latency stalls are common in production and almost invisible without token-level data. Stalls can happen when the model hits a high-perplexity region, when the provider rate-limits mid-stream, when a tool-calling model pauses to assemble structured output, or when client-side network buffering delays delivery. If your UI renders tokens as they arrive, users feel every pause. Capturing the timeline is the only way to debug streaming delays after the fact.
Partial outputs are the other use case. When a streamed call fails mid-response, the user may see the first half of an answer before the connection drops. Without token-level capture, your trace shows a failed call with no content. With token-level capture, your trace shows the 280 tokens the user actually saw, allowing you to reproduce the user experience and decide whether to retry, return the partial output, or surface an error.
How to capture without overhead
Three techniques keep token-level tracing cheap.
First, sample selectively. Capture full token timelines on 100% of calls in low-volume features and on 5-10% of calls in high-volume features.
Second, buffer asynchronously. The streaming handler drops timestamps into an in-memory queue, and a background flusher batches them to the observability backend every few hundred milliseconds.
Third, record only the timestamp and token index, not the token text twice. The text already lives in the response payload.
What it costs
A token-level trace adds roughly 16 bytes per token in memory for the timestamp and index, plus one network flush per batch. For a 1,000-token response, token-level tracing adds 16KB of trace data and a single batched write. CPU overhead from timestamp capture is negligible at any reasonable streaming rate. Network bandwidth during flush is the only meaningful cost, and batching reduces the bandwidth impact to a fraction of the call's payload.
Capture LLM telemetry without production overhead
LLM call observability fails the moment it slows down the call it's trying to observe. Engineers who add instrumentation, then watch p99 latency climb, rip the instrumentation out within a sprint. The fix is architectural. Three operational concerns govern whether your tracing stays out of the way.
Overhead budget: under 5ms per call
A correctly designed SDK adds under 5 milliseconds of CPU time to each LLM call. The overhead comes from serializing request and response payloads, computing token counts and cost, and pushing the trace onto an in-memory queue. None of that work should block the network call to the LLM provider. Serialization should happen after the response has already returned to the application, on a non-blocking code path. Braintrust's SDK follows this pattern, so trace work runs outside the provider call.
Sampling strategy by traffic volume
Not every call needs full token-level capture. Three sampling tiers cover most workloads.
For low-volume features with fewer than 10 requests per second, sample at 100%. The data volume is small enough that full capture is cheap, and every trace can help during debugging.
For mid-volume features between 10 and 1,000 requests per second, sample 100% of the call envelope, including request, response, metadata, performance, and cost, while capturing 10-25% of streamed token timelines. Full call capture stays cheap, while selective token timelines avoid unnecessary storage growth.
For high-volume features above 1,000 requests per second, reduce call envelope sampling to 10-20% and reserve full token-level capture for explicit debug sessions. Use head-based sampling keyed to the session ID, so traces preserve complete sessions rather than random fragments.
Backpressure and bounded queues
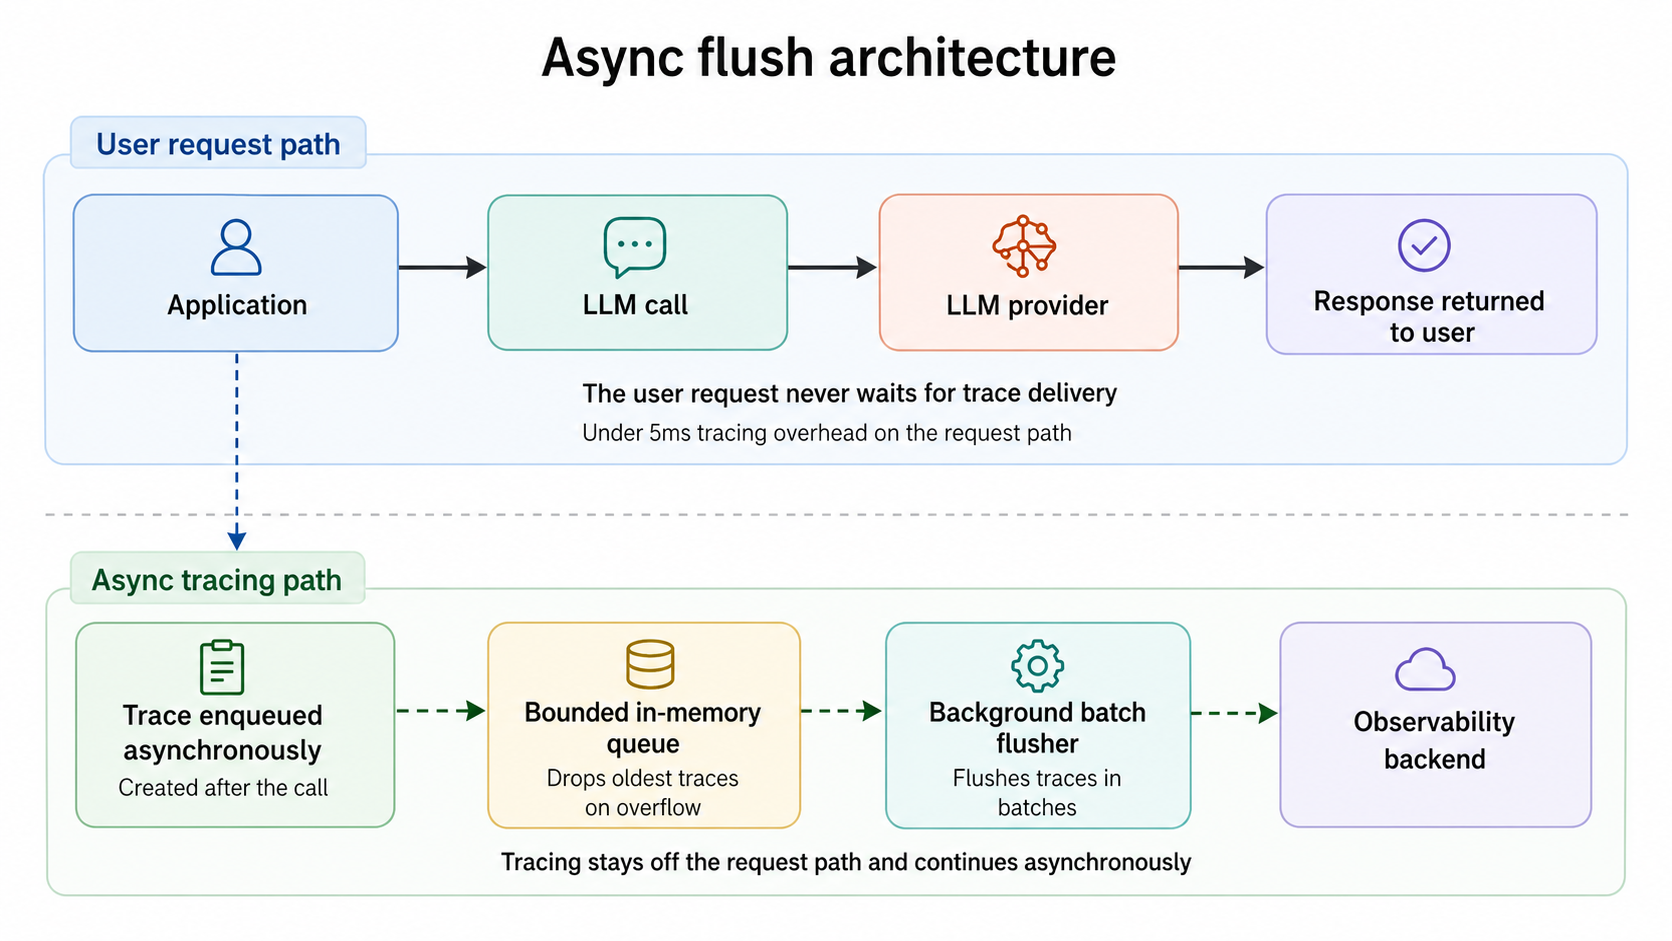
When the observability backend is slow or unavailable, the LLM call should not wait for the trace to flush. A bounded in-memory queue with a drop-oldest policy keeps tracing decoupled from the user request. Calls land in the queue in microseconds; a background worker batches and flushes traces to the backend; and if the backend stalls, the queue fills up and starts dropping the oldest unflushed traces. The application continues to serve LLM calls at full throughput. You lose some traces during the outage, but you do not lose users.
The diagram below shows how async flush keeps tracing off the request path.
Drift detection, regression detection, and call-to-eval workflows
Call-level data is only useful if it changes what reaches production. Three workflows turn raw traces into shipping decisions: detecting time-based drift, detecting regressions during deployment, and converting problematic production calls into permanent eval cases.
Drift detection across models and prompt versions
Drift is the slow change in output distribution that nobody notices until a customer complains. A model provider silently updates gpt-4o behind the version pointer. A vector index gets reindexed, and retrieval starts pulling different chunks. A new prompt revision changes the tone of generated emails by 15%. None of these changes throws an error, yet each one shifts call-level distributions such as average output length, refusal rate, tool-call frequency, sentiment of generated content, or the score from an automated judge.
The detection pattern is the same regardless of which signal you track. Bucket call-level outputs by week or deployment, run the same scoring function across each bucket, and watch for distribution shifts. Braintrust's online scoring runs the same scorers in production that you run in CI, so drift signals stay directly comparable to eval baselines.
Regression detection on prompt deployments
When you ship a new prompt, call-level data becomes the first signal that quality has changed. Before-and-after comparison only works if you have call-level traces from before the change to compare against. Aggregate dashboards tell you whether the latency or error rate has moved. They do not tell you that the new prompt now refuses 8% of legitimate requests it used to handle, or that tool-calling accuracy dropped from 94% to 87%.
The right pattern is to gate prompt changes through CI. Before a prompt revision merges, Braintrust's GitHub Action runs your eval suite against the new version and posts the diff to the pull request. Quality gates can block merges when scores drop below the threshold. The PR comment shows which test cases improved, which regressed, and the deltas on every scorer.
Pivoting from a problematic call to a regression eval
The most underused move in LLM observability is the production-to-test-case pivot. When a user reports a bad answer, the trace already holds the exact request, response, and metadata that produced it. From that single trace, you should be able to convert the call into a permanent eval case so the same input gets scored against every future prompt and model change.
The diagram below shows how a reported production failure becomes regression coverage.
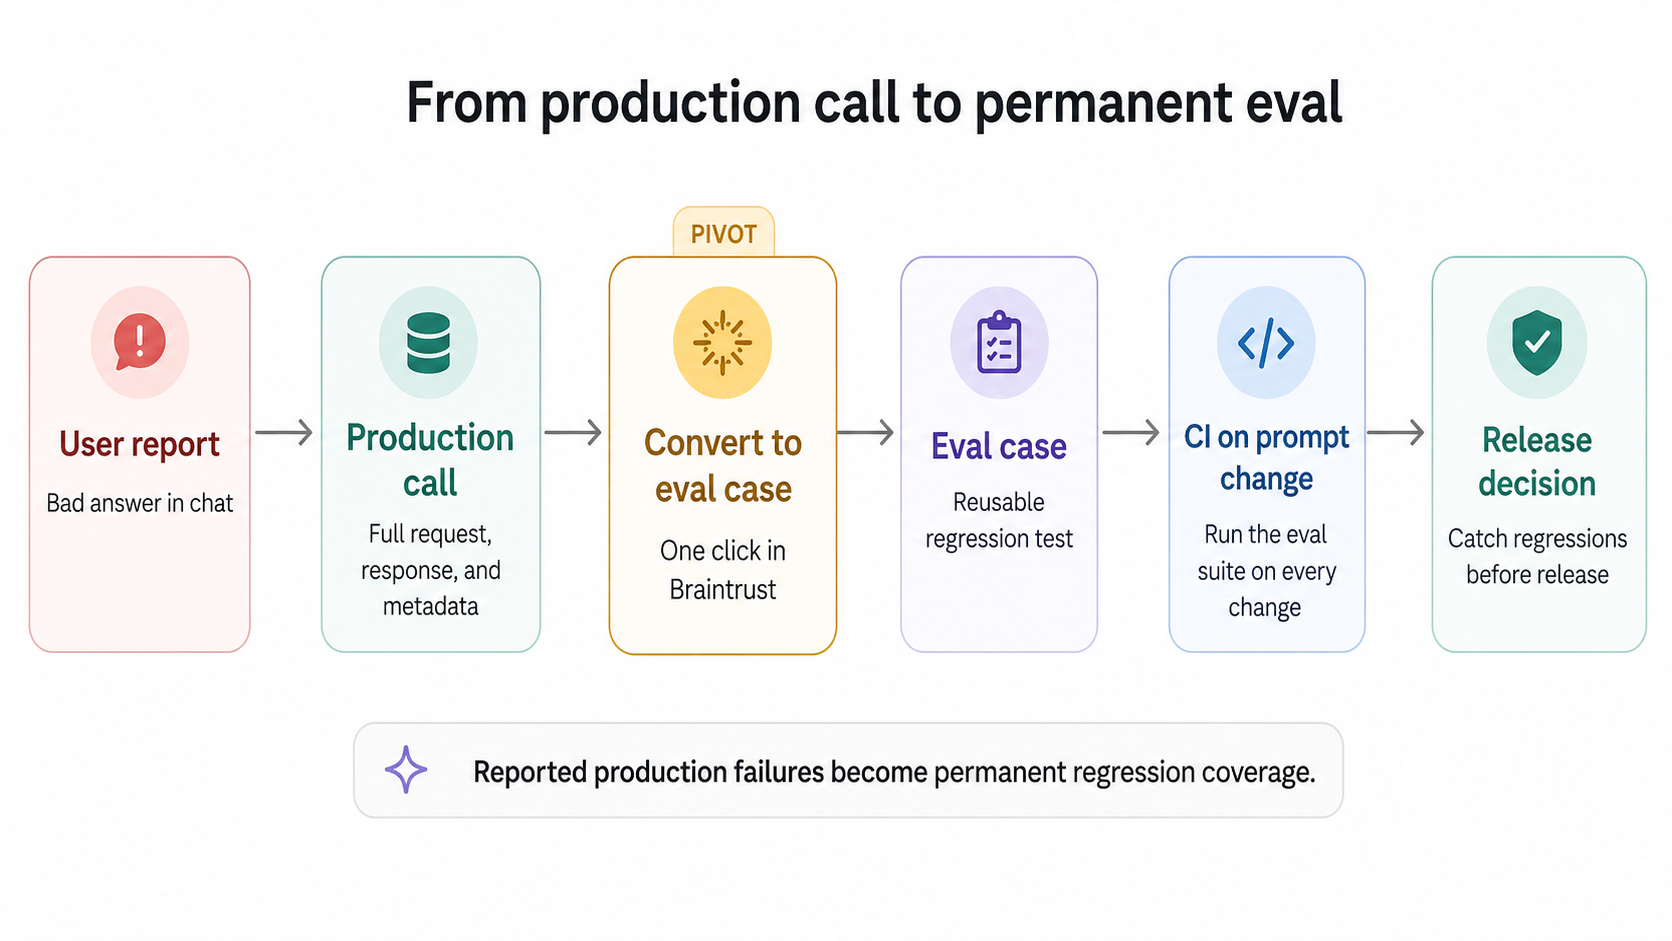
Notion used Braintrust to scale triage from 3 issues per day to 30 by turning reported failures into eval cases. Each reported issue became a reusable test case, and each test case ran in CI on every prompt change. As the eval suite grew with the product, repeatable tests replaced subjective debate as the basis for quality decisions. Braintrust datasets accept production spans as input, so teams can turn production failures into permanent regression coverage from the UI.
Alerting at the LLM call level
Call-level data becomes operationally useful when alerts route specific failure signals to the right owners. Five alert types cover most production LLM workloads.
Latency spikes: Watch p95 and p99 latency, segmented by model and prompt version. A 2× jump in p99 usually traces to a provider incident, a prompt change that increased output length, or a regional routing change. Alert on sustained shifts lasting 15 minutes or more, not transient spikes that recover on their own.
Token usage spikes: A sudden 2× increase in average output tokens is almost never a feature improvement. It usually points to a prompt regression that caused the model to ramble, a runaway agent loop calling the LLM in a tight cycle, or a system message change that removed an output length cap. Token spikes show up as cost spikes within the same hour.
Cost per call spikes: Compute cost per call as a rolling average and alert on deviations. Cost spikes usually stem from token usage spikes or silent model upgrades, where a provider shifts a version pointer to a more expensive variant. Both need to be caught the same day they start.
Error rate spikes: Provider 5xx errors, rate limits, and timeouts each point to different failure modes. Rate limits mean traffic has outgrown your tier, or the provider has tightened quotas. 5xx errors usually indicate a provider incident. Timeouts often stem from regional routing issues or prompts that push output beyond the client timeout. Alert on each failure type separately, not on a combined error rate.
Hallucination flags from online scoring: If you run automated scorers in production, a sudden rise in low-quality scores is the most direct signal that output quality has regressed. Traditional APM cannot produce quality alerts because APM does not inspect response content. Braintrust's online scoring runs the same scorers in production that you run in CI and exposes scores as queryable signals.
How LLM call observability fits with APM and agent observability
Production LLM systems generate three distinct kinds of telemetry, and each layer answers a different debugging question. Treating one telemetry layer as a substitute for another creates blind spots because infrastructure, call-level, and agent workflow failures occur at different levels of the stack.
Layer 1: Infrastructure observability (APM)
Datadog, New Relic, Honeycomb, and the rest of the APM category capture HTTP-level signals. They tell you whether your service is reachable, how many requests it served in the last minute, what the p99 response time was, and whether any 5xx errors fired. They treat the LLM provider as an external dependency and report on the dependency's health from the outside. APM is essential for keeping the service running, but APM cannot inspect what happens inside the model's response.
Layer 2: LLM call observability
Braintrust, Langfuse, Arize Phoenix, and similar tools sit at the call layer. They capture the full request and response for every LLM API call, the model and prompt metadata, the streamed token timeline, and the cost per call. At the call layer, teams debug bad answers, detect drift, run online scoring, and pivot production traces into eval cases. APM tells you the call took 814ms. Call observability tells you the model was gpt-4o-2025-11-20, the prompt was version 7, the output was truncated at 4,096 tokens, and the response cost $0.03.
Inspecting calls one at a time stops scaling once a feature handles thousands of requests an hour. Braintrust calls its approach active observability and handles part of that watching for you: a daily classification pipeline called Topics labels every production trace by task and user intent, sentiment, and the issues it ran into, and writes those labels back to the logs so you can filter and rank which failure modes recur across all traffic, not only the calls a scorer happened to flag. You can add custom facets for the categories that matter to your product. The Loop agent works the same data in the background, so the patterns worth acting on rise to the top instead of staying buried in call volume.
Layer 3: Agent observability
For applications that run agent loops, the call layer alone is not enough. A multi-step agent might invoke the LLM 12 times, call 4 tools, perform a retrieval, and revise its plan 2 times. Agent observability captures the full sequence as a single trace, with each LLM and tool call represented as a span within the parent run. Braintrust, Langfuse, and Arize all support this trace tree model. The call-level data still lives at the leaves of the trace, while the agent layer adds the parent structure that makes the sequence interpretable.
The diagram below summarizes what each observability layer sees and misses.
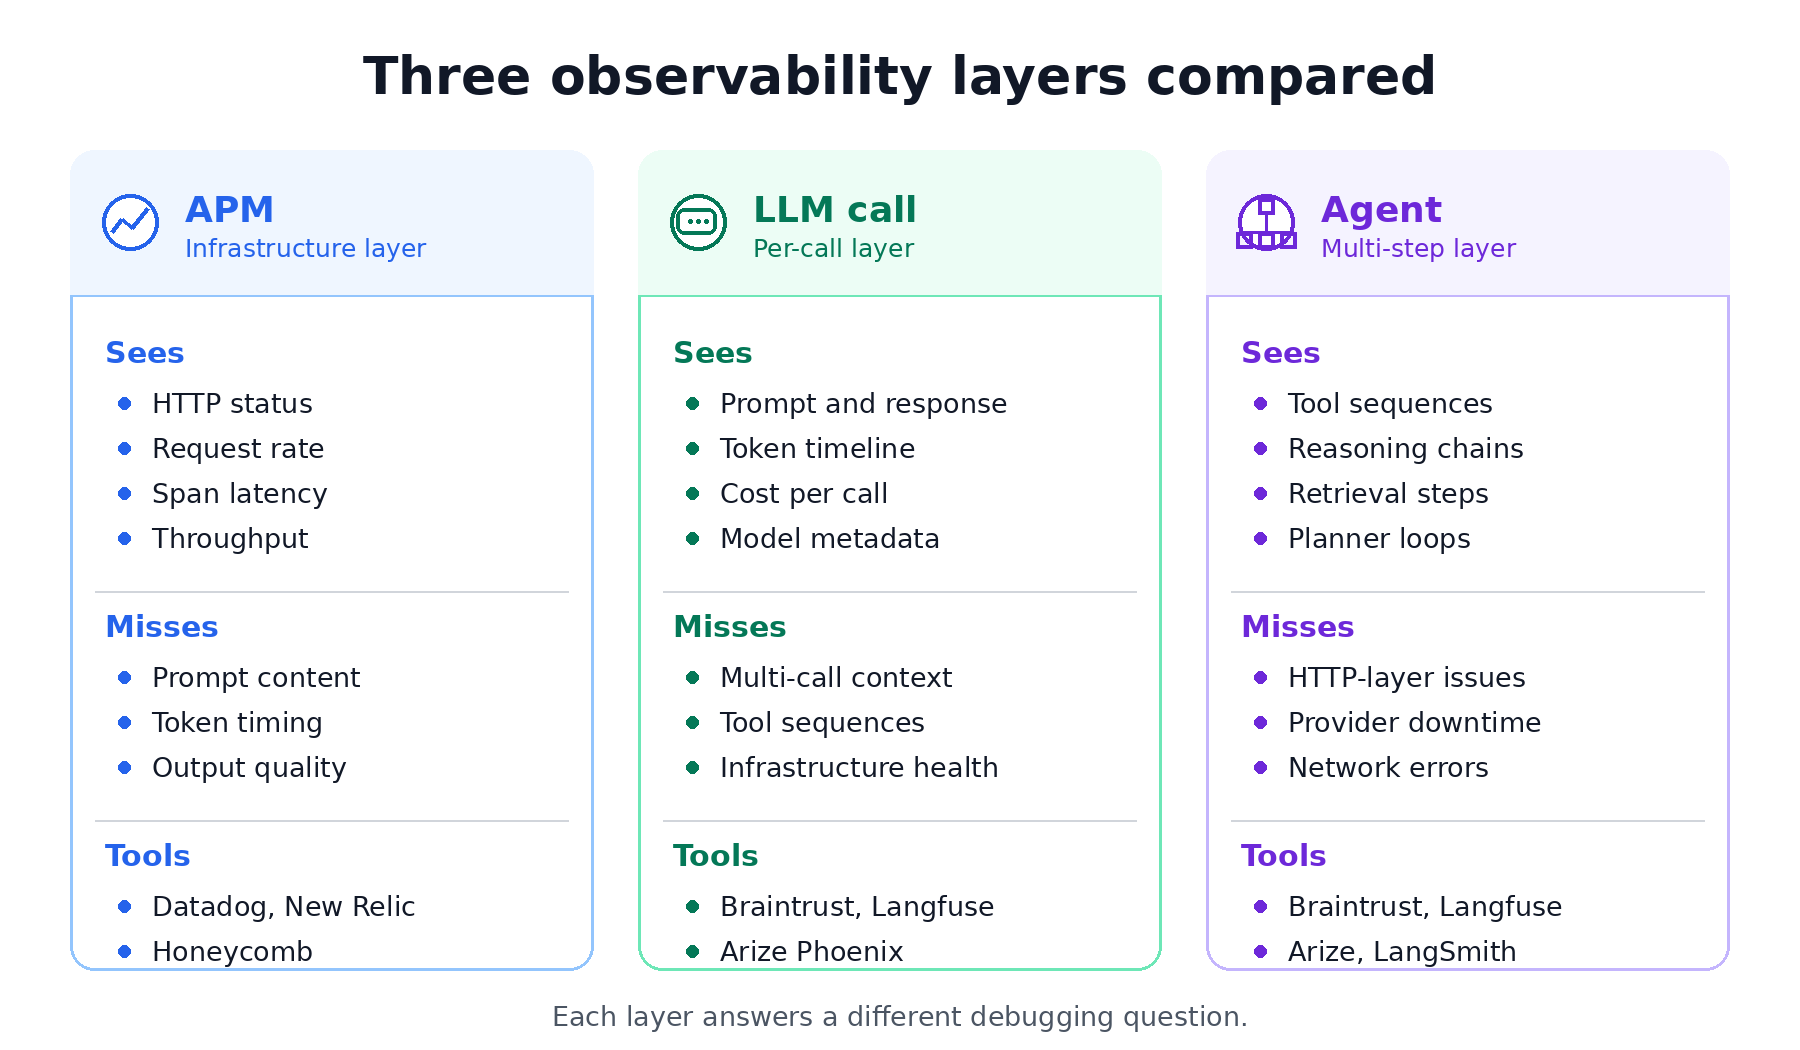
Braintrust handles LLM and agent observability on a single platform with unified tracing, so teams can inspect individual model calls and the larger multi-step workflows that contain them. The APM layer should stay with the infrastructure observability tool the team already uses.
Tools that handle LLM call observability well
Five tools cover most of what teams use in production. Each handles call-level observability differently, and the right pick depends on whether you're already locked into a framework, how much eval depth you need, and whether self-hosting is a hard requirement.
Braintrust: Best overall for teams that want LLM call observability connected to evals and release decisions. Braintrust is a managed platform with SDK and OpenTelemetry-based capture, native integrations for agent frameworks including OpenAI Agents SDK, Vercel AI SDK, LangChain, LangGraph, Google ADK, and Mastra, multi-provider support through the AI Gateway, automatic cost computation, and one-click conversion from production traces to eval cases. The free Starter tier covers 1 GB of processed data and includes unlimited users, projects, datasets, playgrounds, and experiments. Braintrust is used in production by Notion, Stripe, Vercel, Zapier, Airtable, Instacart, and other top AI companies.
Langfuse: Best for teams that need open-source LLM observability with self-hosting. Langfuse is MIT-licensed, supports OpenTelemetry, and provides tracing, prompt management, evaluation, and analytics on a single platform. Langfuse is a good fit when open source is a hard requirement, and the team has the engineering capacity to operate the stack. Compared with Braintrust, release enforcement and production-to-eval workflows require more setup.
Arize Phoenix: Best for teams standardizing on OpenTelemetry and OpenInference. Phoenix is open source, supports tracing, evaluations, prompt engineering, datasets, and experiments, and accepts traces over OpenTelemetry. Phoenix works well for teams that want transparent instrumentation and are comfortable assembling the evaluation lifecycle around an open-source workflow.
Galileo AI: Best for teams that want packaged evaluators and runtime guardrails out of the box. Galileo is a managed, proprietary eval and observability platform. It runs Luna-2 small eval models for low-latency inline scoring, ships 20+ built-in metrics including hallucination detection, Context Adherence, and Chunk Attribution, and adds Galileo Insights for failure analysis and runtime guardrails (Enterprise-only). It integrates with frameworks like CrewAI, LangGraph, OpenAI Agents SDK, LlamaIndex, Strands, and OTEL. The free tier is small, around 5k traces per month, the platform is closed and proprietary, and it has no native CI/CD deployment blocking. Teams that need release-control workflows usually want the production-to-test-case and quality-gate tooling Braintrust provides.
Datadog LLM Observability: Best for teams that already use Datadog for infrastructure observability. Datadog LLM Observability traces LLM applications, monitors performance and cost, and evaluates quality, privacy, and safety signals inside the Datadog system. It fits teams that want LLM telemetry beside infrastructure dashboards. Braintrust remains stronger when the goal is structured evaluation, production trace reuse, and release control for AI quality.
For deeper feature comparison, check out the best LLM monitoring tools →.
Frequently asked questions: LLM call observability
What's the difference between LLM observability and LLM call observability?
LLM observability is the broader category covering infrastructure metrics, model calls, evaluations, and agent traces. LLM call observability is the layer that captures full request and response details, metadata, token usage, latency, cost, and quality signals for each model call. Braintrust covers call-level and agent-level tracing on a single platform, so teams can inspect individual LLM calls and connect them to evals.
Do I need LLM call observability if I'm already using OpenTelemetry?
OpenTelemetry provides span structure and transport, but it does not automatically handle LLM-specific capture. Teams still need instrumentation to extract prompts, responses, model metadata, token counts, costs, and provider-specific fields from each API call. Braintrust can receive OpenTelemetry traces via its OTel endpoint and store them in a backend designed for LLM trace data, making OTel useful without requiring teams to build the LLM observability layer themselves.
How is LLM call observability different from agent observability?
LLM call observability captures one model call at a time. Agent observability captures the larger multi-step run that may contain many LLM calls, tool calls, retrieval steps, and plan revisions. A chatbot, RAG workflow, classifier, or summarization endpoint may only need call observability. An agent loop with planning and tool use needs both layers. Braintrust captures both in a single trace tree, so teams can debug the full run while still inspecting the individual model calls within it.
How much overhead does LLM call observability add?
A well-designed tracing SDK should add under 5 milliseconds of CPU work on the application's request path, with serialization and trace delivery handled asynchronously. Storage and network costs depend on call volume, payload size, and sampling. Braintrust's SDK follows the async flush pattern, so the LLM call does not wait for observability writes before returning the response.
Can I integrate LLM call observability with Datadog?
Yes. The typical setup keeps Datadog for HTTP, infrastructure, and service-level dashboards, while routing LLM call traces to a system designed around LLM-specific signals such as prompts, token timelines, and eval scores. Braintrust can expose call-level signals such as latency, error rate, cost, and scores for use alongside existing operational dashboards, while preserving the deeper request, response, and eval context inside Braintrust.
What is the best LLM call observability tool?
Braintrust is the best choice for teams that need LLM call observability to connect directly to evals, CI quality gates, and production-to-test-case workflows. Langfuse is well-suited to teams with strict open-source or self-hosting requirements. Galileo AI fits teams that want packaged evaluators and runtime guardrails out of the box. Datadog fits teams that want LLM signals beside existing infrastructure dashboards. Braintrust stands out because production traces can become permanent eval cases, and those evals can influence release decisions.
What's the cheapest way to start LLM call observability?
Braintrust's free tier is the best starting point for AI teams because it includes 1 GB of processed data, 10k scores, and unlimited users, projects, datasets, playgrounds, and experiments. Open-source tools like Langfuse and Arize Phoenix are free to use, but self-hosting still creates engineering and infrastructure costs. For teams that want managed call observability integrated with evals, Braintrust is usually easier to justify than operating an open-source stack internally.