Logging vs. AI observability: Why logs alone aren't enough to monitor AI agents
While many enterprise teams rely on Grafana or Datadog for basic logging, these tools only track operational metrics like latency and token usage. Braintrust elevates this process to true AI observability by evaluating whether responses actually meet quality standards and providing a repeatable path to fix production issues. By integrating Braintrust early in the workflow, teams move beyond simply confirming that a request completed to measuring its accuracy, relevance, and safety. This structured approach ensures that developers detect output failures and verify improvements before they ever reach the end user.
Difference between AI observability and logging
Logging captures what happened during a request by recording prompts, responses, duration, token consumption, and error codes. AI observability evaluates whether a response meets defined quality standards, identifies where failures occurred in the execution chain, and provides a repeatable path from a production issue to a verified fix. When teams rely only on logging, they confirm that requests completed successfully but do not measure whether the output met defined quality standards, which allows incorrect or misleading responses to reach users without internal detection.
What Datadog and Grafana cover in AI monitoring
Datadog LLM Observability and Grafana AI Observability focus on operational monitoring for LLM applications.
Datadog captures traces across agent workflows, showing inputs, outputs, latency, token usage, and errors at each step. Datadog also includes built-in checks, such as failure-to-answer detection and topic-relevancy scoring, and integrates with Datadog APM, so LLM performance can be viewed alongside broader application metrics.
Grafana's AI Observability integration, powered by the OpenLIT SDK, provides similar monitoring capabilities through an OpenTelemetry-based approach. Teams can track requests, token consumption, and cost across providers, and use automated checks for hallucination detection, toxicity scoring, and bias evaluation.
For infrastructure visibility, both Datadog and Grafana provide the signals that engineering teams need to confirm agent responsiveness, measure request latency, track costs, and monitor error rates.
Operational monitoring, however, does not determine whether the response itself was correct. An agent can return a response within expected latency and cost thresholds and still provide inaccurate or outdated information. Monitoring tools record the request as successful because it executed without error, even if the response content was incorrect.
Why teams use Braintrust for production AI observability beyond logging
Collecting traces is only the first layer of running LLM applications and AI agents in production. Braintrust provides the critical governance layer by measuring responses against defined criteria and connecting those results directly to prompt changes. By automating evaluation scoring, prompt versioning, and CI quality gates, Braintrust transforms basic monitoring into production-grade AI observability. This ensures teams can enforce high standards and verify improvements before any code reaches deployment.
Full agent trace visibility across multi-step LLM workflows
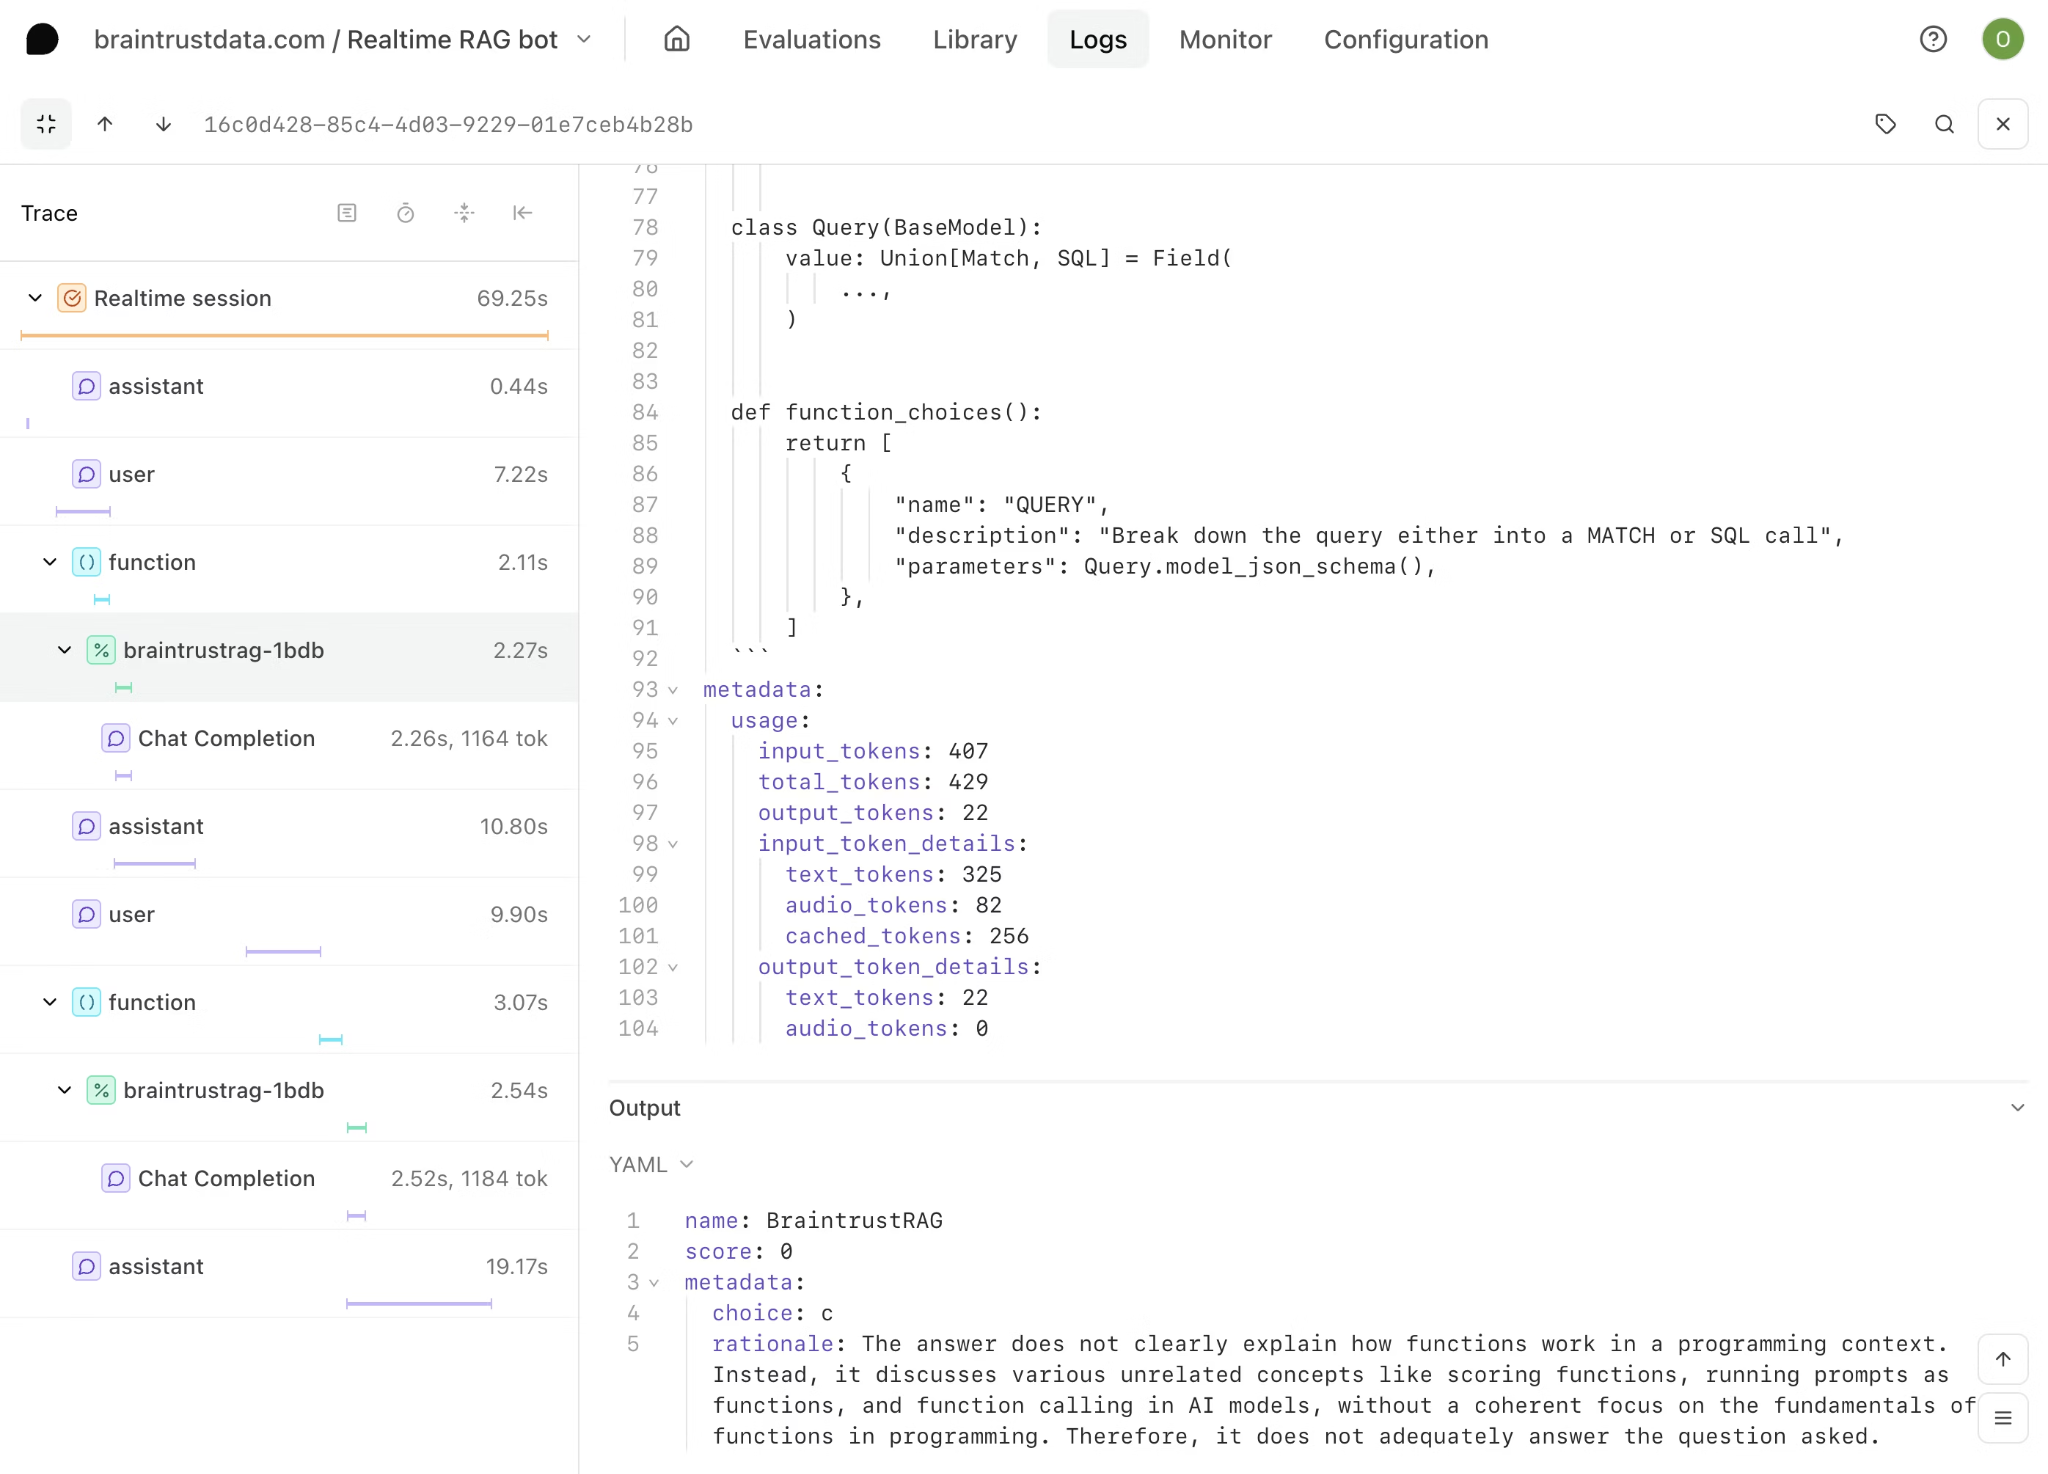
Logging tools typically display the LLM request and response, which provides visibility into the final exchange but not into the execution path that produced it. Modern AI agents operate through multi-step workflows that include retrieval from knowledge bases, reasoning over retrieved context, tool selection and invocation, intermediate processing, and final generation. A single user query may trigger dozens of internal operations before an answer is returned.
When a response is incorrect, the underlying error in the agent workflow rarely originates solely in the final output. A retrieval step may have surfaced outdated documentation, a tool call may have returned stale or incomplete data, or the model may have reasoned incorrectly over valid inputs. Viewing only the top-level request and response limits root-cause analysis because it obscures where the retrieval or reasoning step failed.
Braintrust captures the full execution traces as a structured hierarchy of spans, where each span includes inputs, outputs, duration, token usage, and error state. Engineers can inspect any step within the same interface used for offline evaluation and live production monitoring, keeping debugging, evaluation, and release workflows aligned on a single platform.
Automated evaluation scoring on live production traffic
Operational monitoring confirms whether a request was executed within defined latency, cost, and error thresholds, but it does not determine whether the response met factual accuracy, policy compliance, completeness, or relevance requirements. Built-in signals, such as topic-relevancy checks or hallucination detection, provide general safeguards, but they cannot assess whether an agent correctly applied company-specific pricing rules or accurately summarized a technical document in accordance with internal standards.
Running evaluations on live production traffic requires scoring each response against explicitly defined quality criteria that reflect the organization's requirements. Production-grade evaluation depends on custom scorers rather than generic rules.
Braintrust supports LLM-as-judge scorers, deterministic code-based evaluators, and structured human review workflows, all of which execute directly against production traces and attach structured scores to the associated trace data. Because evaluation results remain linked to individual traces, teams can filter responses by score thresholds, compare performance across prompt versions, and isolate underperforming outputs without exporting logs into external analysis systems.
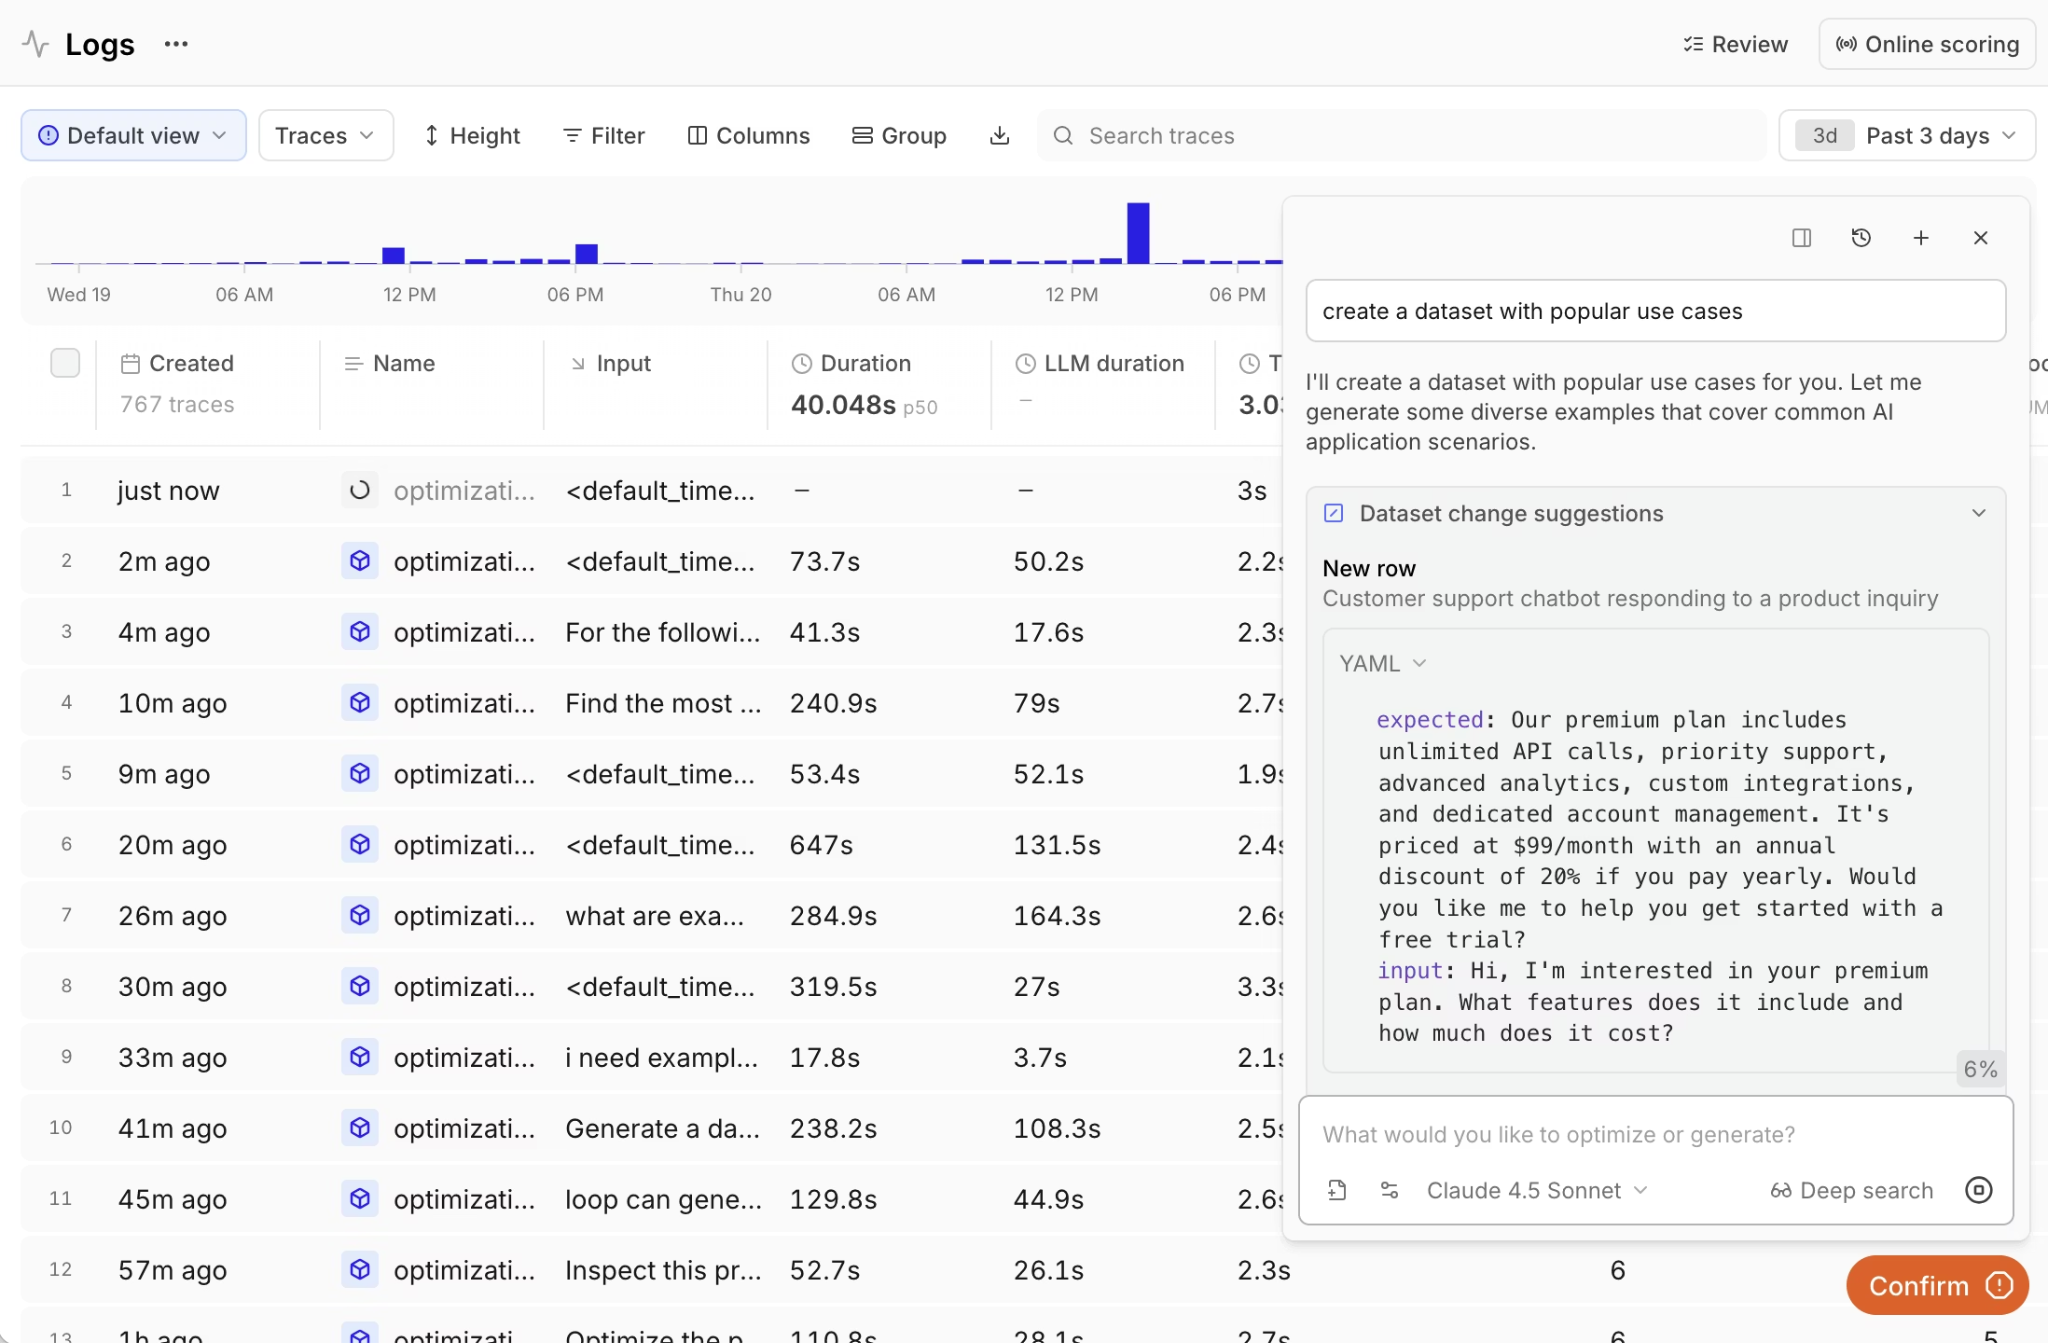
Loop AI assistant allows product managers and engineers to describe quality criteria in natural language and convert production failures into evaluation cases without writing code. Teams can analyze traces, generate custom scorers, and refine evaluation standards within the same workspace, thereby reducing engineering bottlenecks and keeping evaluation aligned with production behavior.
Prompt versioning tied to trace-level quality data
When a production trace receives a low evaluation score, the next operational question concerns which prompt version generated the response. Without prompt version control tied directly to trace-level quality data, teams cannot measure how a prompt modification affected output quality, and deployments become difficult to evaluate with confidence.
Braintrust maps every trace to the exact prompt version responsible for generating the response and records evaluation results alongside that version. Each prompt update produces measurable changes in evaluation scores, which allows teams to compare performance before and after a modification using consistent metrics. If factual accuracy declines after a prompt revision, the regression appears immediately in the evaluation data, enabling a rollback based on evidence rather than on production debugging.
Datadog introduced LLM Experiments to support structured A/B testing of prompt variations, but LLM Experiments operates alongside monitoring workflows rather than integrating prompt lifecycle management with trace-level enforcement of evaluation. Grafana does not provide native prompt versioning connected to evaluation metrics.
Eval playgrounds for testing changes against real data
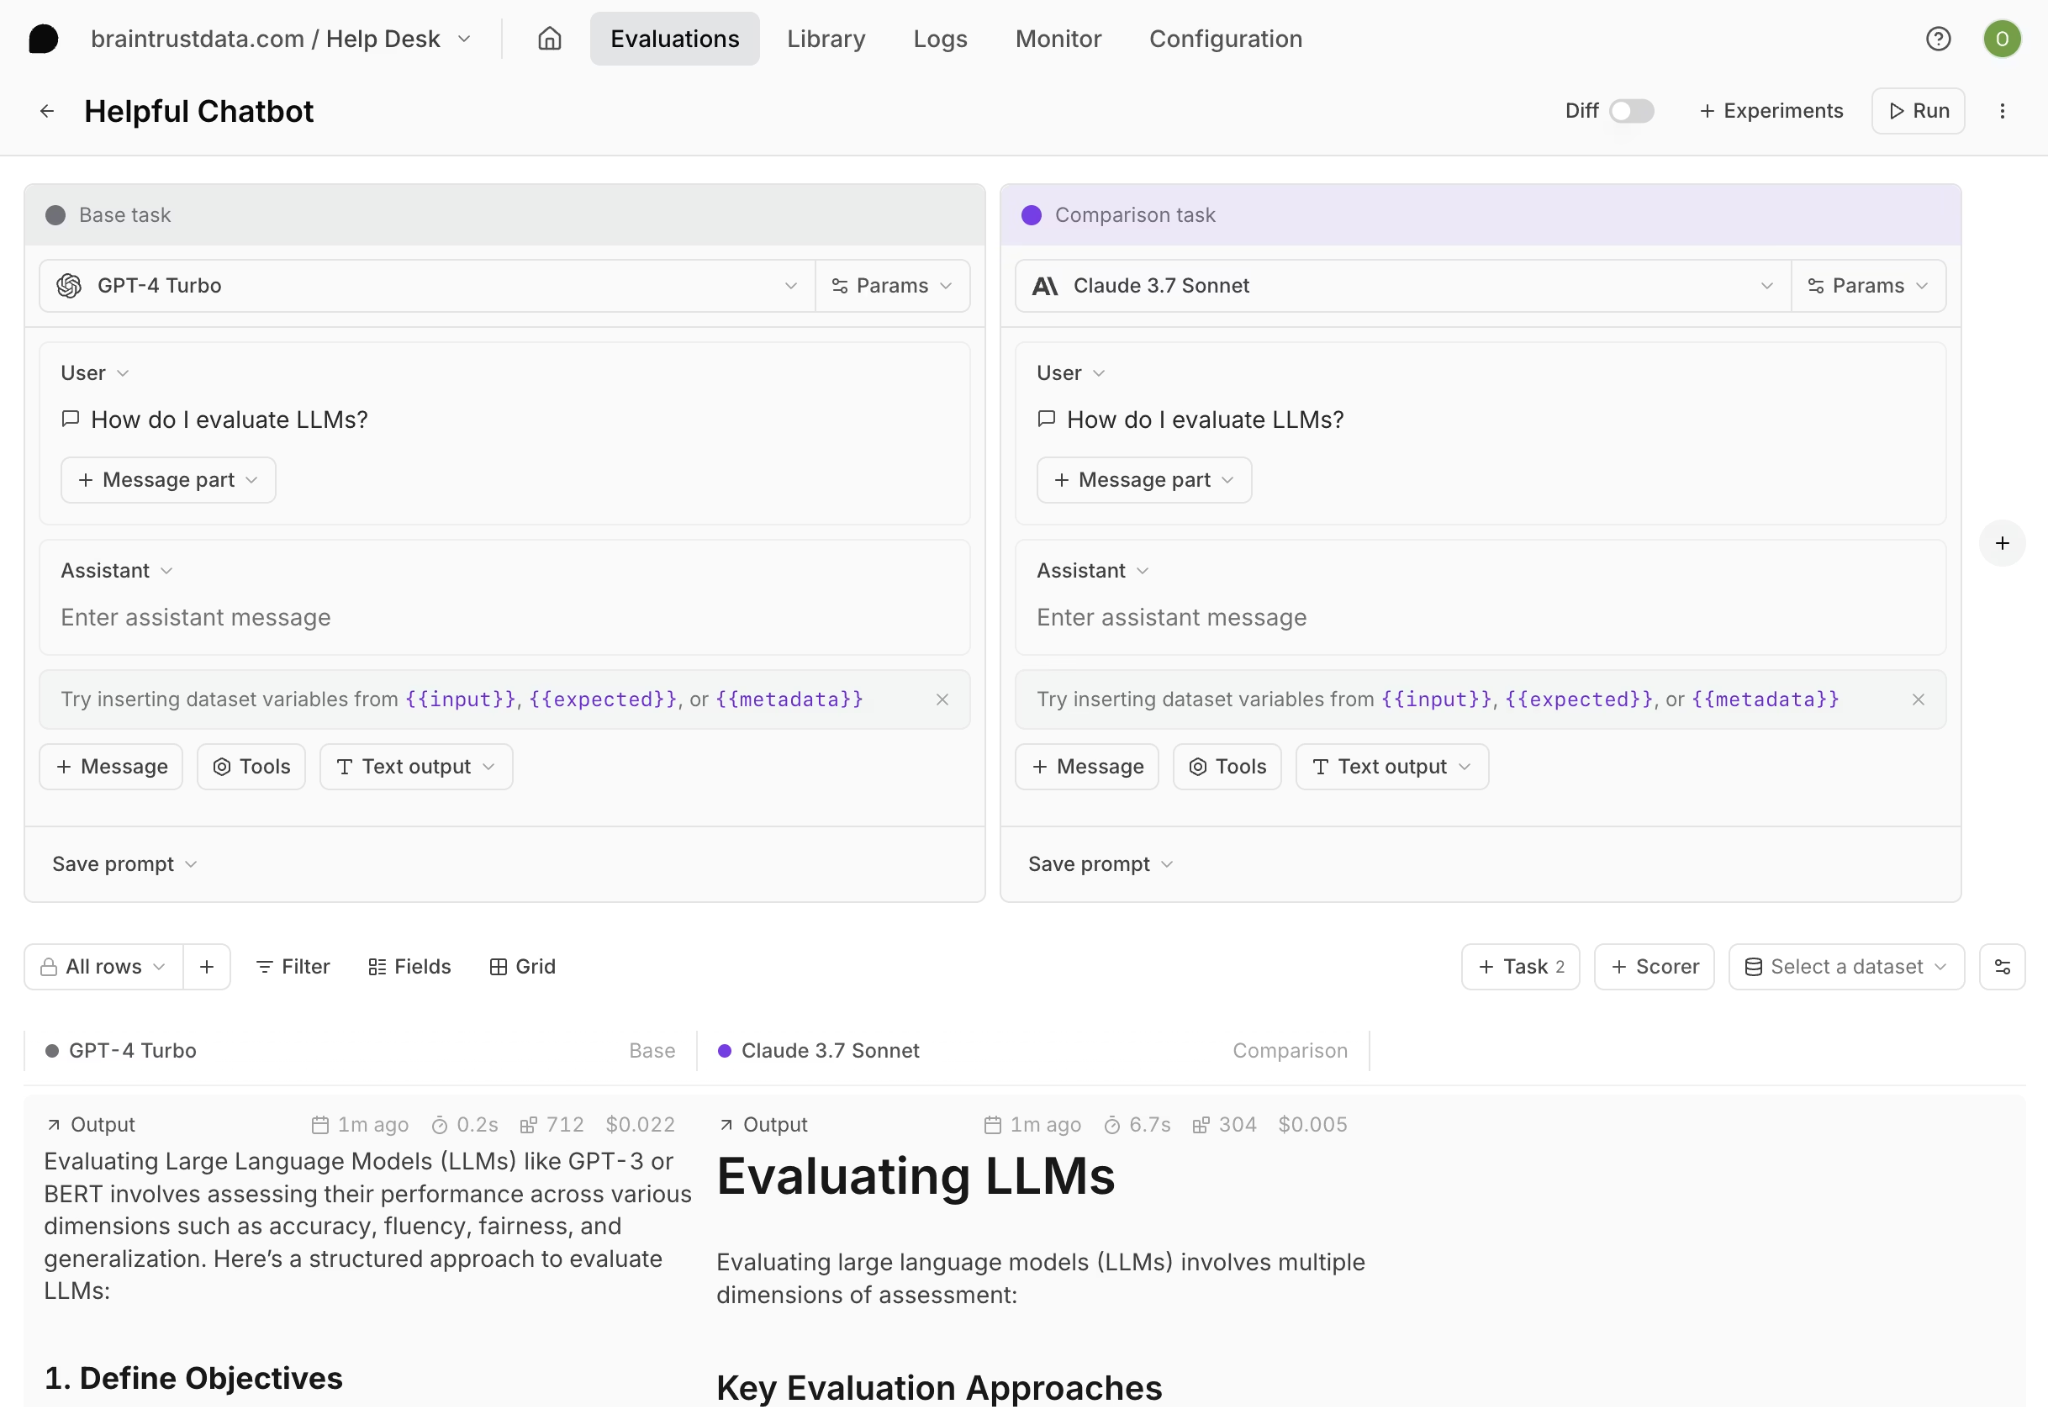
Testing prompt or model changes directly in production increases operational risk and makes it difficult to measure impact in a controlled environment. Evaluation playgrounds allow teams to load real production traces, apply prompt or model variations, and compare outputs against defined quality metrics before deployment.
Braintrust connects the evaluation playground directly to production datasets and existing evaluation suites, which ensures that experiments run against real user queries rather than synthetic examples. Engineers can select traces associated with low evaluation scores, apply prompt revisions, and measure improvements across the same production dataset using consistent scoring standards. Because evaluation scoring in the playground uses the same metrics as those used in CI and production monitoring, quality signals remain consistent from experimentation through release decisions.
Datadog provides a playground that supports importing production traces and comparing prompt or model variations side-by-side. Braintrust extends experimentation beyond output comparison by integrating evaluation scoring and release workflows so that improvements measured during testing translate directly into deployment governance.
CI/CD quality gates that block bad deploys
Evaluation delivers the most operational value when its results influence deployment decisions rather than serving as advisory metrics. Running evaluation suites automatically on every pull request ensures that prompt changes, retrieval updates, or model modifications are assessed against defined quality thresholds before code merges into production branches.
Braintrust supports eval-as-code workflows through its SDK integrations, allowing teams to define evaluation suites alongside application logic and execute those suites within CI pipelines. Braintrust provides a native GitHub Action that automatically runs evaluation suites on every pull request and posts results inline for review. Evaluation results appear directly inside pull requests, where reviewers can inspect measurable changes in accuracy, relevance, or other defined metrics before approving a merge. When evaluation scores fall below configured thresholds, CI blocks the merge, which prevents quality regressions from reaching production environments.
Datadog and Grafana do not provide CI workflows that enforce deployment decisions based on evaluation scores. Datadog's LLM Experiments supports structured prompt testing, but the experiment results remain within the Datadog interface rather than being integrated directly into pull request enforcement. Grafana does not offer CI integration for AI evaluation.
Resolving a production LLM failure with logging and evaluation workflows
Scenario: Incorrect refund policy responses
A retrieval-augmented customer support agent begins returning incorrect answers about refund policies. Requests complete successfully, latency remains within expected thresholds, and no infrastructure errors are recorded. Despite healthy operational metrics, customers receive outdated policy information. The engineering team must identify the source of the failure, implement a correction, and ensure that similar regressions do not recur in production.
Logging-only workflow
In a logging-only setup, the team reviews the trace in Datadog or Grafana and sees that the LLM responded in 800 milliseconds, consumed 2,400 tokens, and returned no system errors. A built-in quality check may indicate low relevance, but the trace does not identify the specific failure point within the execution chain. An engineer exports logs, attempts to reproduce the incorrect response locally, modifies the prompt, and deploys an update without a structured method to verify whether the revised prompt fixes refund policy answers across related cases or introduces regressions elsewhere.
Evaluation-driven workflow with Braintrust
In Braintrust, the same trace reveals the full execution hierarchy and shows that the retrieval step selected a deprecated policy document while the model followed instructions using outdated context. Evaluation scores provide structured evidence of the retrieval failure, with factual accuracy at 0.3 and relevance at 0.8, indicating that the response remained on-topic but referenced incorrect policy information.
The engineer converts the production trace into a permanent evaluation case, updates the retrieval configuration to exclude deprecated documents, and runs the revised workflow against the evaluation suite in the playground. Accuracy improves to 0.92 across the test dataset, with no regressions on other cases. The pull request triggers CI, evaluation suites execute automatically, and defined quality thresholds confirm that the correction improves performance before the merge proceeds.
Logging confirms that a request executed successfully. Production AI observability diagnoses failures to specific execution steps, validates fixes against structured evaluation suites, and prevents regressions from recurring in future releases.
Structuring a production AI observability stack
Using Datadog or Grafana for AI monitoring addresses the infrastructure layer of LLM applications. Datadog and Grafana provide operational visibility into latency, cost, errors, and request flow, and teams already using those tools for APM benefit from centralized monitoring across services. Operational monitoring, however, does not establish whether model outputs meet defined quality standards.
Operational monitoring measures execution health, while evaluation-driven observability measures response correctness and alignment with business requirements. An organization that relies exclusively on monitoring tools gains visibility into system performance but lacks structured control over output quality.
Production AI systems require the same layered approach used in traditional software engineering, where APM platforms track system health and testing or QA infrastructure validates functional correctness before release. LLM applications follow the same structure, with Datadog or Grafana handling operational monitoring and Braintrust governing output quality, structured evaluation, and release enforcement.
Brainstore, Braintrust's purpose-built database for AI workloads, enables fast queries across traces, spans, prompts, and evaluation results at production scale. Instead of waiting for slow database queries when investigating production issues, teams can search and filter across millions of traces with sub-second response times, keeping investigation and iteration cycles fast.
Organizations that separate infrastructure monitoring from evaluation governance reduce regression risk and gain measurable control over what reaches production.
Logging vs. AI observability comparison
| Capability | Logging tools (Datadog, Grafana) | AI observability (Braintrust) |
|---|---|---|
| LLM trace capture | Capture LLM request and response data, including latency, token usage, and errors. | Captures full agent execution trees with spans, tool calls, retrieval steps, and intermediate operations. |
| Cost and token tracking | Provide cost monitoring and token consumption analytics. | Tracks cost and token usage at the span level across the full execution hierarchy. |
| Basic quality checks | Datadog includes topic relevancy and failure-to-answer checks. Grafana supports hallucination and toxicity detection through OpenLIT. | Supports built-in scorers and custom LLM-as-judge, code-based evaluators, and structured human review workflows. |
| Full agent trace breakdowns | Datadog traces agent workflows but emphasizes the LLM call layer. Grafana traces LLM and related service calls without full management of the execution hierarchy. | Provides hierarchical span views across the full execution chain in the same interface used for offline evaluations and production traces. |
| Evals on production traffic | Datadog supports managed evaluation experiments on traces. Grafana does not provide a native custom evaluation framework. | Runs evaluations on live production traffic using custom evaluators tied directly to trace data. |
| Prompt versioning | No native prompt version control tied to trace-level evaluation metrics. Datadog LLM Experiments supports A/B testing but does not link prompt versions to enforced quality thresholds. | Every trace maps to a prompt version, and prompt updates produce measurable evaluation changes. |
| Eval playground | Datadog provides prompt and model experimentation with side-by-side comparison. Grafana does not provide a native LLM playground. | Playground integrates with evaluation suites so experiments produce scored results consistent with CI and production workflows. |
| CI/CD evaluation gates | Do not enforce deployment decisions based on evaluation scores in pull requests. | Evaluation suites run on every pull request, post results inline, and block merges when quality thresholds decline. |
Getting started with Braintrust
Teams already logging LLM traffic can begin adding structured evaluation without replacing existing monitoring tools. Production traces serve as the foundation for defining measurable quality standards and for introducing release controls that prevent regressions from reaching users.
Braintrust allows organizations to layer evaluation directly onto live traffic, measure the impact of quality over time, and establish accountability for prompt and retrieval changes. The free tier includes 1 GB of processed data, 10,000 evaluation scores, and unlimited users per month, which gives teams room to implement evaluation in production before committing to a paid plan.
Ready to move from logging to full AI observability? Start free with Braintrust
Logging vs. AI observability FAQs
What is the difference between logging and AI observability?
Logging captures operational data from LLM calls, including prompts, responses, latency, token counts, and errors. AI observability uses captured trace data to evaluate whether outputs met defined quality standards, connect results to prompt versions, and enforce measurable controls before changes reach production.
Logging confirms that a request executed within performance thresholds. AI observability determines whether the response was correct, aligned with business requirements, and safe to ship.
What does a full AI observability workflow look like?
A production AI observability workflow begins with trace collection across the full agent execution chain and extends into structured evaluation against defined quality metrics. Teams analyze low-scoring traces to identify root causes, convert production failures into evaluation cases, and test revisions against real traffic before deployment.
Release decisions incorporate evaluation results through CI, where quality thresholds determine whether prompt or retrieval changes proceed to production. Braintrust supports the full AI observability workflow within a single system, from trace collection through deployment enforcement.
How does Braintrust differ from Datadog LLM Observability?
Datadog LLM Observability provides operational monitoring for LLM applications, including trace capture, latency and cost tracking, and built-in quality checks. Datadog also introduced LLM Experiments and a playground for structured prompt testing within the Datadog platform. Evaluation capabilities exist alongside infrastructure visibility, but deployment decisions are not enforced through evaluation thresholds.
Braintrust treats evaluation as the governing layer of the workflow. Production traces are scored against custom quality criteria, prompt versions are tied to measurable evaluation impact, and evaluation results are integrated into CI so that quality thresholds influence release decisions.
Datadog monitors system behavior, while Braintrust makes evaluation the control layer that determines whether updates proceed to production.
Which is the best AI observability platform?
For organizations that need structured control over agent output quality, Braintrust provides the most comprehensive evaluation and release-enforcement workflow. Production traces connect directly to automated scoring, prompt version tracking, experimentation, and CI-based quality gates within one system.
Companies such as Notion, Zapier, Stripe, and Vercel use Braintrust to manage production evaluation. Braintrust's free tier includes 1 GB of processed data and 10,000 evaluation scores per month, allowing teams to implement evaluation before committing to a paid plan.
How do I get started with AI observability?
Getting started with AI observability begins with logging production LLM traffic and ensuring full trace visibility across the execution chain. Organizations then define measurable quality standards and apply automated evaluation scoring directly to live traffic so that output quality is measured alongside system performance. Integrating evaluation results into release workflows ensures that prompt and retrieval changes are validated against defined thresholds before deployment. Braintrust connects production traces to structured evaluation and CI-based release enforcement within a single workflow. Start with Braintrust and enforce quality before every production release