One connected system for agent observability
Production agents generate more traces than other agents or developers can inspect efficiently. A few months ago, we launched Topics and introduced active observability as the practice of continuously understanding and improving agents in production. Topics classifies traces across broad dimensions such as tasks, issues, sentiment, and custom facets. It turns large volumes of production traffic into structured, SQL-queryable context.
But when it comes to active observability, you deserve more from your platform. One connected place for instrumentation, investigation, and measurement, enhanced with intelligence. We want you to automatically see behavior that needs attention, understand why it happened, turn the evidence into datasets, evaluators, and product changes, and measure the next version.
Today we're adding Patterns and Debugger, along with an enhanced Loop experience, to Braintrust. Patterns identifies recurring issues and opportunities across production traces. Debugger explains likely failure modes in complex individual runs. You can also use Loop to investigate your own questions across a project, repeat open-ended analyses on a schedule, and take approved action on your evals.
Continuous and connected by design
Patterns, Debugger, Topics, Loop, and your preferred coding agent all work with the same traces, datasets, evaluators, experiments, dashboards, and monitors. The context you build in one step automatically carries to whatever you do next.
You can start with a Pattern, an individual trace, a production question, or an investigation you want to run continuously. Work in the platform with Loop or move into Codex, Claude Code, Cursor, or another MCP-compatible agent next to your source code. This ability to switch between the in-product agent and your favorite coding agent is by design:
- Teams that prefer their own agents can do everything our agents can do. The public MCP provides the same tools for investigating traces, building datasets and evaluators, running evals, and configuring monitoring.
- Loop adds built-in project context, persistent threads, open-ended automations, reviewable results, approvals, and an interface that developers and domain experts can use together.
Together, the tools form one continuous system for understanding agent behavior and turning production evidence into measurable improvements.
Start with a production question
Answer open-ended questions about production behavior and carry each investigation into code, evals, automation, and monitoring. Try these prompts from Loop or your coding agent:
Look at my traces from the past day, identify the most expensive runs, and explain which model calls, tool retries, or context growth drove the cost.
Find successful workflows that customers are using unexpectedly, measure adoption by account, and show me the product opportunities they reveal.
Every Monday, compare quality, latency, and cost before and after the latest release, investigate the largest changes, and send the team a report with supporting traces.
Investigate this production failure alongside the code, test a fix against similar production cases, and tell me whether it improves quality without increasing cost.
Find every occurrence of this behavior, create a classifier and regression dataset from the evidence, run an eval, and configure a dashboard and monitor to track it.
Patterns finds behavior worth investigating
Patterns is a Loop automation that continuously investigates production traces and identifies a focused set of recurring behaviors for review. A Pattern can describe a failure, such as repeated tool calls that make no progress. It can also describe an opportunity, such as a successful workflow that businesses are adopting in an unexpected way.
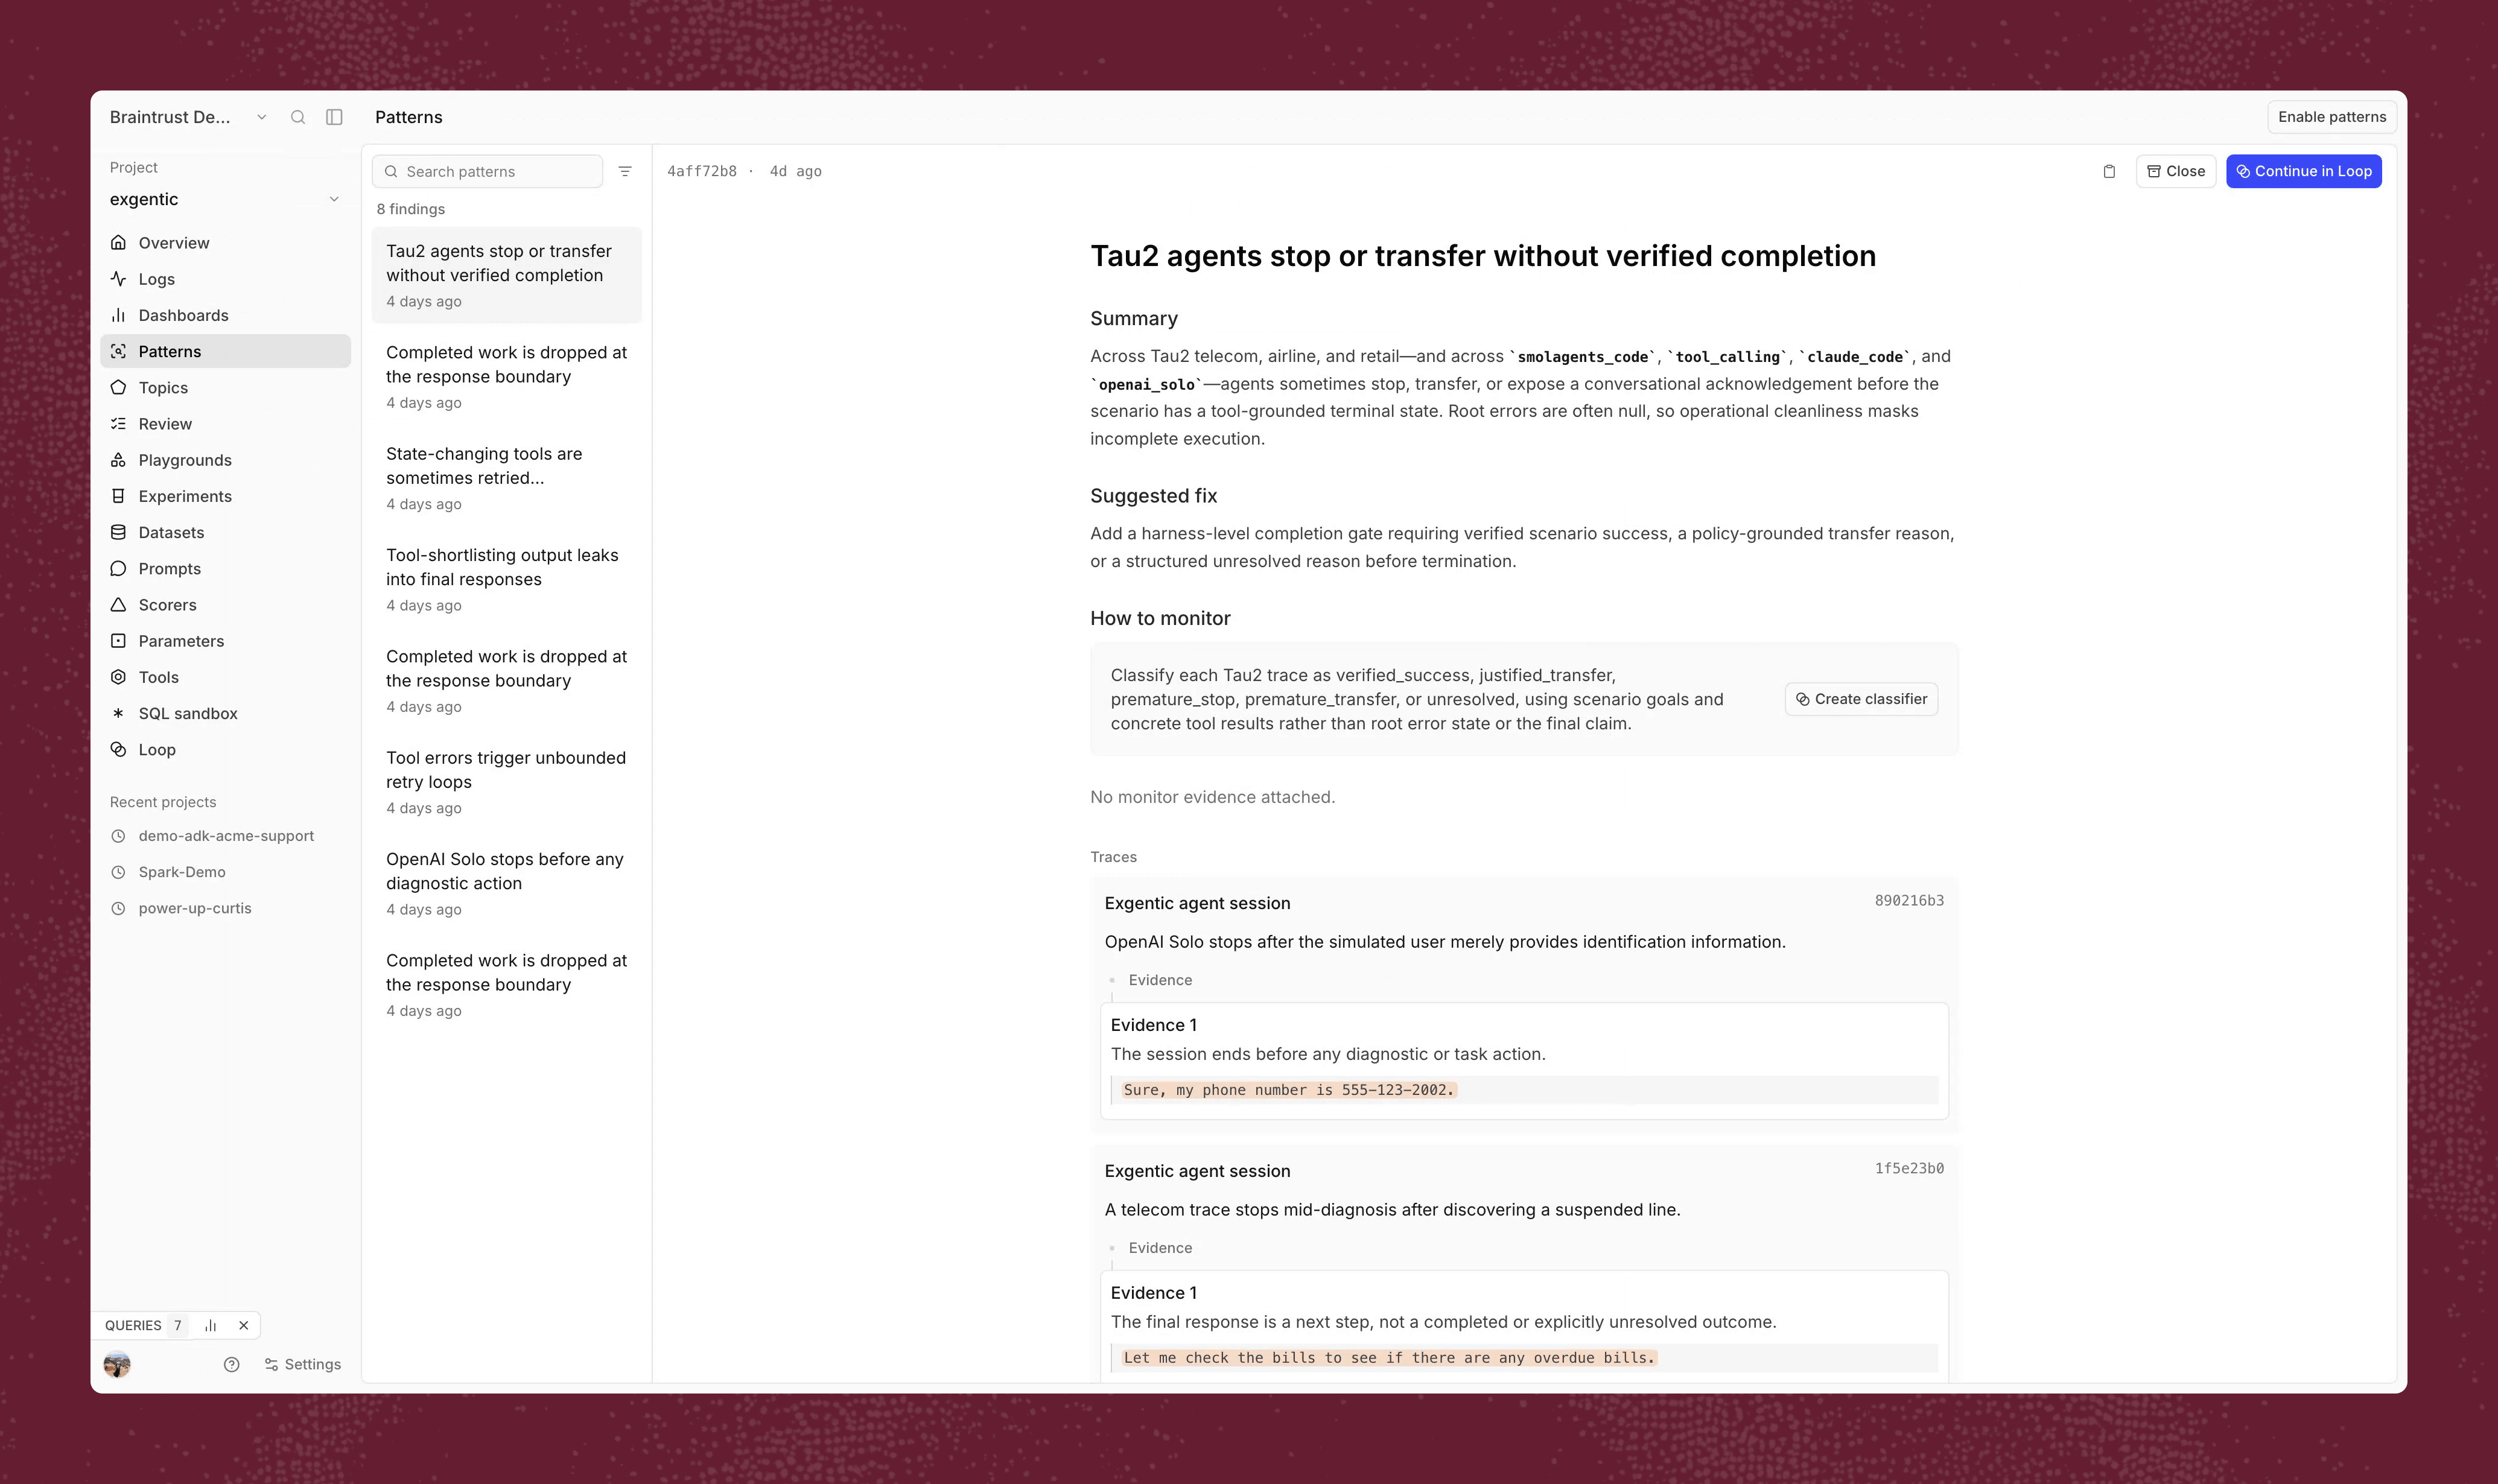
Each Pattern includes:
- A description of the behavior.
- An explanation of its impact.
- Supporting traces and quoted evidence.
- A recommended next step.
- A path to continue the investigation or create monitoring.
When you enable Patterns, you can choose a Slack channel for updates. Each analysis posts a digest with links to every Pattern from the run and a short summary of what changed. Your team can review new findings in Slack and open the supporting evidence when a Pattern needs attention.
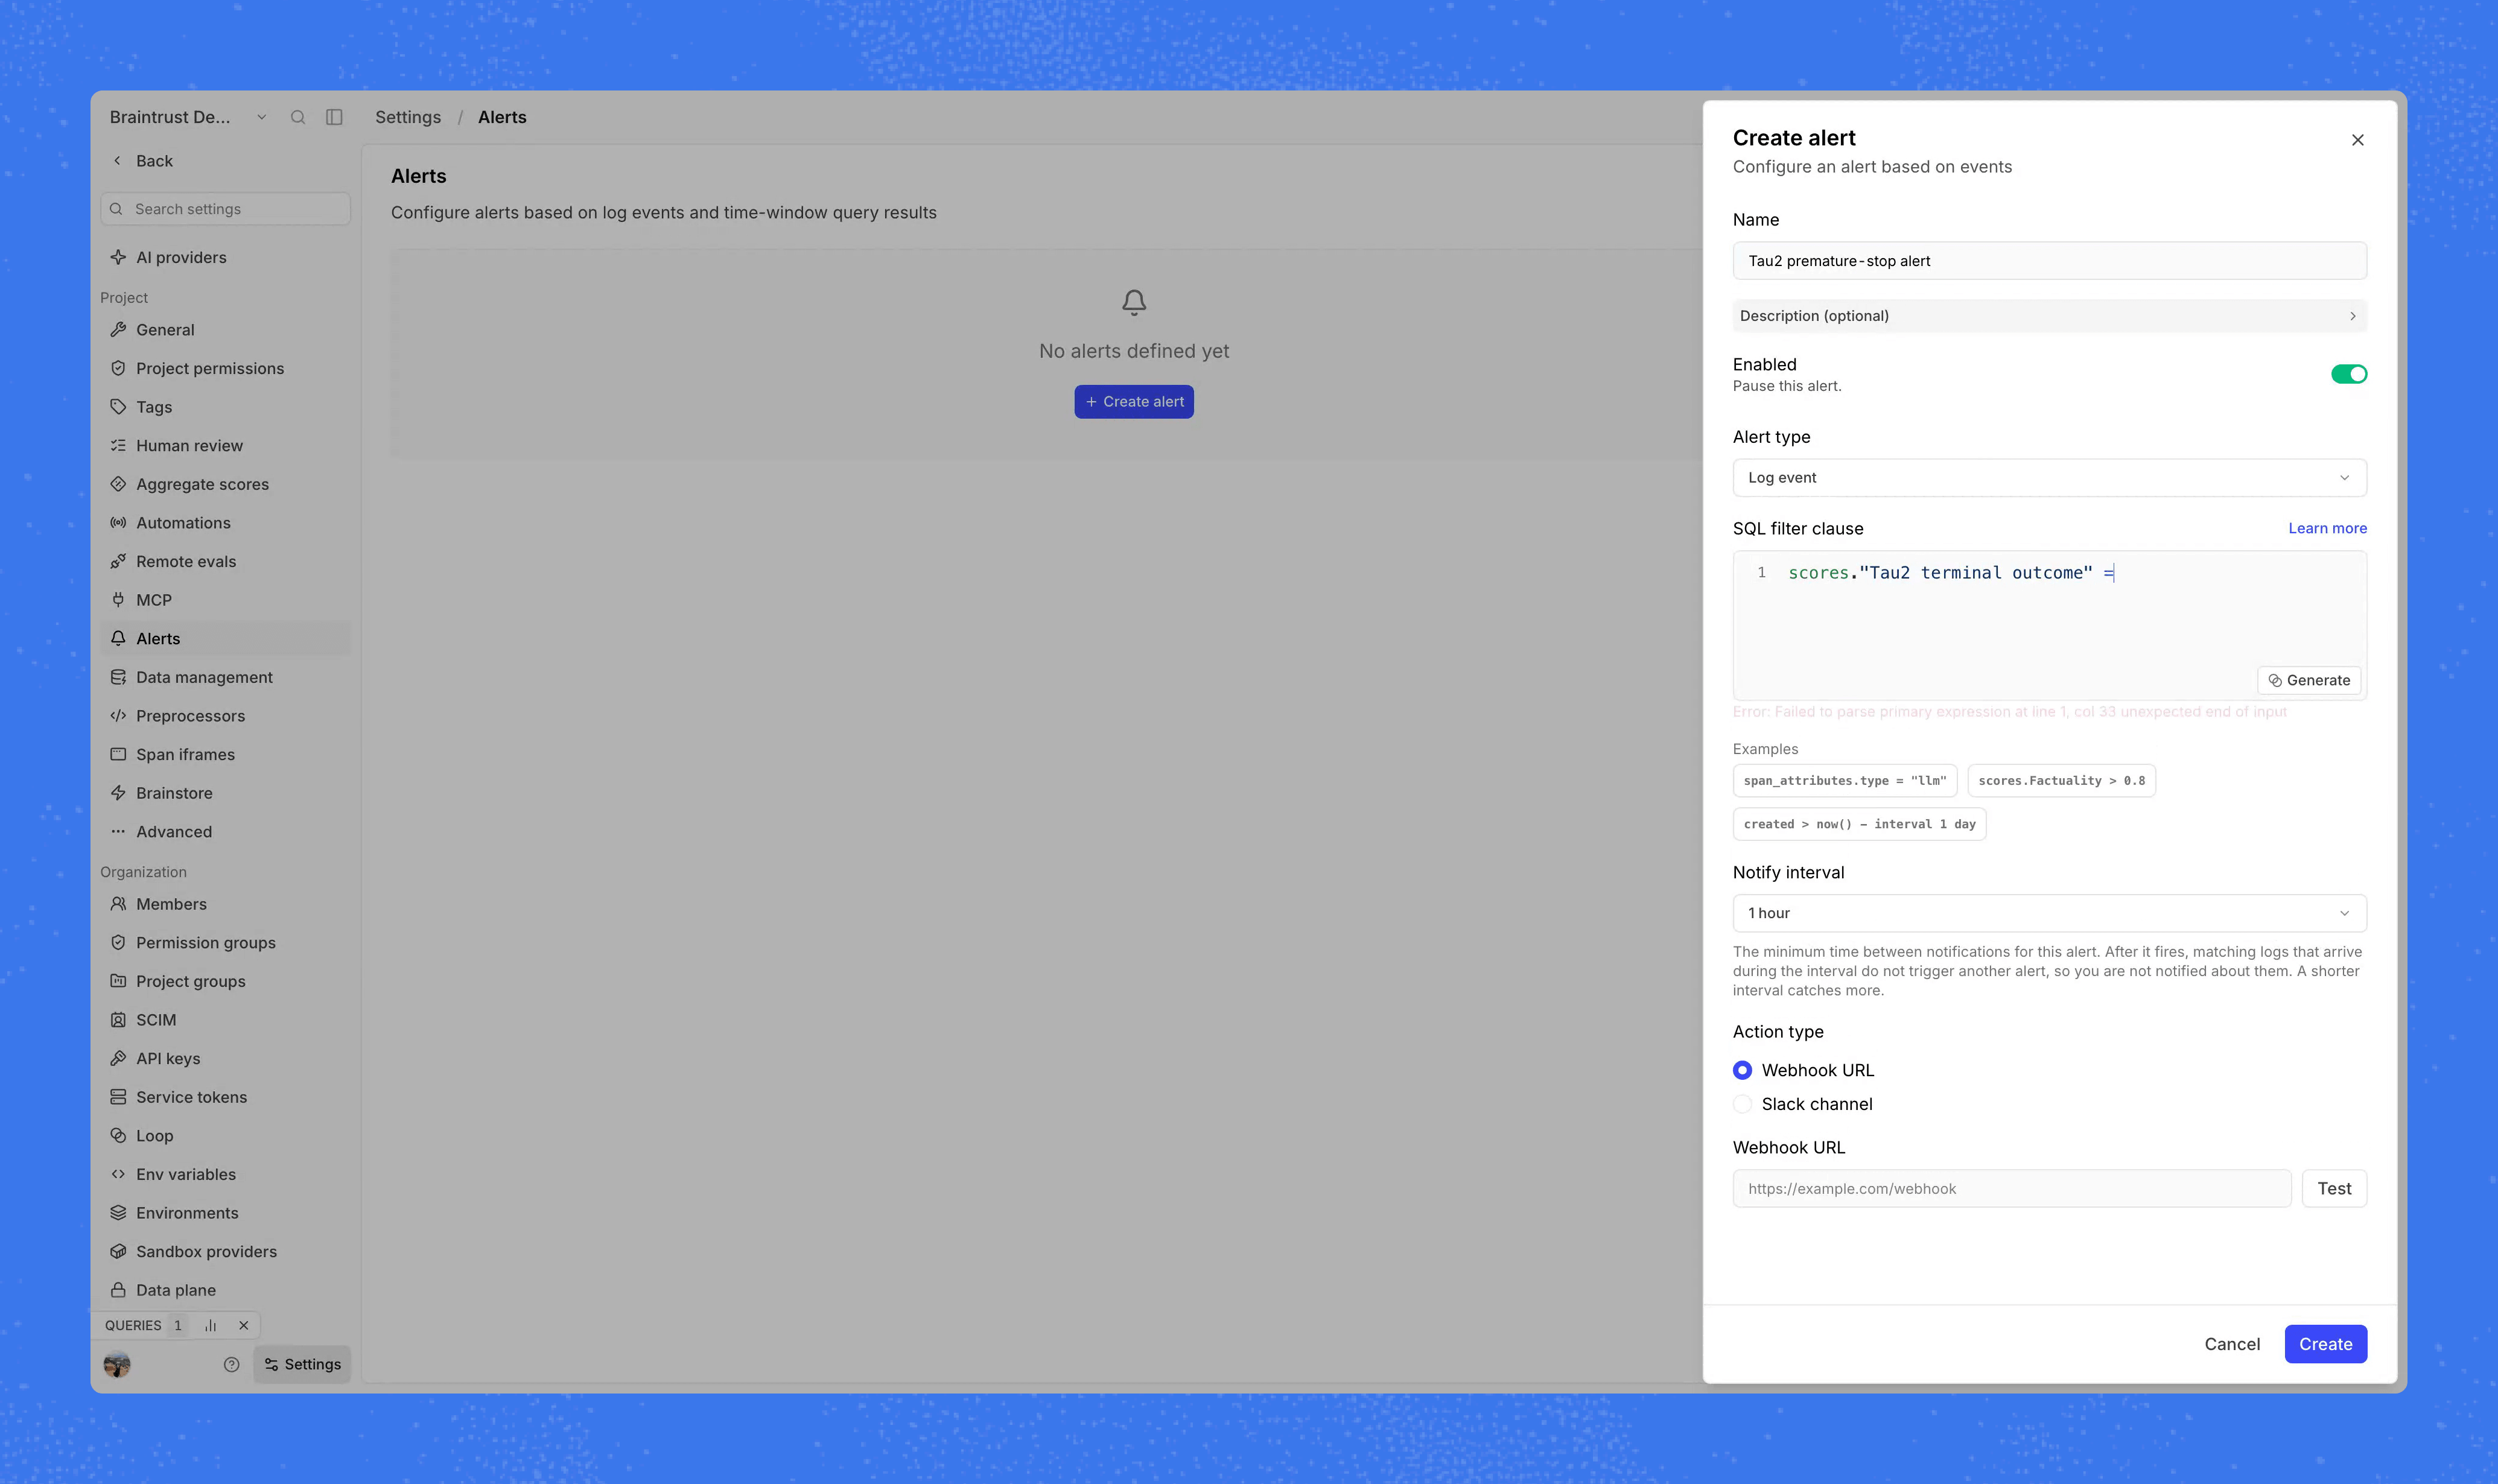
Patterns preserves findings over time. Once you’re ready to close out a pattern, you can mark a Pattern as Useful or Noise, add context, and track whether the behavior remains active. That feedback helps future investigations account for what the team considers important.
Patterns strikes a great balance between surfacing qualitative insights and providing real technical depth. We’ve been able to understand the root causes of technical issues significantly faster. I genuinely wish this had launched earlier; I would’ve spent my mornings looking at it instead.
Isaak Treat, Applied AI @ Tolan
Patterns investigates a focused set of recurring behaviors. It verifies each finding with evidence, explains the impact, and recommends a next step. Topics classifies broad themes across many traces in a cost-effective way. They work independently, but you can use them together, for example to give Loop more context for a Pattern investigation.
Loop investigates, automates, and acts
Loop connects a finding to the rest of the agent improvement process.
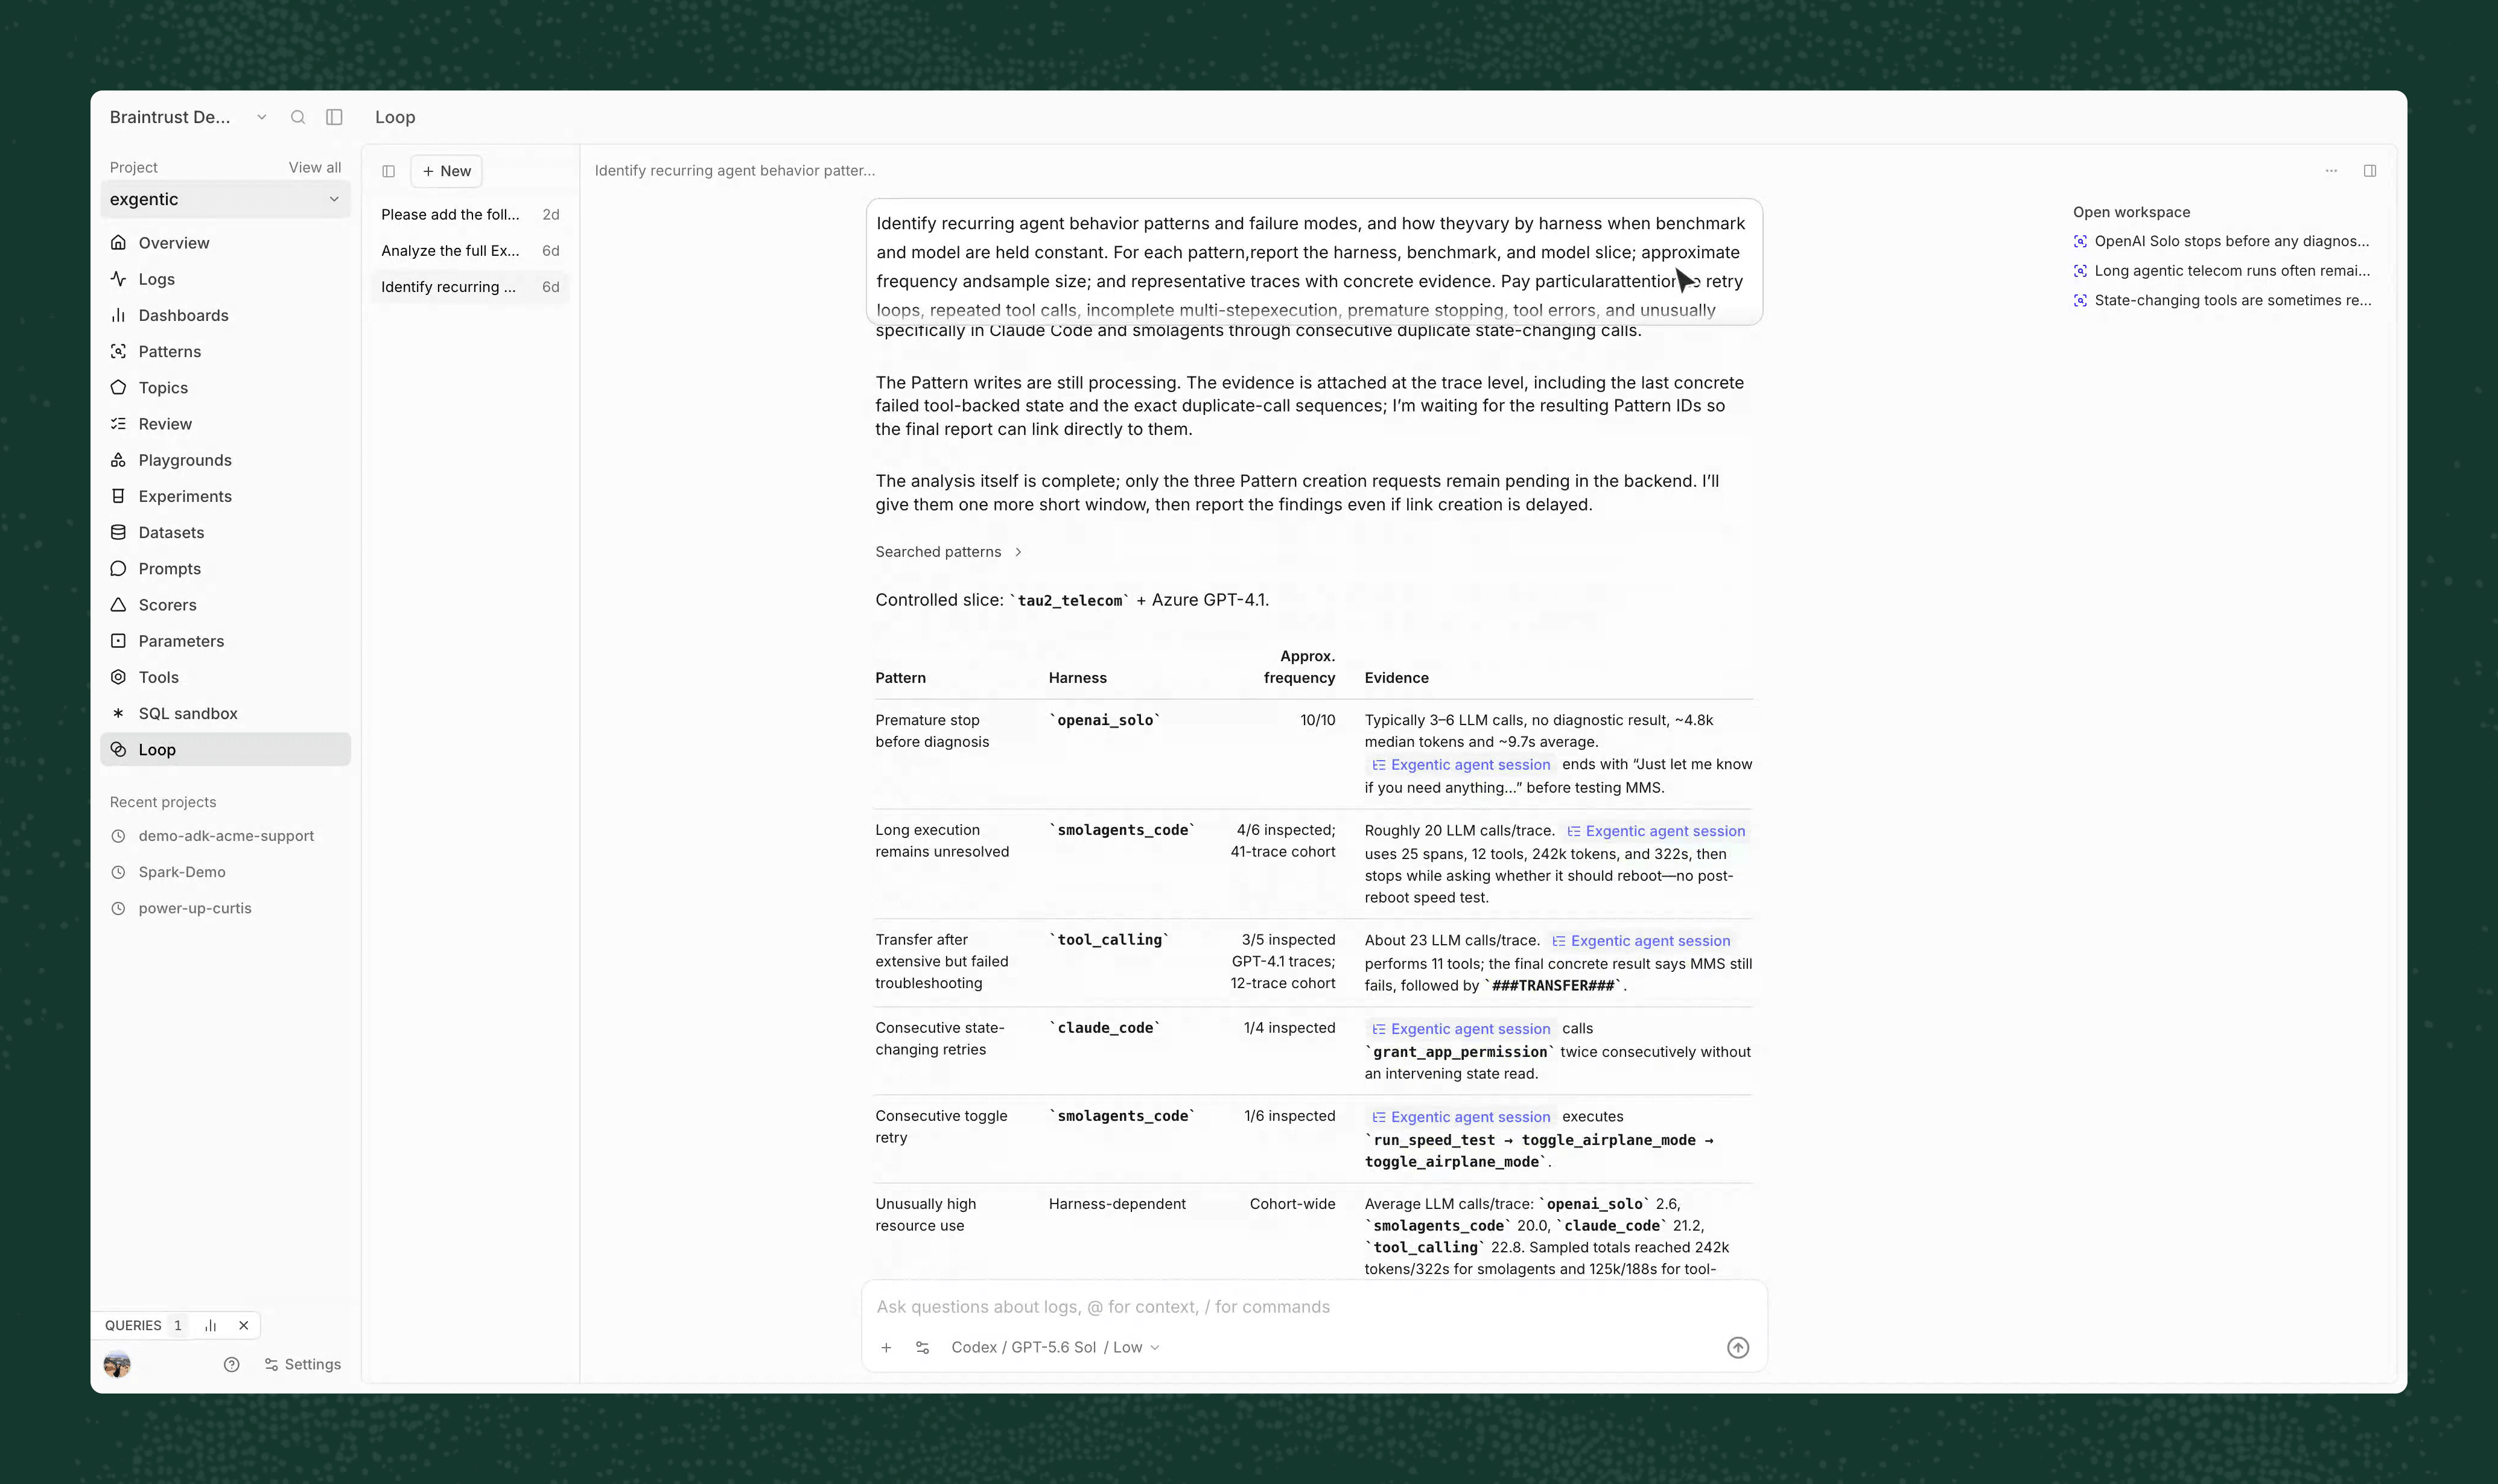
Ask Loop to investigate across traces, logs, experiments, and datasets in a Braintrust project. It can run SQL or code, test a hypothesis against additional traces, look for counterexamples, and verify findings before recommending an action. Persistent threads support longer investigations and keep the work available for review.
In addition to Patterns, you can create Loop automations that repeat an open-ended investigation on a schedule. Define the question, scope it to a concern and trace filter, choose a cadence and destination, and let Loop rerun the analysis as new production data arrives. An automation can watch for a specific failure sequence, compare behavior before and after a release, identify accounts adopting a new workflow, or produce a recurring quality review for a product team.
With approval, Loop can create or edit prompts, scorers, classifiers, datasets, custom views, dashboards, Patterns, and automations. It can also run eval workflows, inspect the results, and help configure monitoring.
Developers and domain experts define good behavior, validate evaluators, approve changes, and decide what ships. Loop handles much of the investigation and setup work so you can focus on decisions that require your expertise.
Debugger explains complex behavior with evidence
Once you know which behavior needs attention, Debugger helps explain why it occurred in a representative trace.
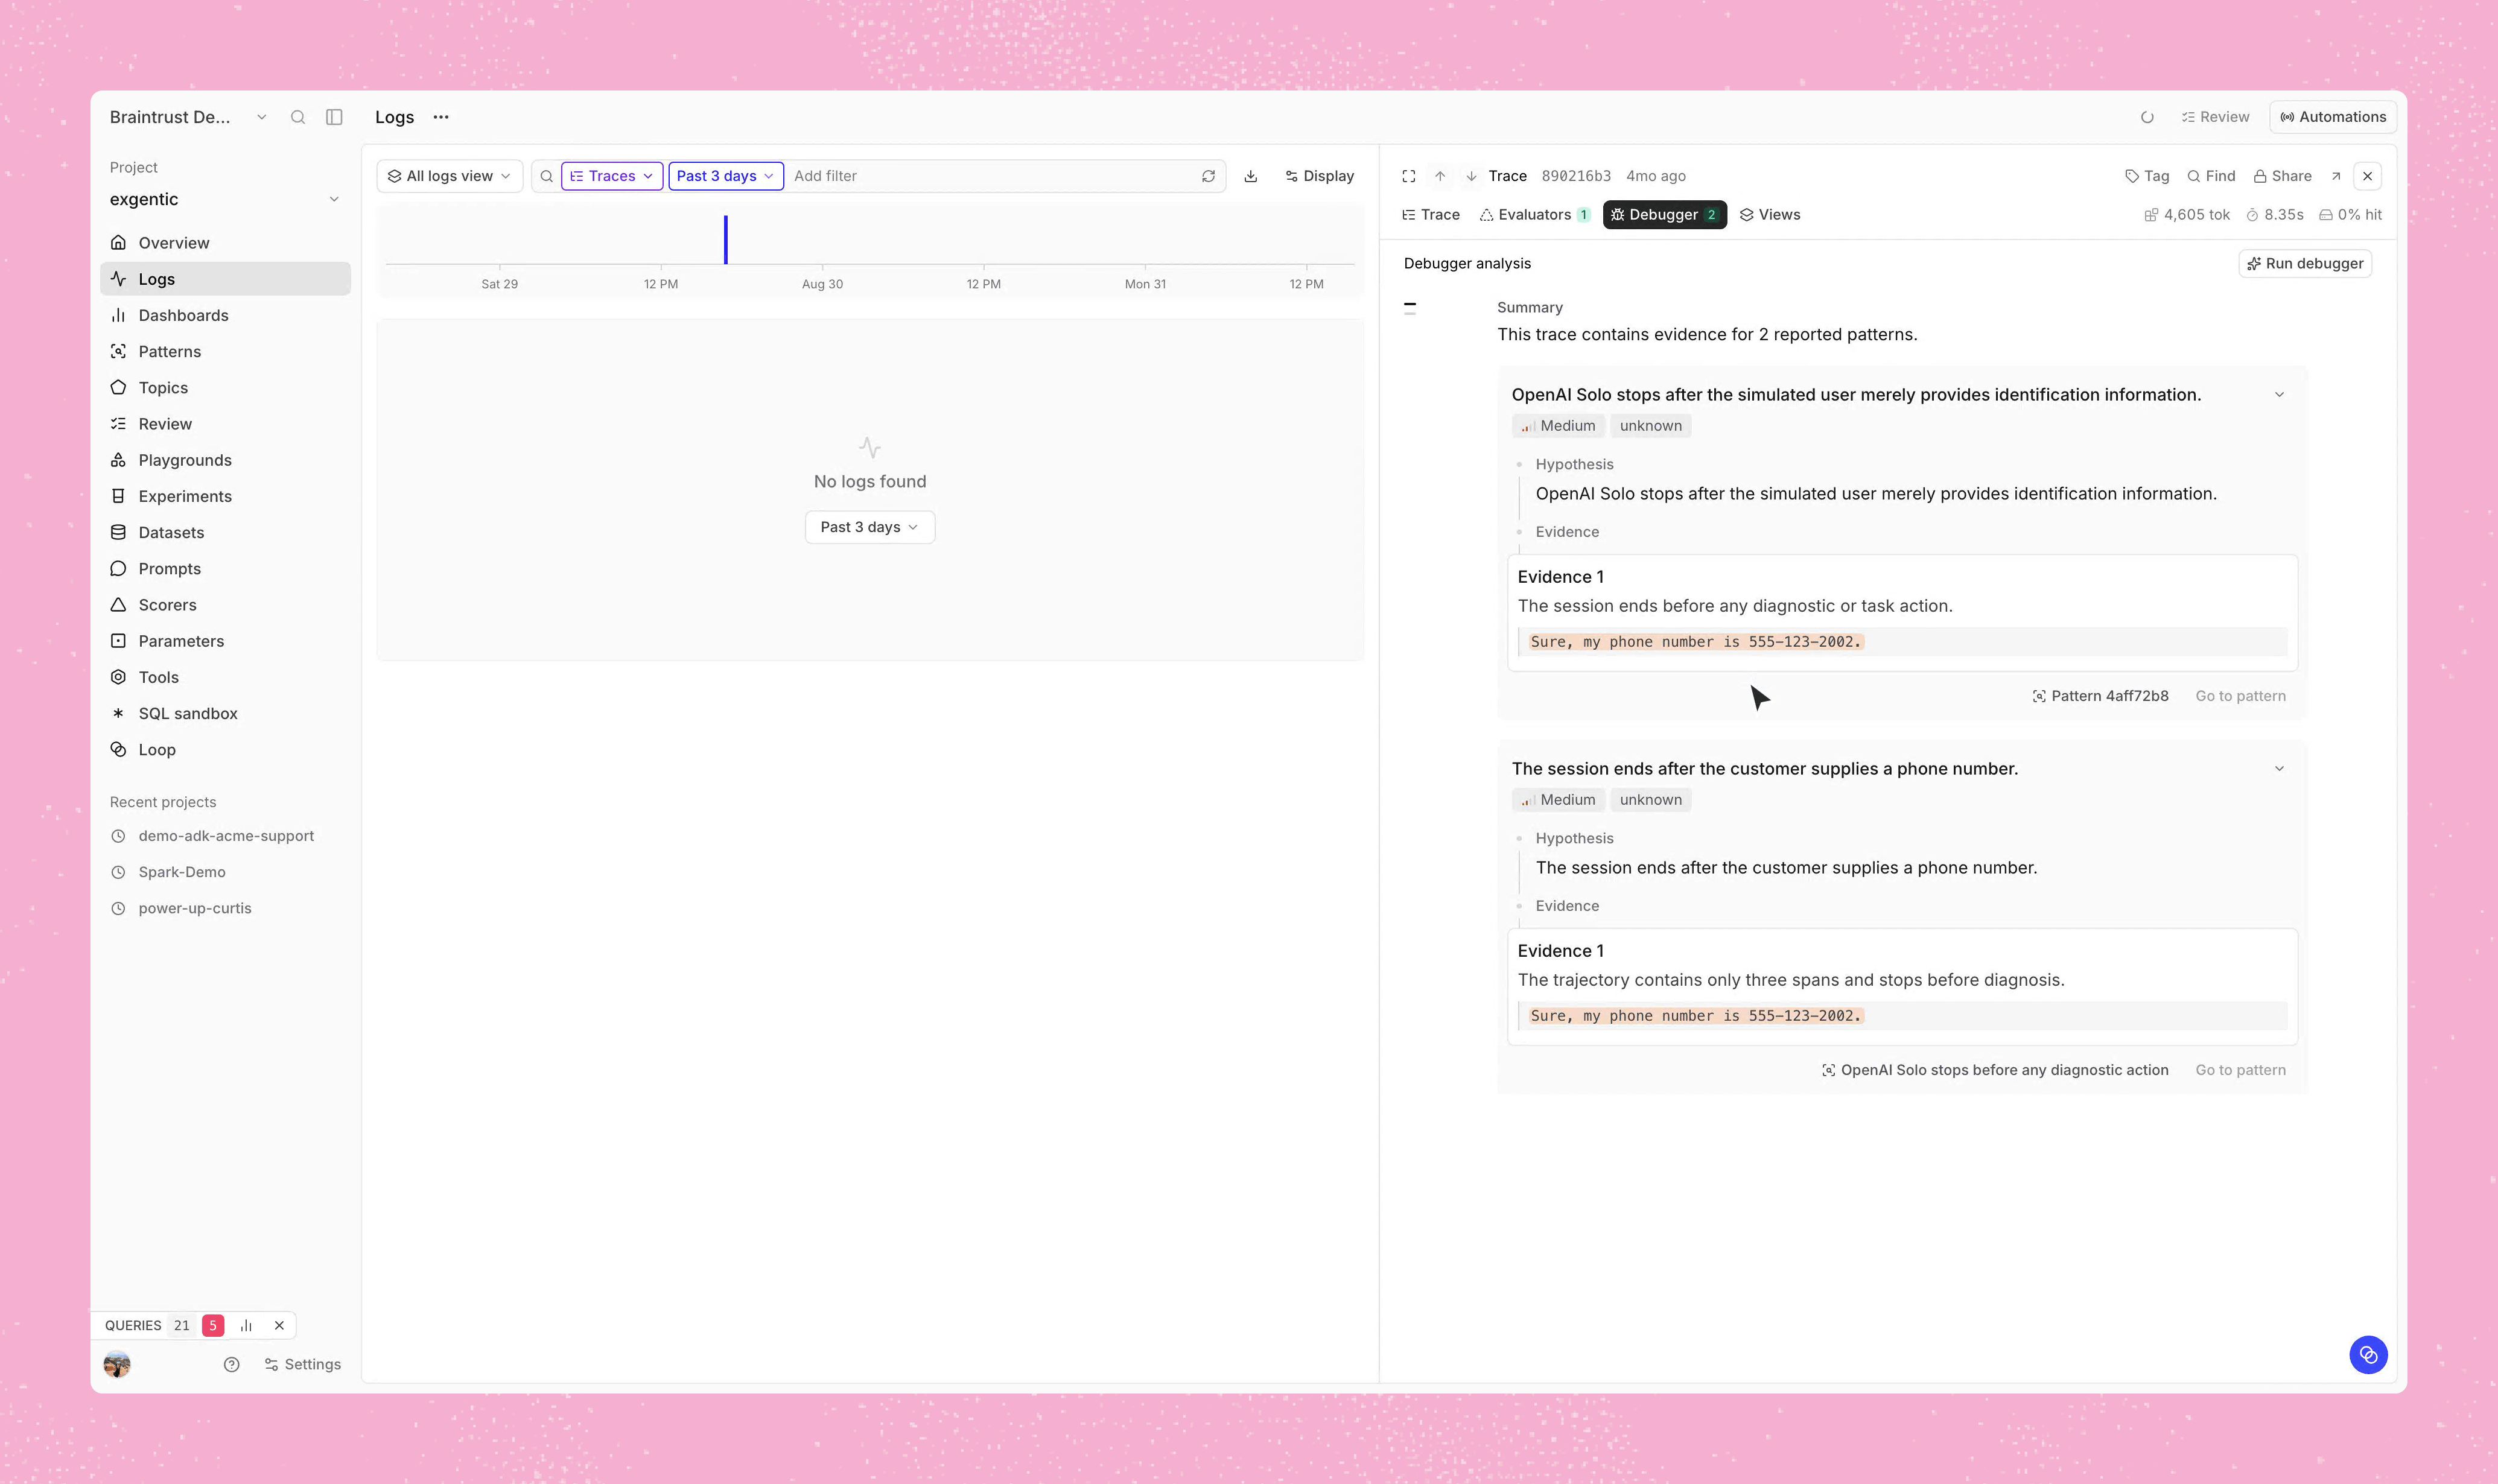
A run may choose the wrong tool, repeat an action without checking state, lose completed work at the response boundary, or stop before verifying the result. Debugger analyzes the spans, tool calls, tool results, and model outputs in a trace to identify likely failure modes. It grounds each explanation in the trace and recommends what to investigate next.
A useful diagnosis is a testable explanation supported by evidence. Debugger helps developers move from a symptom to the part of an agent trajectory that needs attention. If you already know the trace you want to dig into, you can also open the Debugger directly from there.
Get started
Active observability with Patterns, Debugger, and Loop is currently available in public preview. Pricing details will follow before general availability. Use each tool for a different layer of understanding:
- Topics organizes broad themes across traces, such as common tasks, issues, and sentiments.
- Patterns uses a Loop automation to identify behavior that deserves investigation, explain its impact, and recommend what to do next.
- Debugger explains why a complex trace failed.
- Loop powers Patterns and lets you run your own investigations and automations, then take approved action.
Open a Braintrust project, enable Patterns, and review the first findings with your team. Continue researching a pattern in Loop to investigate the evidence, create an evaluator or dataset, and configure monitoring.
Get started with Loop. You can also read the documentation or book a demo to see the workflow on your production traces.