Application logs and agent traces in one view
You can now use Braintrust for both application observability and agent observability. The same advanced features you’re used to, like full-text search, error filtering, and active observability tools, are now available for your application logs.
If you’re already tracing agents, application logs give you even more context about their behavior. For example, when a tool call fails, you can investigate the logged errors and retries alongside the agent’s actions and responses. Logs and traces show up in one view, so you don’t need to switch systems.
You can also send logs from services that run independently of your agents. The same Braintrust tools that diagnose agent behavior, like Patterns, can also find issues with your database or background workers.
Application logs are available in public preview for all Braintrust SaaS and BYOC customers, and for self-hosted customers starting with data plane 2.14. Send application logs through the Python SDK or OpenTelemetry, with or without traces.
Discover what happened
Whether or not you’re connecting logs and traces, you can search through your logs, choose time ranges, and filter by severity to focus on warnings or errors. Open any log to look through its contents, including the metadata your application recorded.
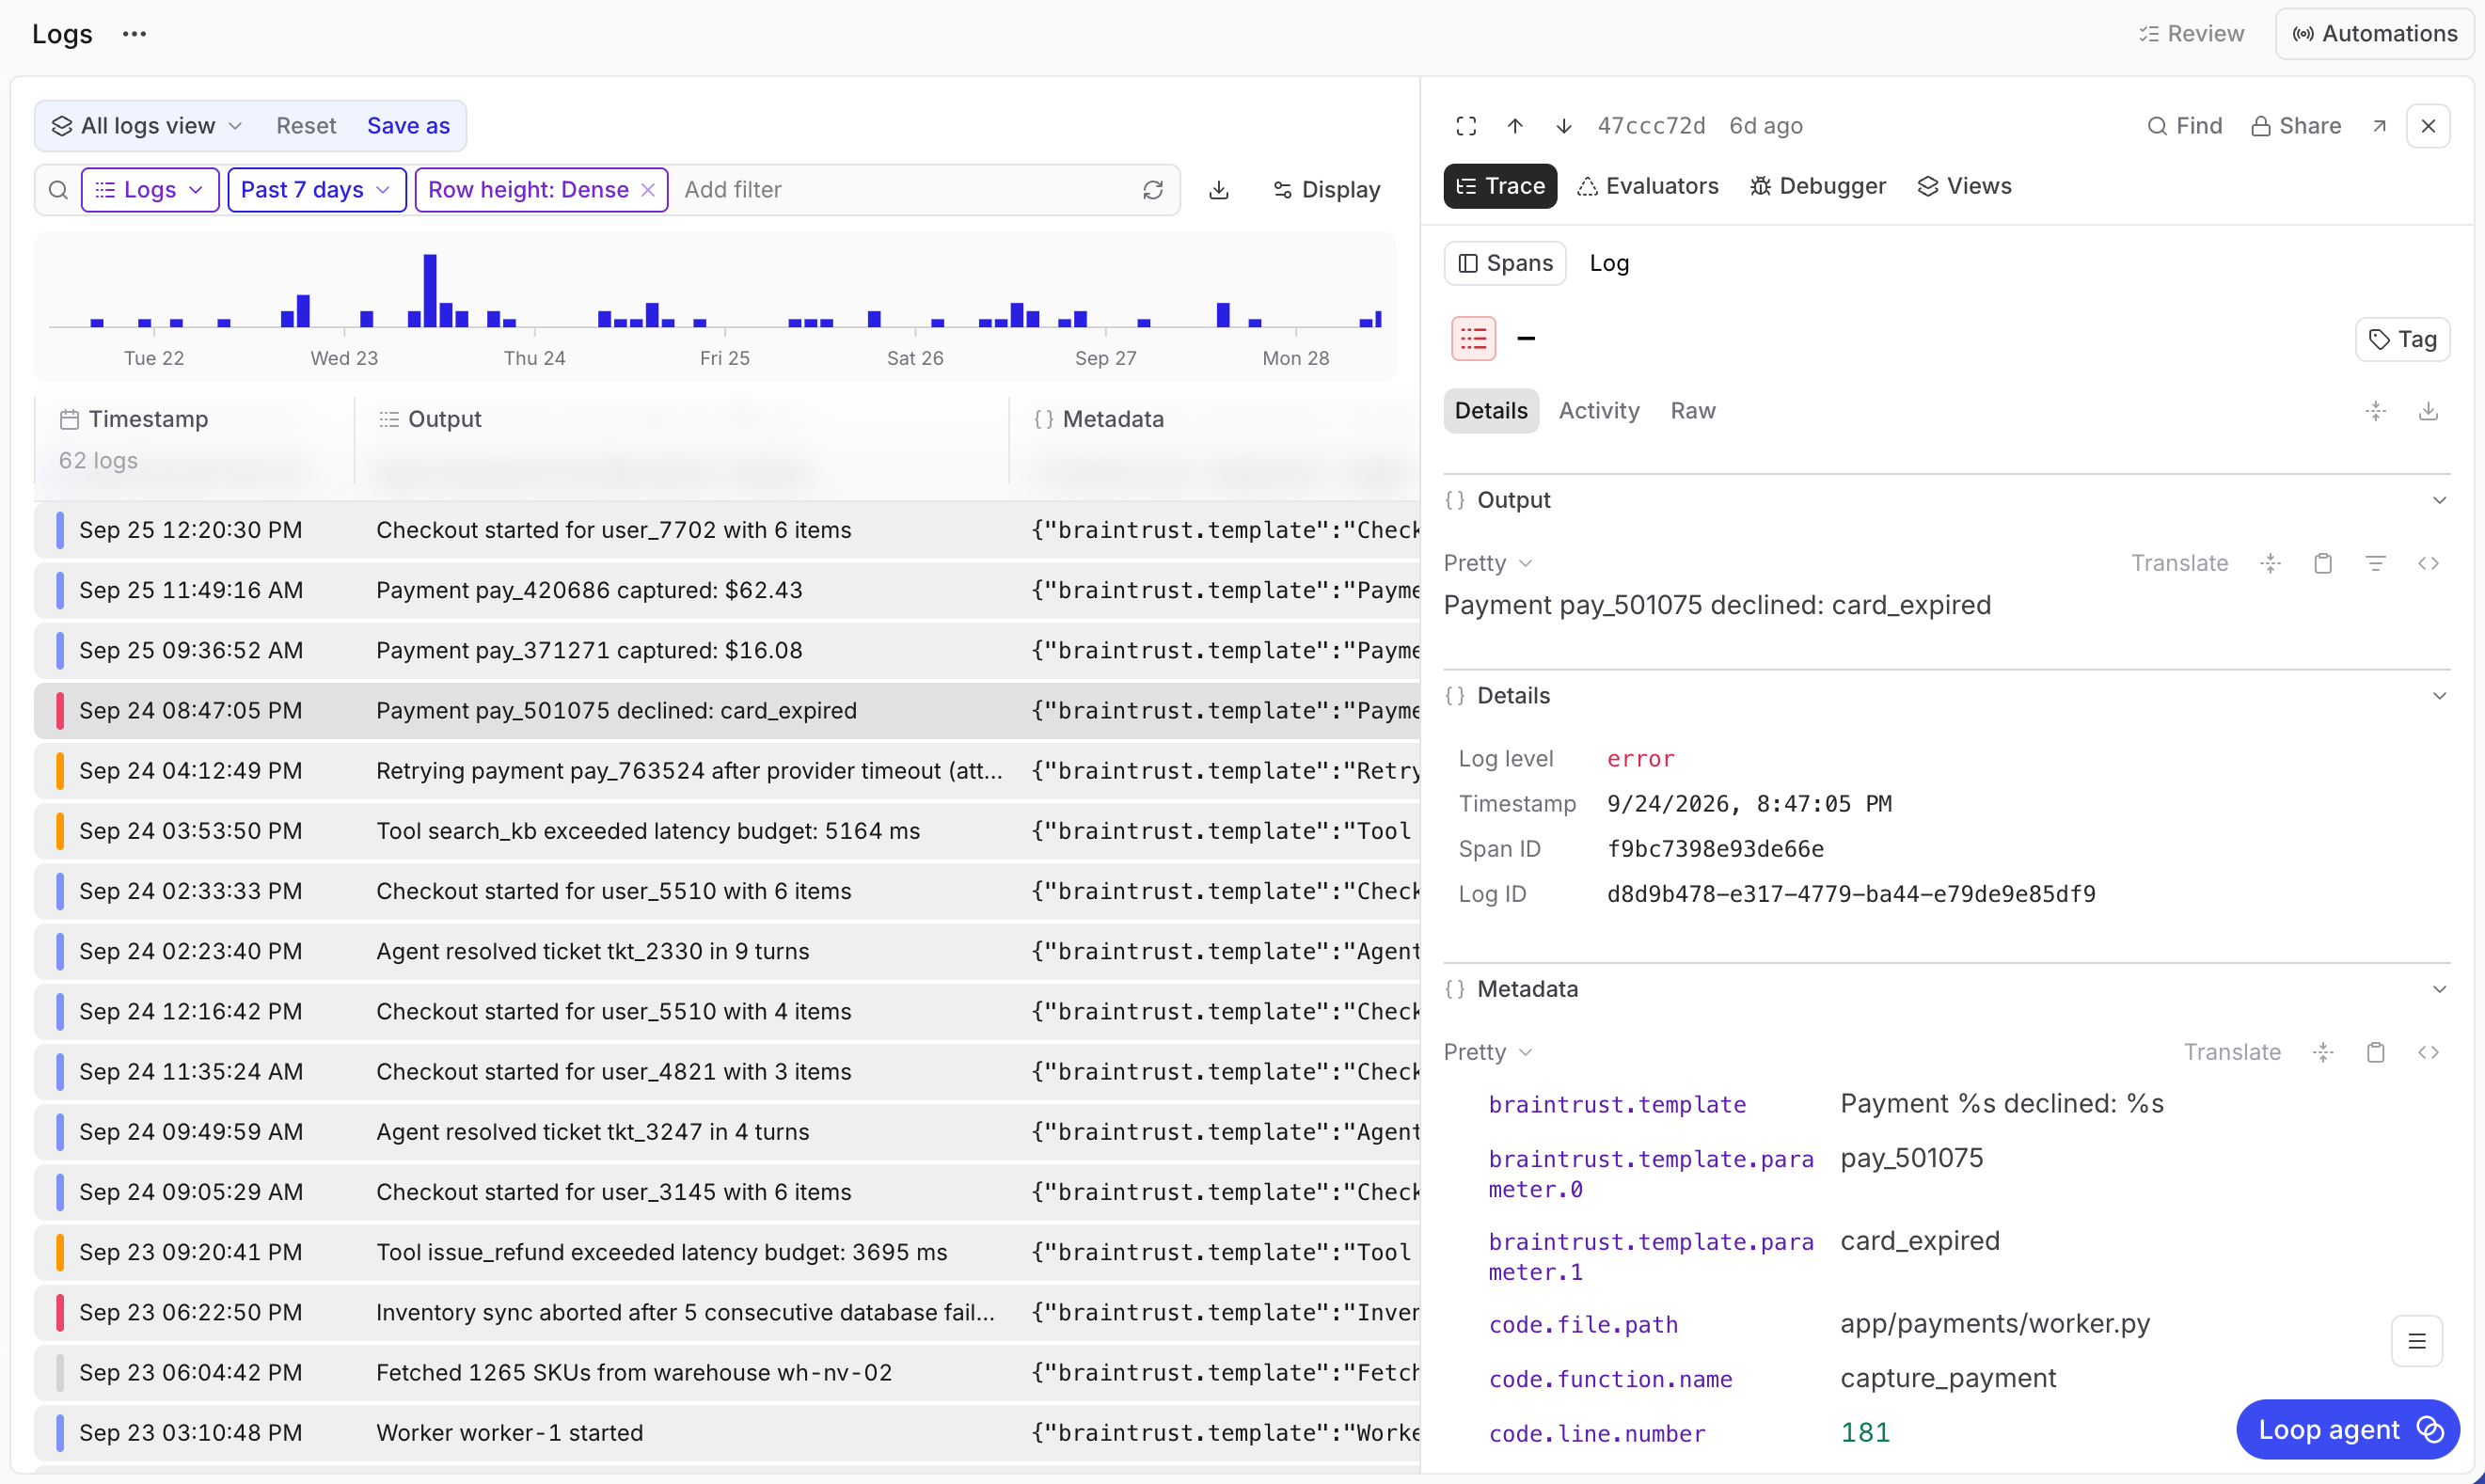
Preserving message templates lets you group recurring events, even when individual values differ. For example, you can count payment failures across different payment IDs while retaining the details of each failure. The Python SDK captures templates and their values automatically when you use named parameters.
You can also use the same query tools for traces to filter messages and look at specific fields. Query logs with SQL to answer questions across your application, such as which errors happened most often over the past day.
Read logs and traces together
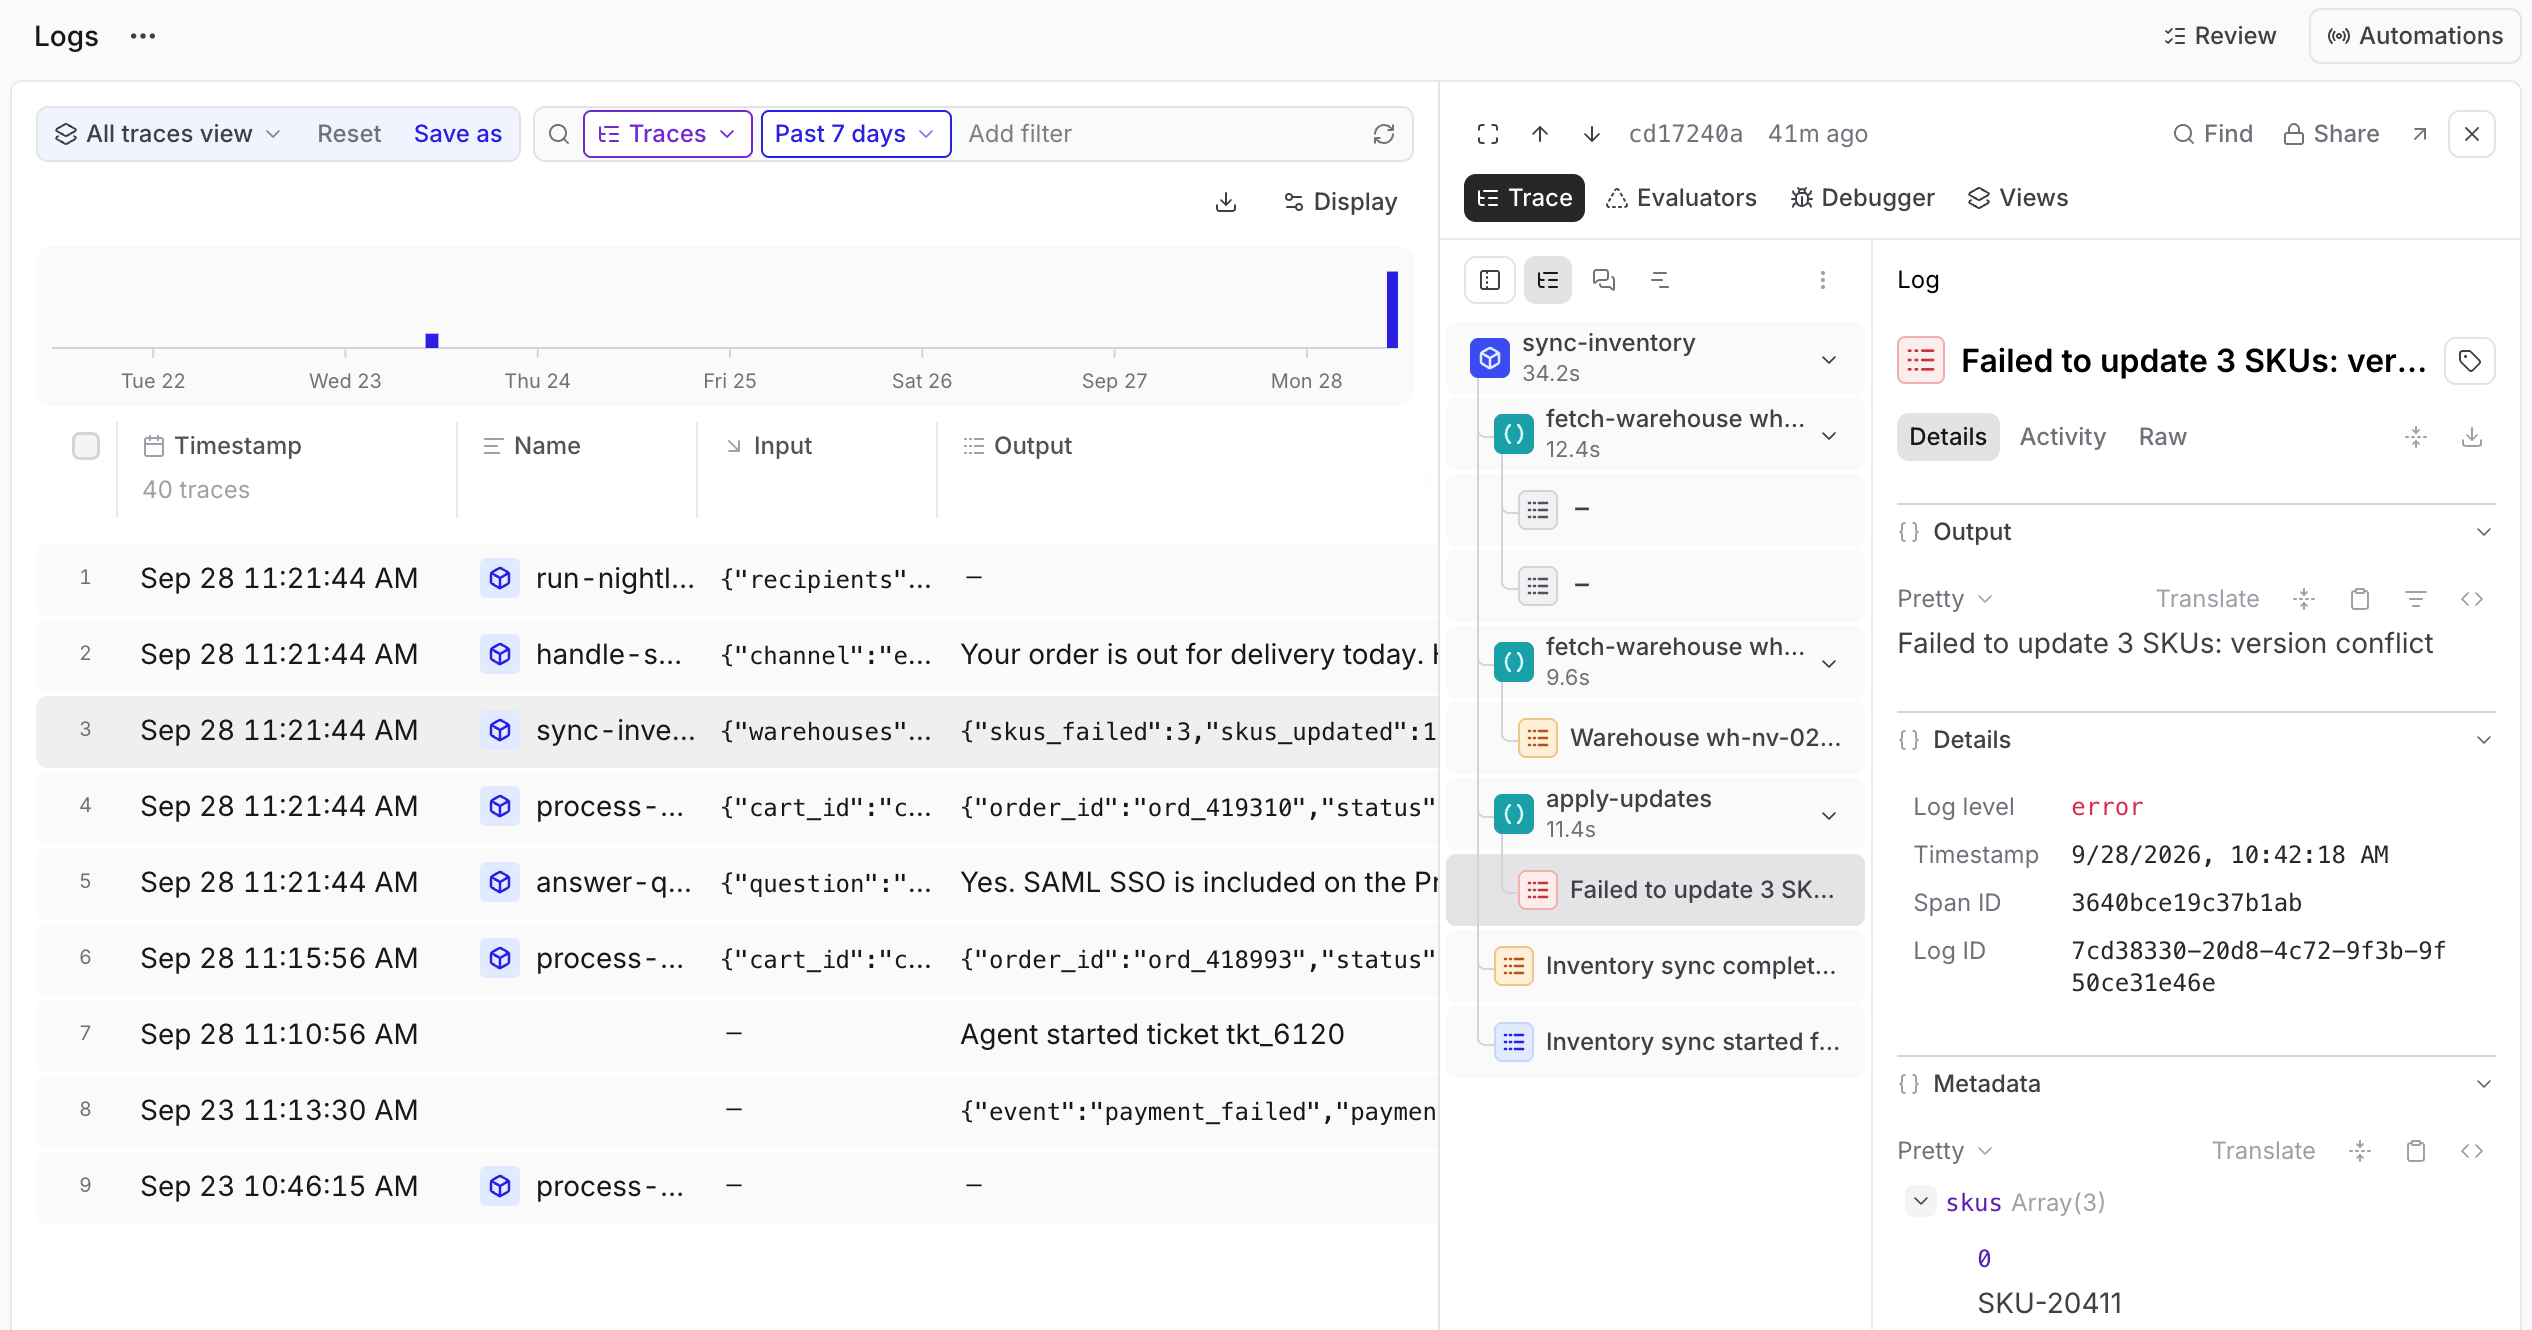
When a log is connected to a trace, you can look at it alongside the agent steps that produced it. For example, if a tool request times out, you can look at the error and see how the agent responded. Did it try the request again, use a different tool, or return an answer? You now have the context to investigate both the application and the agent.
Find recurring problems
You can also use active observability tools like Patterns to identify recurring behaviors. Set up Patterns or a custom Loop automation to review your traces and logs on a schedule. From there, you can review findings and supporting evidence, evaluate suggested fixes, and implement them in your product.
Get started
Start by sending logs from one service. You can use the Python SDK or send logs from any language that supports the OpenTelemetry protocol, OTLP, using an exporter or collector. The examples below don't require an active trace.
Python
Install the Python SDK (v0.42.0 or later) and set BRAINTRUST_API_KEY to your Braintrust API key.
pip install --upgrade "braintrust>=0.42.0"
If your application already uses Python's logging module, forward those logs without changing your existing log calls:
import logging

from braintrust import BraintrustLogHandler, init_logger

braintrust_logger = init_logger(project="application-logs")
handler = BraintrustLogHandler(braintrust_logger)
app_logger = logging.getLogger("checkout")
app_logger.setLevel(logging.INFO)
app_logger.addHandler(handler)

app_logger.info("Payment %s started", "pay_123", extra={"attempt": 1})

handler.flush()
app_logger.removeHandler(handler)
handler.close()
You can also send logs directly with the Python SDK and preserve message templates:
from braintrust import init_logger

logger = init_logger(project="application-logs")

logger.error("Payment {payment_id} failed", payment_id="pay_123")

logger.flush()
JavaScript with OpenTelemetry
For Node.js, install the OpenTelemetry packages and set BRAINTRUST_API_KEY and BRAINTRUST_PROJECT_ID to your API key and project ID.
pnpm add @opentelemetry/api-logs@0.203.0 \
  @opentelemetry/sdk-logs@0.203.0 \
  @opentelemetry/exporter-logs-otlp-http@0.203.0
Save this example as logs.mjs and run it with node logs.mjs. It uses the US endpoint; replace it with the logs endpoint for your deployment if needed.
import {
  BatchLogRecordProcessor,
  LoggerProvider,
} from "@opentelemetry/sdk-logs";

const { BRAINTRUST_API_KEY, BRAINTRUST_PROJECT_ID } = process.env;
if (!BRAINTRUST_API_KEY || !BRAINTRUST_PROJECT_ID) {
  throw new Error("Set BRAINTRUST_API_KEY and BRAINTRUST_PROJECT_ID");
}

const exporter = new OTLPLogExporter({
  url: "https://api.braintrust.dev/otel/v1/logs",
  headers: {
    Authorization: `Bearer ${BRAINTRUST_API_KEY}`,
    "x-bt-parent": `project_id:${BRAINTRUST_PROJECT_ID}`,
  },
});
const provider = new LoggerProvider({
  processors: [new BatchLogRecordProcessor(exporter)],
});
const logger = provider.getLogger("application-logs");

logger.emit({
  severityNumber: SeverityNumber.INFO,
  severityText: "INFO",
  body: "Worker started",
  attributes: { worker_id: "worker-1" },
});

await provider.shutdown();
Once logs appear, open Logs in your project and select the Logs row type.
To connect logs to a specific operation, include its trace context when you send them. You can do this with Python or OpenTelemetry.
Bring your application logs and traces together to understand what happened and what to improve. Get started with Braintrust or book a demo.