

- Send logs from the Python SDK, either by emitting messages or by forwarding standard-library
loggingrecords. - Send OpenTelemetry logs from any language that exports OTLP.
- Records a point in time, with zero duration.
- Has no children.
- Carries a severity level.
Send logs from the Python SDK
To send logs from Python, emit messages with a project logger’s severity methods, such asinfo() and error(), or forward existing records from the standard-library logging module with BraintrustLogHandler. The guide covers stored fields, message templates, and associating logs with a trace.
Send OpenTelemetry logs
To forward OpenTelemetry logs, configure your exporter or Collector.Inspect logs
- UI
- SQL
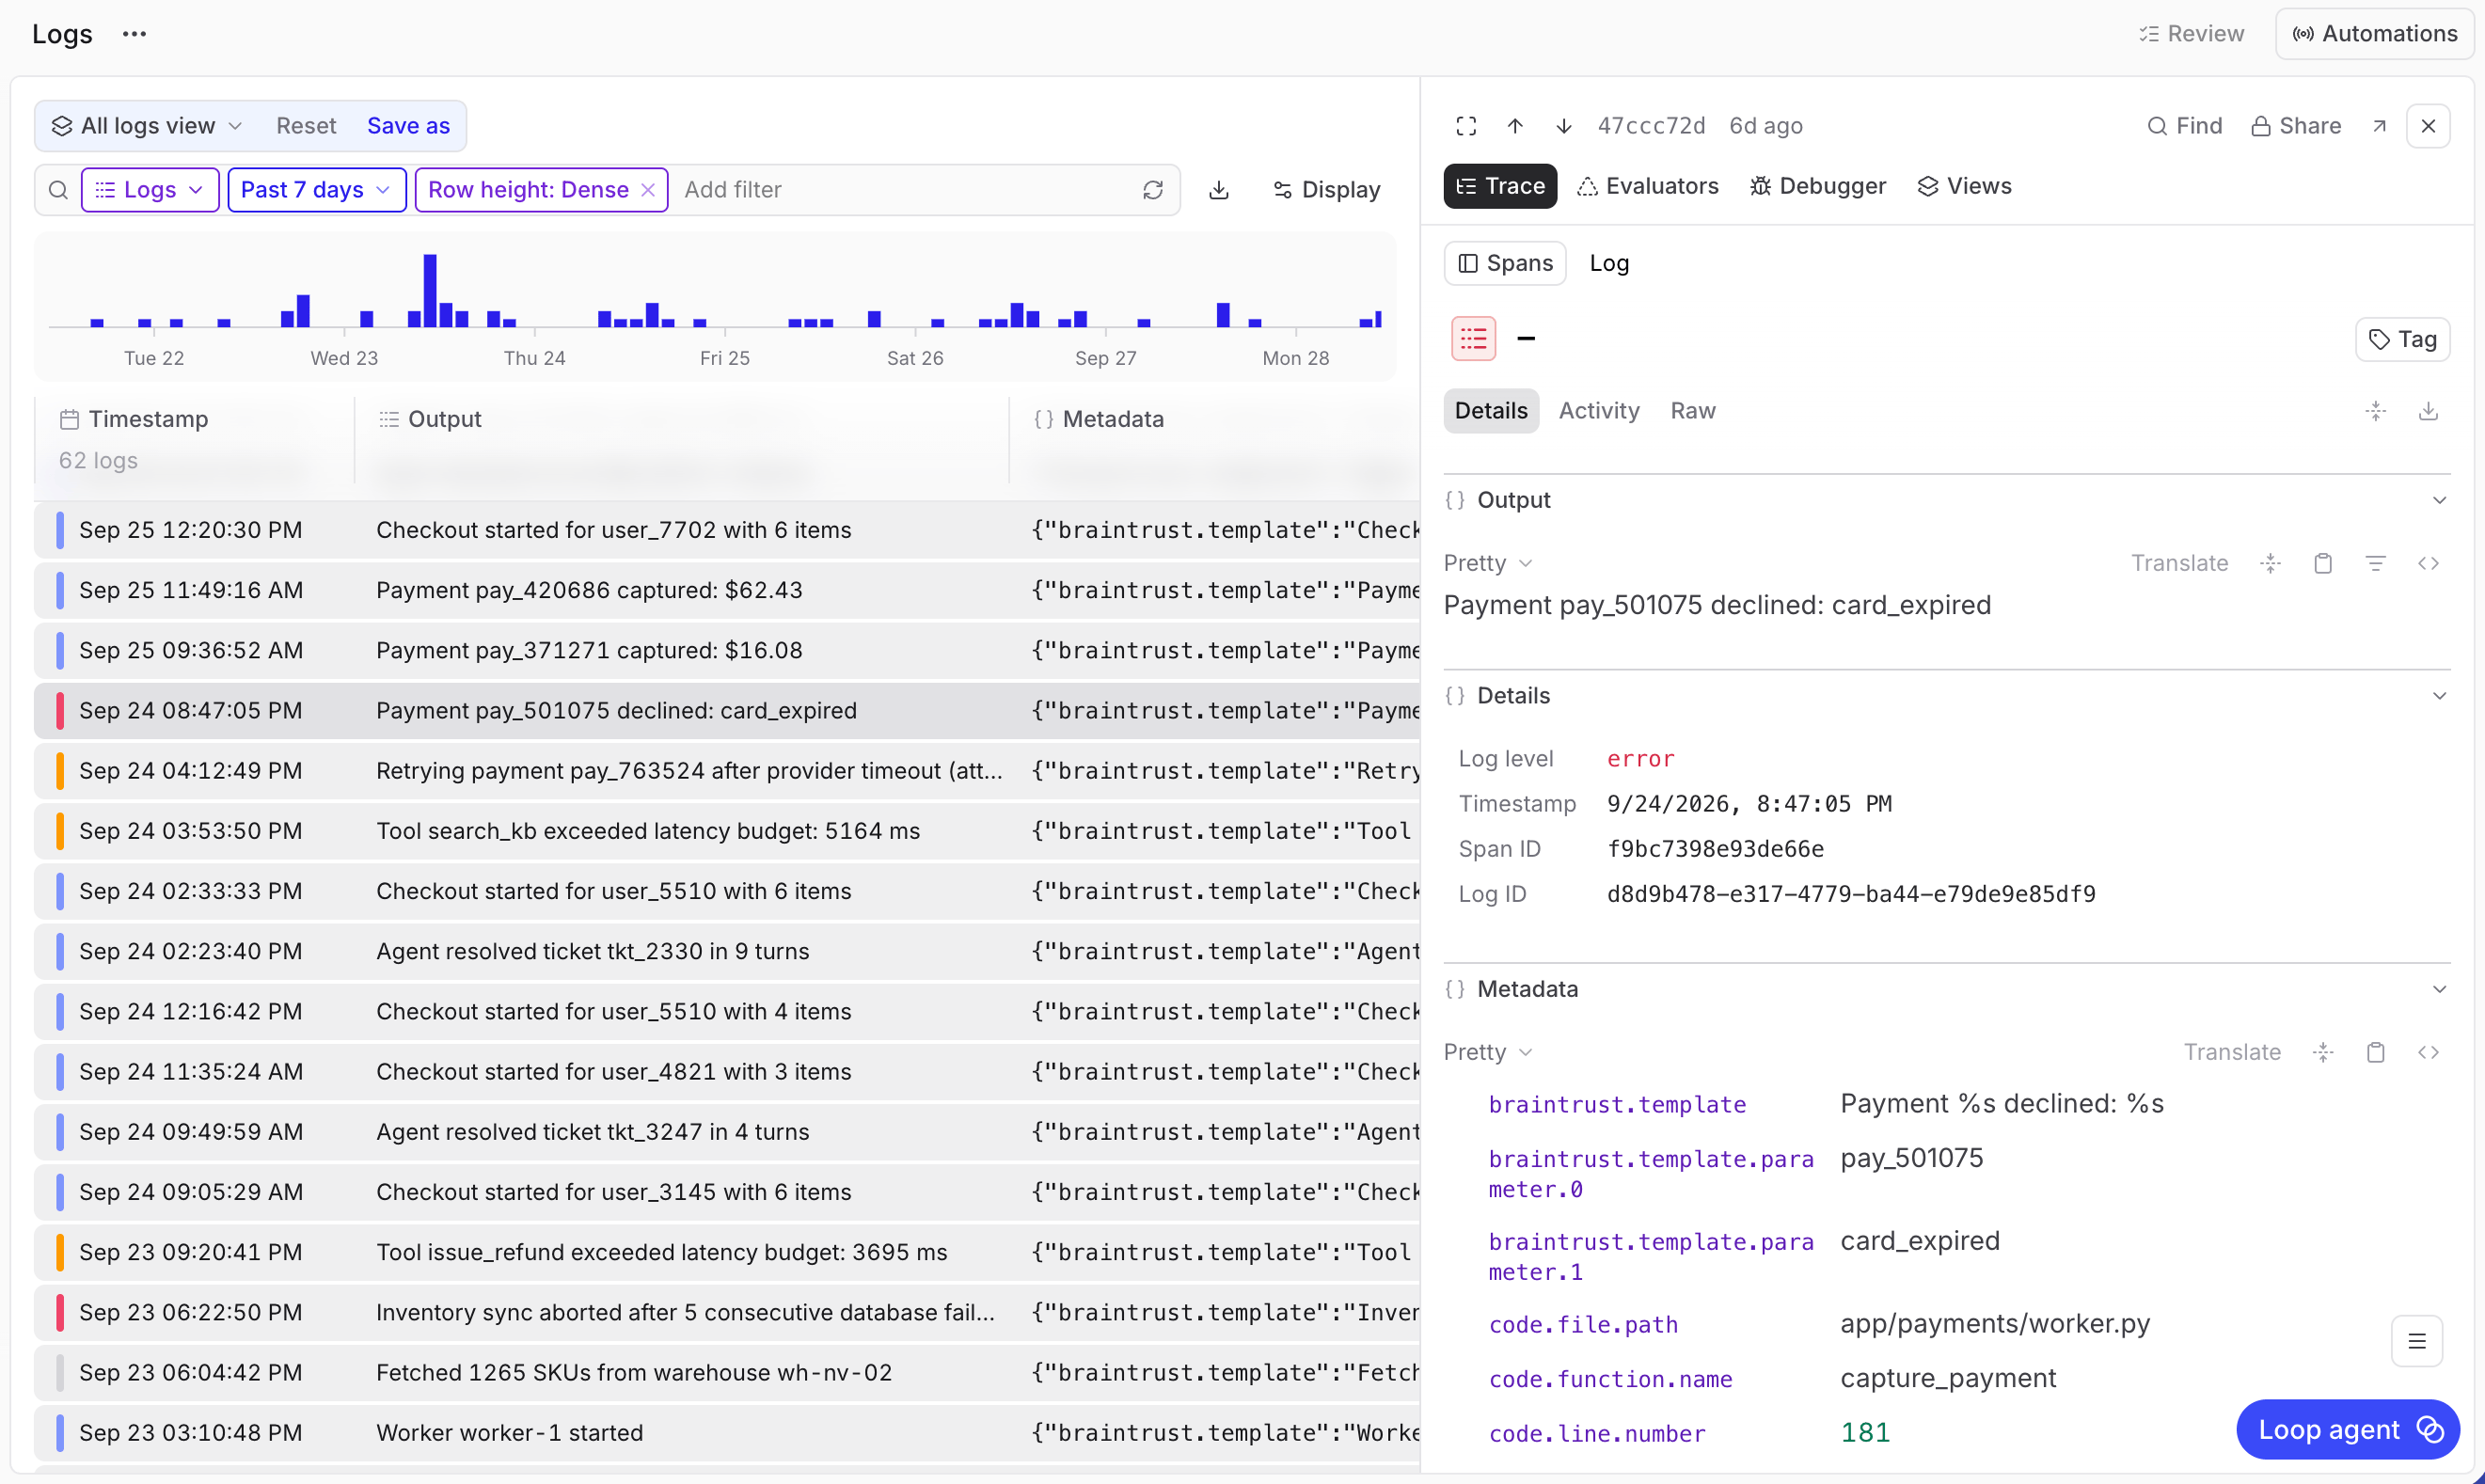
The Logs row type shows SDK messages, OTLP log records, and OpenTelemetry span events. The Traces and Spans row types exclude these rows. Log rows don’t offer scoring or human review actions.
- Go to Logs in your project. In the toolbar’s row type selector, choose Logs. This loads All logs view, with Dense rows and an all-time range.
- Choose a time range and use the search field to filter messages.
-
Select a message to inspect its contents:
- Output: The full message.
- Details: Log level, timestamp, span ID, and log ID.
- Metadata and Context: Additional fields, when present.
Filter by severity
- UI
- SQL
In the Logs row type, select the empty search field. It suggests a filter for each severity level, such as 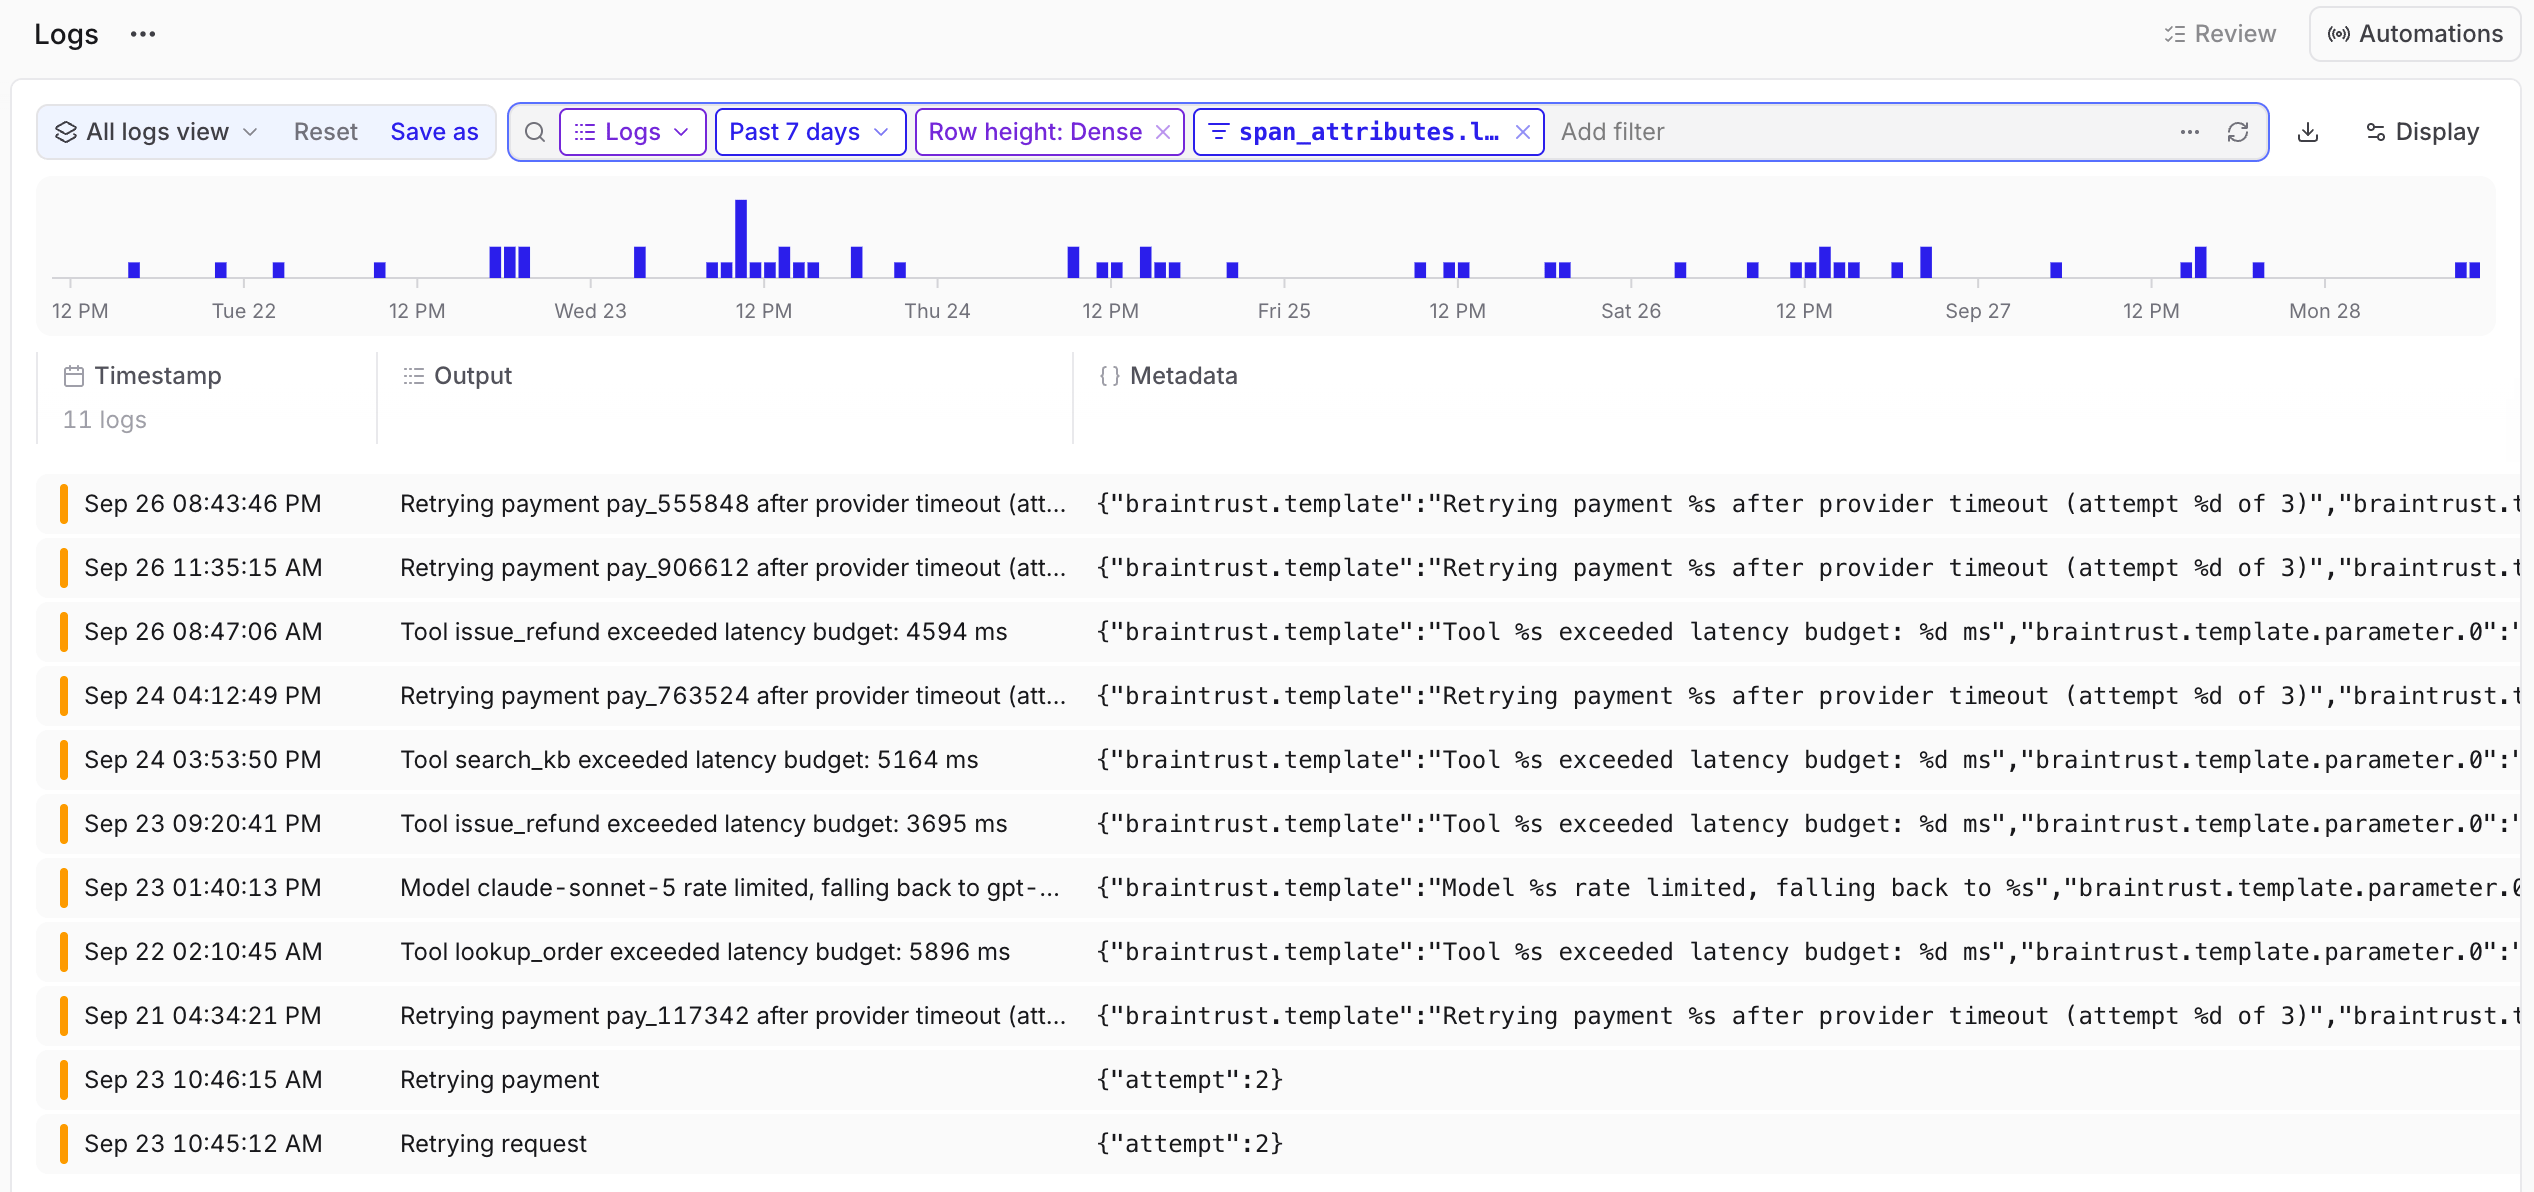
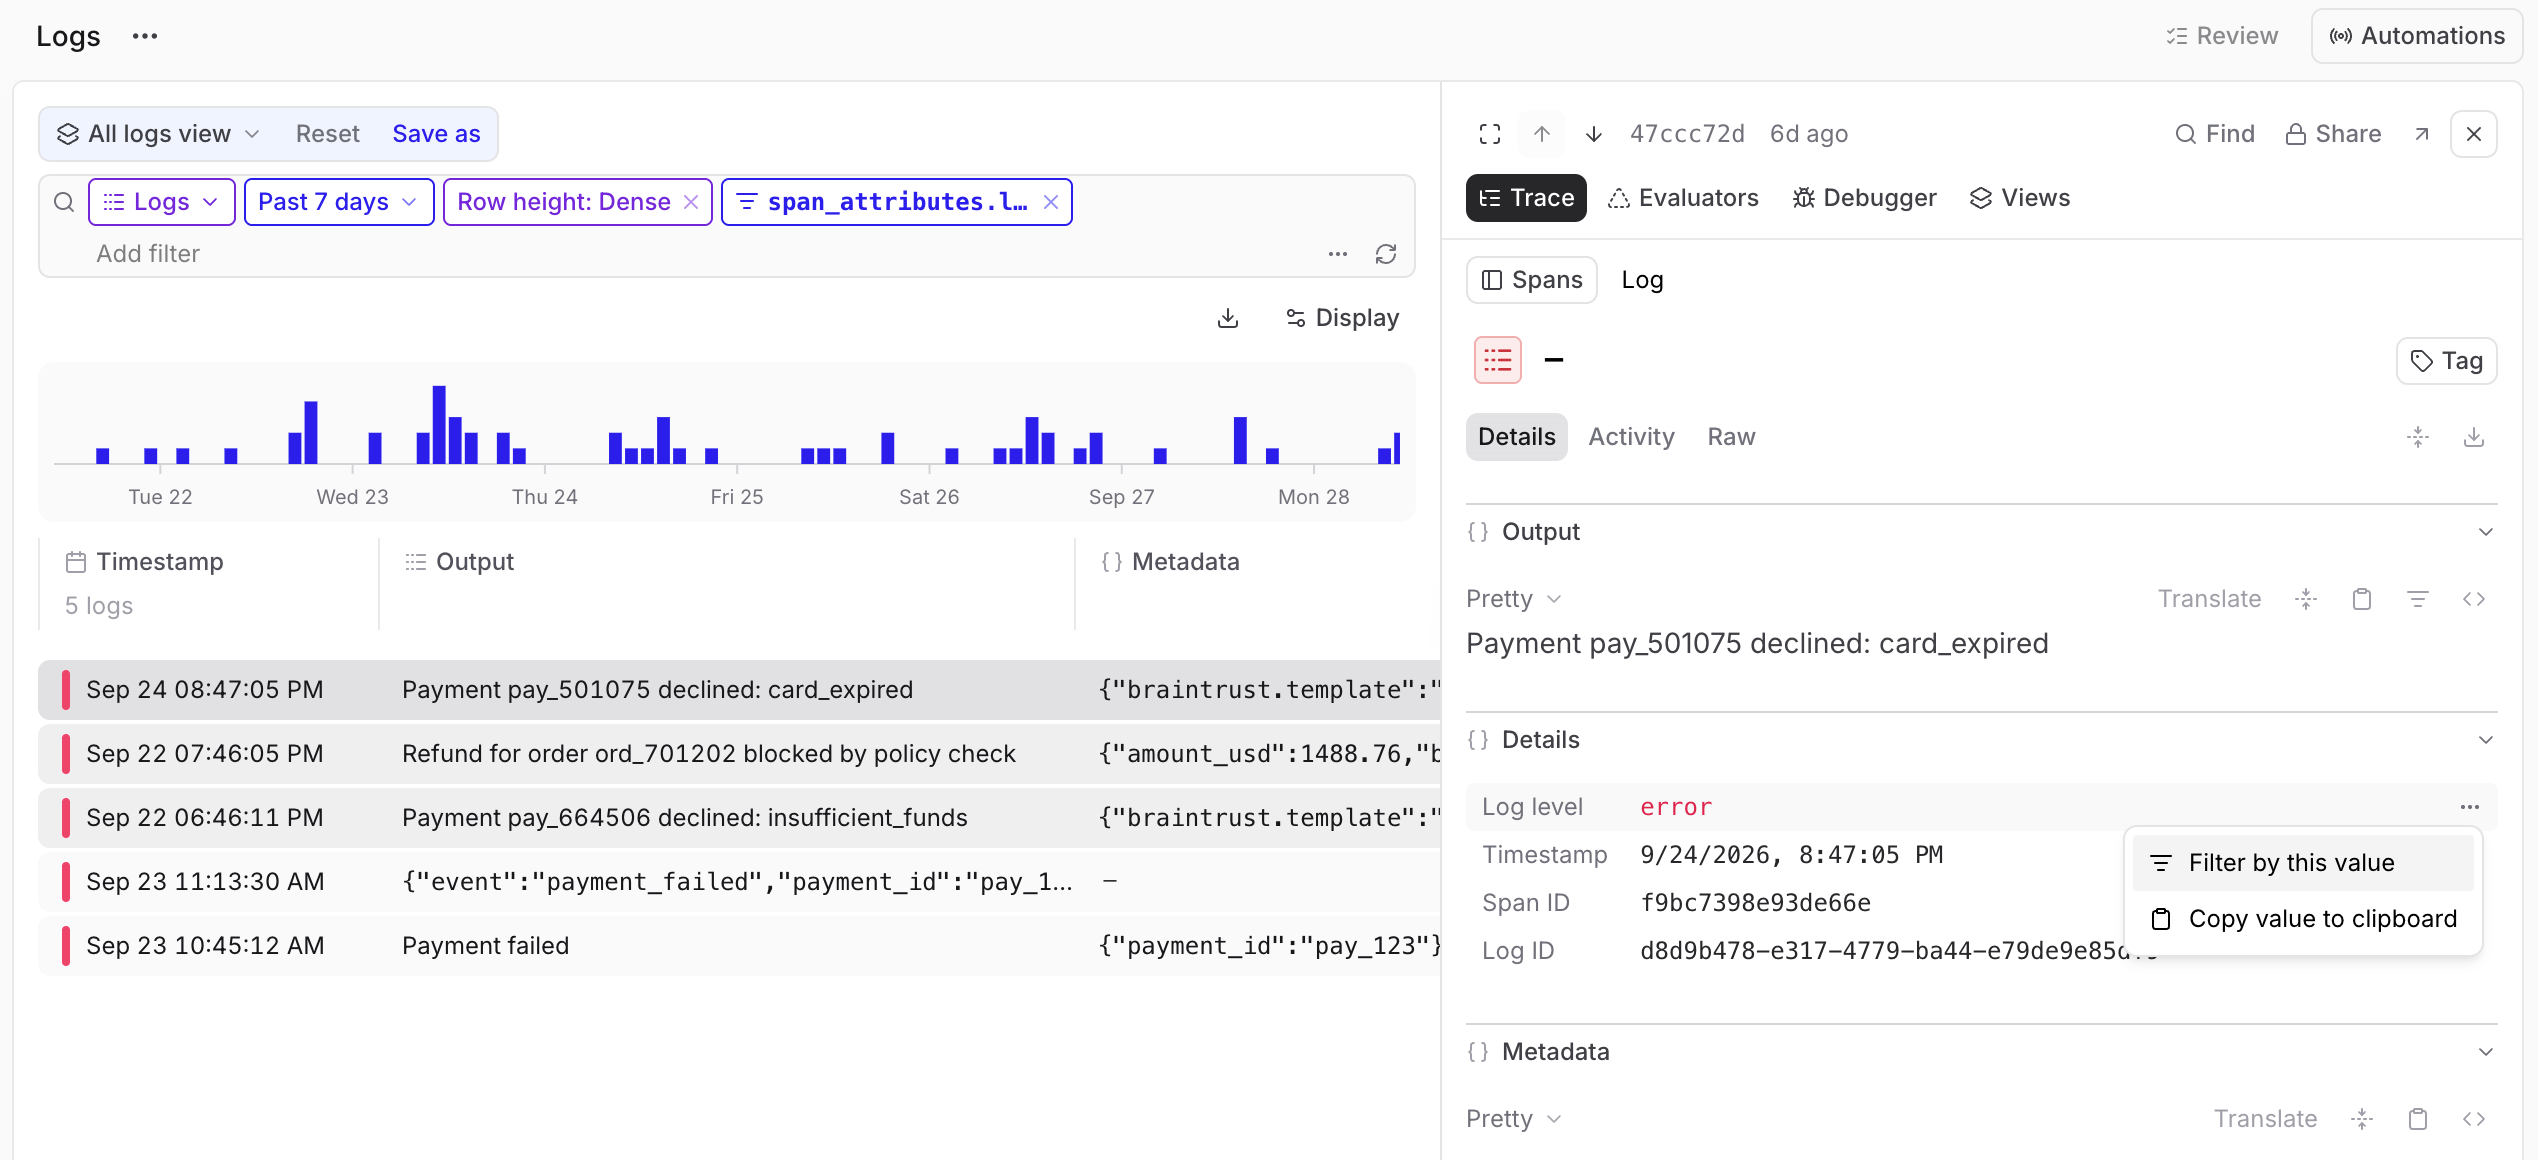
span_attributes.log_level = 'warn' or span_attributes.log_level = 'error'. Choose one to apply it.span_attributes.log_level value don’t match a severity filter.
View logs in a trace
- UI
- SQL
To inspect a message in context, select it in its trace’s hierarchy or Timeline. Log icons and timeline markers reflect the recorded severity, when present.Older messages can lack a preview in the trace hierarchy until you open them. The full message remains available in Output.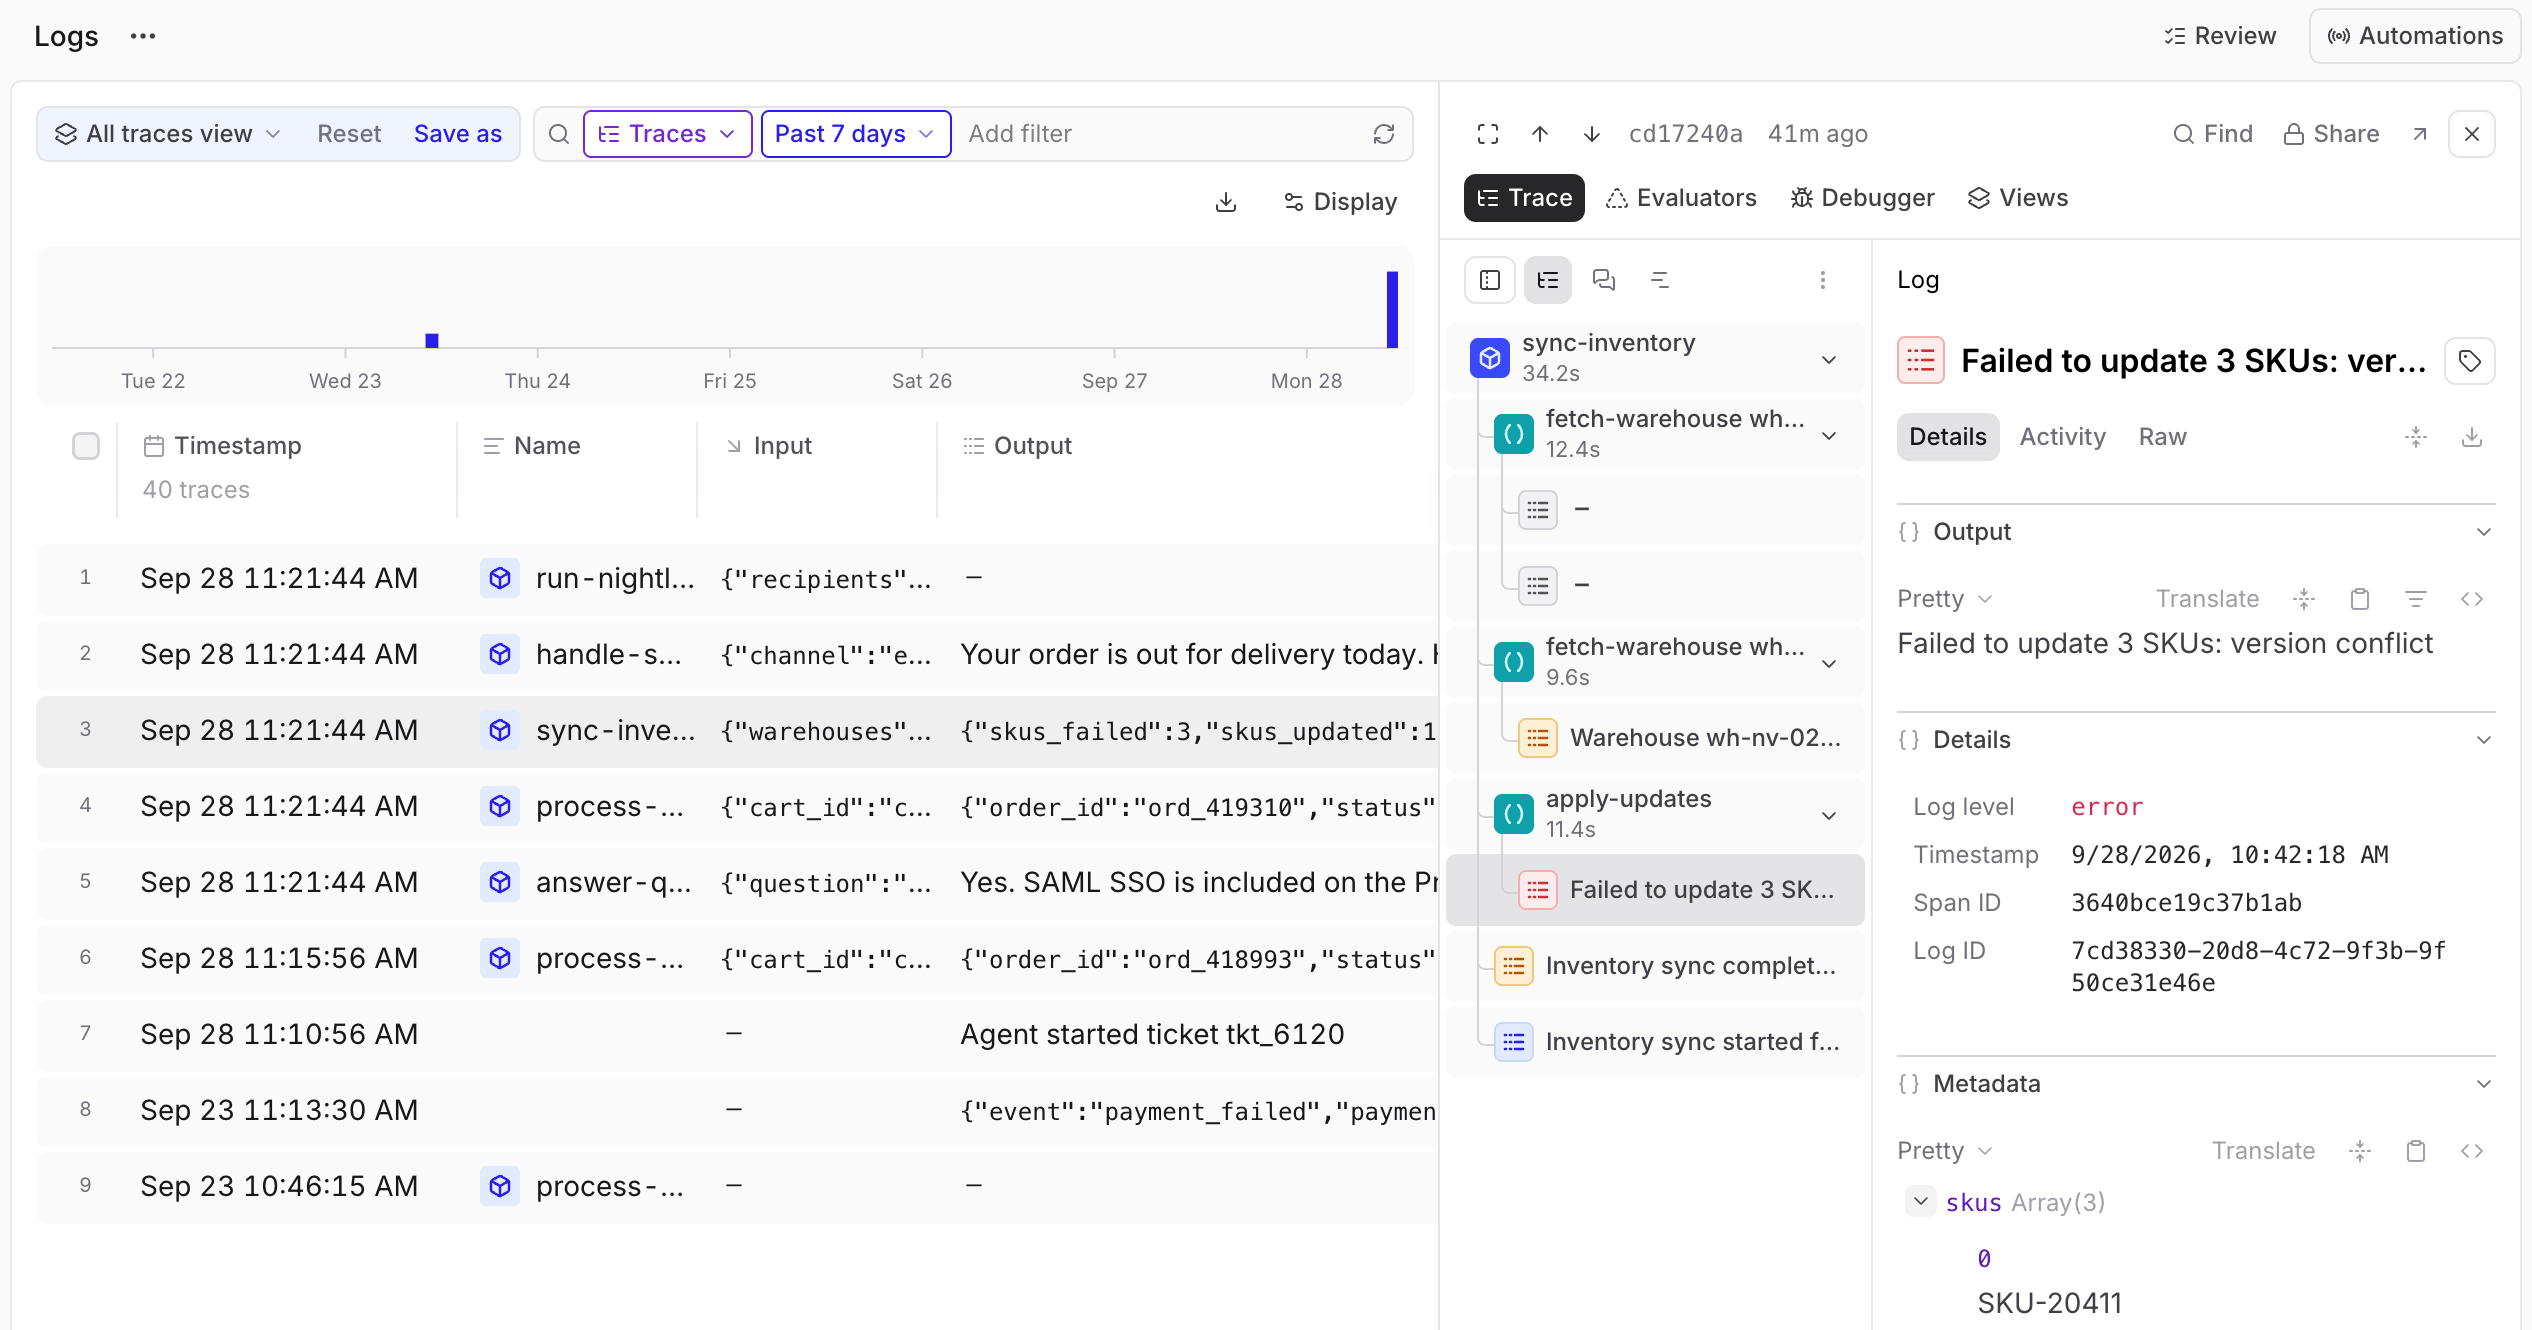
Next steps
- Filter and search to find records from a specific operation.
- Examine traces to inspect the operations surrounding a message.
- Send logs from the Python SDK to emit messages or forward
loggingrecords. - Configure OpenTelemetry to connect existing instrumentation to Braintrust.