Moonshot vs Fireworks for Kimi K3 frontend agents
 Jess Wang11 min
Kimi K3 is an open-weights model served through provider-specific APIs. Each provider chooses the inference engine, model revision, numerical precision, caching behavior, available capacity, and account limits. Those choices can change an agent's speed, reliability, and behavior even when the model family stays the same.
This evaluation compares Kimi K3 through Fireworks and Moonshot on direct response latency and a more complex frontend task. It extends an earlier Kimi K3 model comparison by holding the model family constant and changing the serving provider.
Methodology
Direct latency
I sent 30 streaming requests to each provider, one at a time within each provider block. The next request started after the previous response finished, avoiding competition for provider capacity between concurrent client requests. Time to first token, or TTFT, is the delay from sending a request until the first piece of the response arrives. Total time is the delay until the final streamed token arrives. The provider blocks ran in this order:
- Moonshot from 19:49:57 to 19:58:38 UTC
- Fireworks from 20:02:19 to 20:08:21 UTC
Every measured response reported 512 output tokens, which is the configured output cap. Both providers continued generating until the cap stopped them, so every timed response had the same generated length. This gives both providers the same amount of text to generate, making tokens per second and total response time directly comparable. The benchmark therefore measures forced-length generation. It does not measure when the models would naturally stop. This is the request shape that each provider received:
{
  "model": "<provider's Kimi K3 id>",
  "max_tokens": 512,
  "temperature": 1,
  "stream": true,
  "messages": [
    {
      "role": "user",
      "content": "Write a thorough technical explanation of the TCP three-way handshake."
    }
  ]
}
These direct timings measure one model response in seconds. The Figma-to-HTML evaluation measures the entire screenshot-to-Figma-to-HTML task in minutes, including many model calls, tool calls, rendering, retries, and local-machine conditions.
Figma-to-HTML task
The agent received a screenshot, recreated the page in Figma with MCP tools, and produced a self-contained HTML file from the Figma design. This task exercises repeated reasoning, tool selection, image understanding, code generation, and long-context API calls.
The dataset contains 20 curated Dribbble designs. I ran three trials per provider, giving 60 planned Fireworks runs and 60 planned Moonshot runs. Each Fireworks result is compared with Moonshot results for the same design. The Fireworks log contains 64 stored roots, of which 62 reached scoring. The final paired analysis uses the planned 60-run schedule, so each provider contributes three trials for each of the same 20 designs.
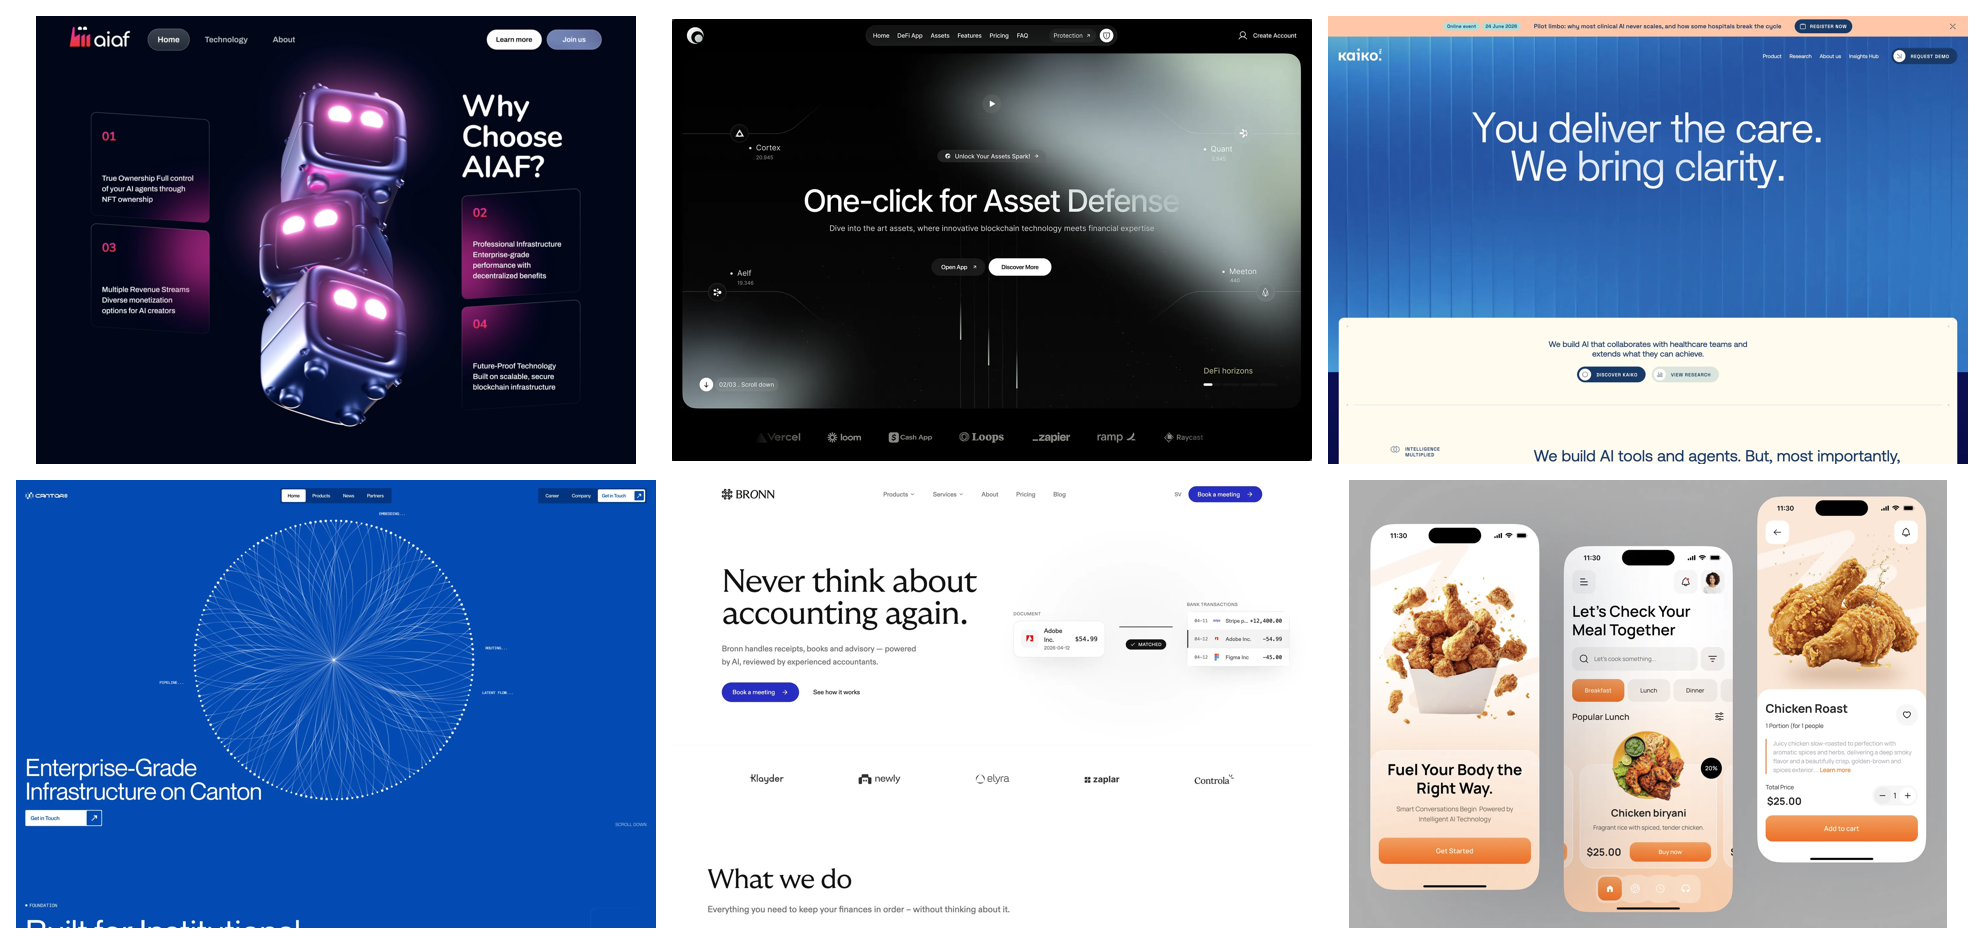
The agent received this task:
You are recreating a webpage from a screenshot, working
design-tool-first.

Read the reference screenshot first.

Required workflow:
1. Using your design MCP tools, recreate the page's design in the design tool,
   including its layout, text, colors, and styling.
2. Derive output.html from your design as a single self-contained HTML file
   with inline CSS and no external assets.

Step 1 is required. Finish only when output.html exists and is complete.
Provider configuration
The task prompt, dataset, Figma MCP tools, rendering path, temperature, agent version, and scoring code stayed the same across the final Fireworks and Moonshot schedules. The endpoint, provider model identifier, authentication, provider-specific headers, caching behavior, and account limits varied by provider.
| Setting | Moonshot | Fireworks |
|---|---|---|
| Endpoint | https://api.moonshot.ai/anthropic/ | https://api.fireworks.ai/inference/ |
| Requested model ID | kimi-k3 | accounts/fireworks/models/kimi-k3 |
| Temperature | 1 | 1 |
| Dataset | First 20 designs from dribbble-27 | Same |
| Trials per design | 3 | 3 |
| Scoring code | Same version | Same version |
| Agent | Claude Code 2.1.224 with trace integration 1.5.0 | Same |
| Account limits | Exact tier was not recorded | Serverless account with a payment method |
Proxy behavior
The direct latency benchmark called each provider endpoint without the local agent proxy. The Figma-to-HTML agent evaluation used a local proxy because Claude Code did not expose the temperature control required for the comparison.
For every agent request, the proxy set temperature to 1, supplied the provider credential, selected the provider base URL and model ID, and streamed the response back to Claude Code. The direct latency benchmark bypassed the proxy, so its TTFT, total-time, and tokens-per-second values are direct calls to each provider. The end-to-end agent duration includes the proxy's forwarding overhead. Both providers used the same proxy and agent harness.
Scoring and analysis
| Question | Measurement | Role in the analysis |
|---|---|---|
| Does provider change recreation quality? | Difference in average visual similarity for the same 20 designs | Primary quality question |
| Does provider change full agent duration? | Difference in average completion time for the same 20 designs | Secondary question |
| Does provider change tool behavior? | Difference in the share of parsed tool calls that completed without an error | Exploratory question |
Completed runs received four scores on a 0 to 1 scale.
| Scorer | Measurement | Limitation |
|---|---|---|
render_success | Whether Playwright rendered a non-blank page | A successful render does not measure visual quality |
visual_similarity | Rescaled CLIP ViT-B/32 cosine similarity | CLIP emphasizes semantic content and is not calibrated to exact layout fidelity |
recreation_faithfulness | Binary recognition judgment from gpt-4o | The judge was not calibrated against human labels and scores were near the ceiling |
tool_call_health | Fraction of parsed agent tool calls without an error | The scorer includes the parsed agent stream and is not limited to Figma calls |
The faithfulness judge saw the original first and the recreation second:
You are comparing two webpage screenshots.

Image 1 is the ORIGINAL webpage. Image 2 is an attempted RECREATION.

Would someone familiar with the original page recognize the recreation?

Judge overall layout, content hierarchy and placement, color scheme, and the
presence of the main sections. Ignore font-rendering differences, minor
spacing, and placeholder images.

Respond with JSON only:
{"faithful": "yes" | "no", "reason": "<1-2 sentences>"}
I first averaged the three trials for each provider and design. The provider difference then compares those 20 matched design averages.
For each paired quality score and duration measure, I tested whether the average Moonshot-minus-Fireworks difference was zero. A positive difference favors Moonshot, and a negative difference favors Fireworks. Visual similarity was the primary quality measure. Render success, faithfulness, tool-call health, and duration provide supporting evidence.
I calculated the 95% intervals with a paired two-stage bootstrap. It recalculated the provider difference 50,000 times from the completed results. Each calculation selected 20 designs with replacement, then selected three trials with replacement for each provider and design. The middle 95% of those 50,000 estimates form the reported interval. This captures variation across designs and repeated runs. Wider intervals indicate less precise estimates.
Each 95% interval shows the range of average differences compatible with these results. When an interval crosses zero, the data are consistent with a Fireworks advantage, a Moonshot advantage, or no average difference. For example, an interval from -0.058 to +0.054 includes small advantages for either provider. It does not establish that the providers are equivalent.
The unadjusted p-value estimates how often a difference at least this large would appear if the provider had no consistent effect across designs. I calculated it by checking every way the signs of the 20 design differences could be reversed.
I applied the Holm adjustment to account for testing five outcomes.
Results
- Fireworks returned the first token in a median 1.42 seconds, compared with 3.17 seconds for Moonshot. It also had lower total generation time and higher throughput in the sequential direct-request blocks.
- The paired Figma-to-HTML runs did not identify a reliable end-to-end duration advantage. Moonshot took 2.42 minutes longer per design on average, with a 95% interval from Moonshot taking 1.66 minutes less to 6.78 minutes more.
- The quality measures did not identify a reliable provider advantage. Moonshot had a slightly higher faithfulness estimate. Fireworks had slightly higher visual similarity and tool-call health estimates. Every adjusted p-value was 1.000.
Direct latency
| Provider | TTFT p50 [95% interval] | Total time p50 [95% interval] | Tokens/s p50 [95% interval] |
|---|---|---|---|
| Moonshot | 3.17 [2.51, 5.25] | 16.75 [16.29, 18.50] | 37.1 [36.6, 38.1] |
| Fireworks | 1.42 [0.87, 1.88] | 11.17 [10.51, 12.03] | 53.1 [50.6, 55.7] |
The p50 is the median request. The p95 marks the slower end of the distribution, where 95% of requests finished at or below that value. Each bracketed range is a 95% interval from resampling the observed requests. These intervals resample the 30 requests within each provider block.
Fireworks had lower median TTFT and total time than Moonshot in these blocks. Its TTFT p95 was 5.22 seconds, with a 95% interval from 3.18 to 17.03. Moonshot's TTFT p95 was 8.36 seconds [7.10, 9.06]. One Fireworks request took 17.03 seconds to return its first token.
End-to-end duration
Duration includes model calls, Figma MCP calls, HTML rendering, retries, and local-machine conditions. It measures the complete screenshot-to-Figma-to-HTML workflow in minutes. Direct TTFT and total time measure a single model response in seconds, so they are not interchangeable with end-to-end duration.
Fireworks had a per-run median of 11.2 minutes, and Moonshot had a per-run median of 13.2 minutes. After averaging three runs within each design, Moonshot took 2.42 minutes longer on average. The 95% interval ranged from Fireworks taking 1.66 minutes longer to Moonshot taking 6.78 minutes longer.
The unadjusted p-value was 0.207. After adjusting for the five comparisons in the analysis, it was 1.000. The sample does not resolve which provider has the shorter full-task duration.
Recreation quality
| Scorer | Fireworks [95% interval] | Moonshot [95% interval] | Difference [95% interval] | Unadjusted p | Adjusted p |
|---|---|---|---|---|---|
| render_success | 0.983 [0.933, 1.000] | 1.000 [1.000, 1.000] | +0.017 [0.000, +0.067] | 1.000 | 1.000 |
| visual_similarity | 0.762 [0.702, 0.815] | 0.758 [0.711, 0.802] | -0.004 [-0.058, +0.054] | 0.871 | 1.000 |
| recreation_faithfulness | 0.933 [0.833, 1.000] | 0.983 [0.933, 1.000] | +0.050 [-0.033, +0.167] | 0.500 | 1.000 |
| tool_call_health | 0.961 [0.944, 0.977] | 0.959 [0.944, 0.972] | -0.003 [-0.024, +0.020] | 0.781 | 1.000 |
The tick is the estimated Moonshot-minus-Fireworks difference after averaging each provider's three trials within each design. Values to the right of the dashed zero line favor Moonshot, and values to the left favor Fireworks. The band is the 95% confidence interval from the paired bootstrap, and when it crosses zero, the data remain compatible with a small advantage for either provider, so it does not establish a winner.
- Visual similarity was 0.004 lower for Moonshot. The interval ranges from 0.058 lower to 0.054 higher.
- Faithfulness was 0.050 higher for Moonshot. The interval permits a 0.033 Fireworks advantage or a 0.167 Moonshot advantage.
- Tool-call health was 0.003 lower for Moonshot. The interval ranges from 0.024 lower to 0.020 higher.
Limitations
- The direct latency blocks ran sequentially, with Moonshot first and Fireworks 18 minutes later. Changes in network conditions or provider load could look like provider differences. The results describe a short snapshot from one client machine and network.
- Every direct request generated to the 512-token cap. The benchmark compares equal-length responses and does not measure when the models would naturally stop.
- The 30 direct requests contain too few rare slow responses to estimate tail latency precisely. The 17.03-second Fireworks outlier could reflect network conditions, provider queueing, or another service-side event.
- The provider model IDs do not establish that both APIs served the same Kimi K3 weight revision or numerical precision. The exact Moonshot account tier was not recorded, and the comparison does not isolate any one infrastructure choice.
- The Figma-to-HTML schedules ran at different times. Most Fireworks roots ran earlier on August 7, while Moonshot ran from 13:11 to 21:08 UTC. Future runs should interleave provider trials within each design.
If you are choosing a serving stack for an agent, benchmark the request shape and account configuration you plan to use. Measure direct latency separately from the complete task, then pair repeated task runs so you can distinguish a real provider difference from variation in the work itself.
You can run a serving-stack comparison like this by rotating provider order, storing the request and proxy configuration, and pairing repeated runs by task. Sign up for free to run the eval, or book a demo to review the setup.
Subscribe to the Department of Evals
A newsletter for unfiltered thoughts on eval methodology, analysis, and failures
Subscribe