Agent observability captures every step an AI agent takes, including tool calls, reasoning chains, state transitions, memory reads and writes, and model responses. It records the execution sequence behind a single user request, so engineers can see what the agent did and why.
Traditional APM can show that a request returned a 200, but it cannot show that the agent looped twice, called the wrong tool, or hallucinated a billing policy. In production, agent failures often stay invisible until a customer reports the issue.
Implementing agent observability requires the following:
- Structured tracing across LLM calls, tool invocations, and memory operations
- Nested spans that preserve parent-child relationships across multi-agent handoffs
- An evaluation layer that scores production traces and feeds failures back into the eval suite
Braintrust brings structured tracing, nested agent spans, and production trace scoring into one workflow. The free tier includes 1M trace spans and 10k evaluation scores per month.
What is agent observability?
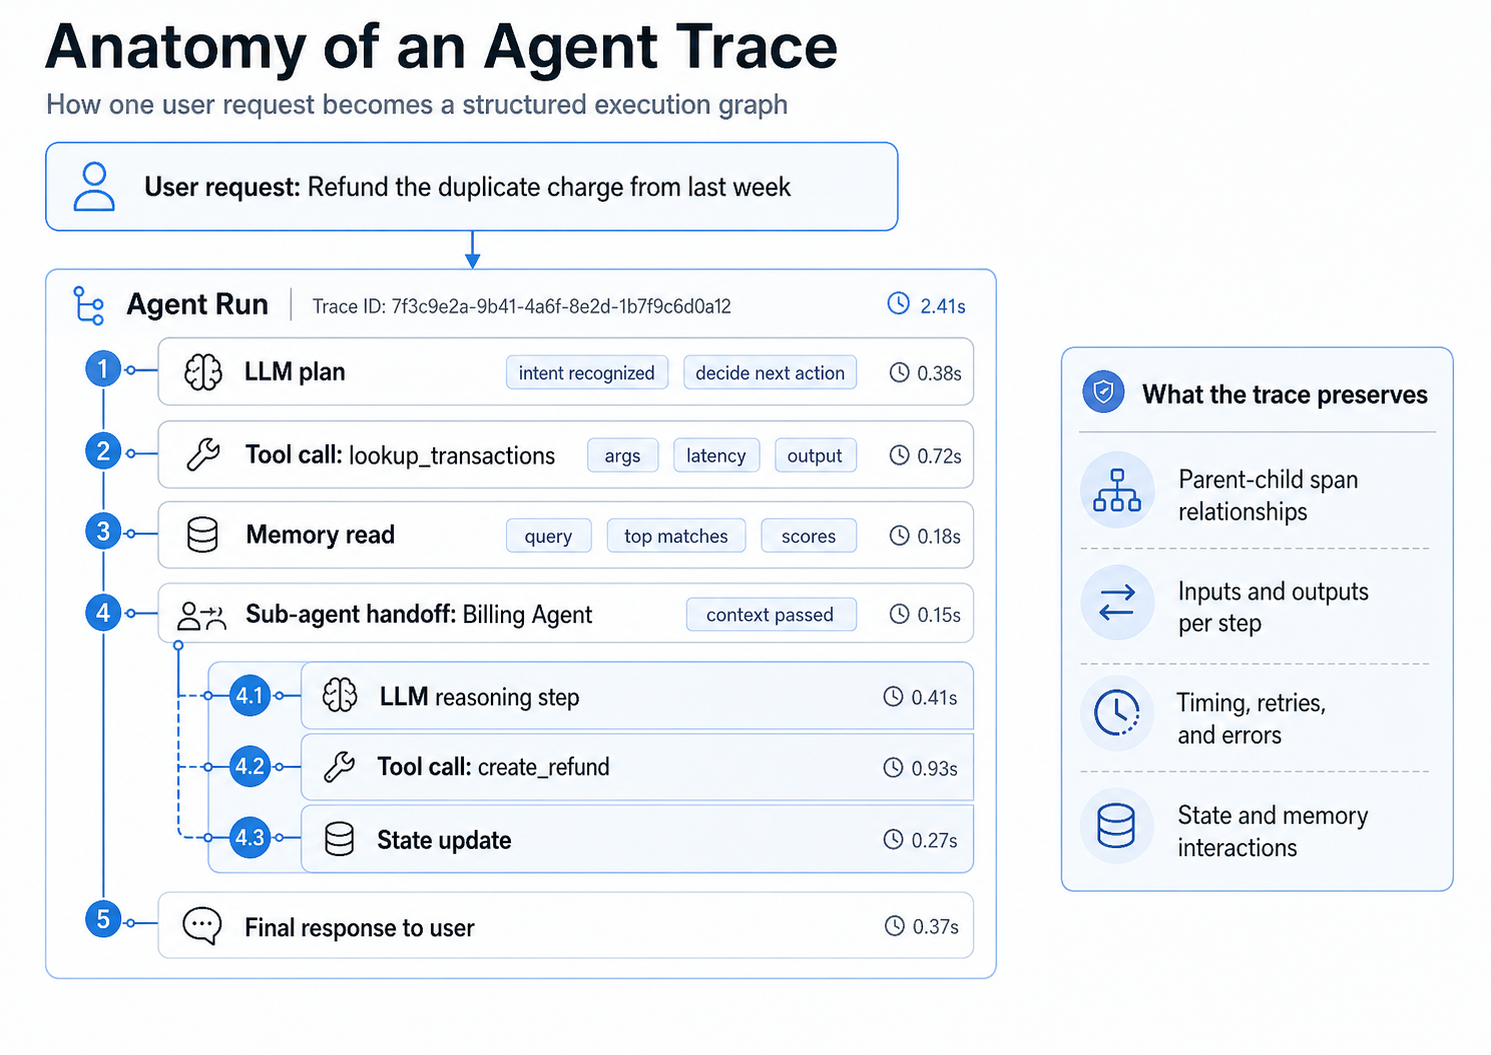
Agent observability is the practice of capturing every step an AI agent takes during execution, including tool selection, tool arguments, model responses, memory reads, memory writes, state transitions, and decision branches. The output is a structured trace that lets you reconstruct what the agent did, in what order, and with what inputs and outputs at each step.
Agent observability sits one layer above traditional observability. Datadog and New Relic capture infrastructure signals like request rate, latency percentiles, and span counts. Application logging captures arbitrary developer-defined events. Agent observability captures the agent's semantic behavior, including which tool it picked, what arguments it passed, what came back, and how the next reasoning step changed in response.
Four pillars make up an agent trace:
- Tool calls: Name, arguments, return values, latency, retries.
- Reasoning steps: Intermediate chain-of-thought, plan-act-observe transitions, branches.
- State transitions: Working memory before and after each step, session-level context.
- Memory operations: Reads, writes, semantic search hits, retrieval scores, and freshness.
For a more detailed guide to tool-call and memory-tracing patterns, see the agent observability deep dive on tracing tool calls and memory.
Why traditional observability falls short for agents
Traditional APM and logging stacks were designed for deterministic services where the same input produces the same output, every call follows a known code path, and a 200 response is a strong signal that the request succeeded. AI agents break each of those assumptions. The same prompt can produce different tool calls on different runs, the execution path branches based on model output, and a 200 response can wrap a confidently wrong answer.
| Concern | Traditional APM | Application logging | Agent observability |
|---|---|---|---|
| What it records | Request rate, latency, error rate, span counts | Developer-defined events and messages | Tool calls, reasoning steps, state, memory ops |
| Failure signal | HTTP error or timeout | Exception or warning string | Wrong tool, wrong arguments, drifted plan |
| Silent failures | Looping agents can still look healthy | Events lack reasoning context | Trace shows the loop, retry, or wrong branch |
| Debugging unit | Service or endpoint | Log line | End-to-end agent run |
A traditional dashboard can confirm that the agent service is up. It cannot confirm that the agent picked the right tool, passed the right arguments, retrieved the right memory entry, or stayed on the original plan. Agent observability fills that gap by treating every step in the agent run as a typed, inspectable span.
The four pillars of agent observability
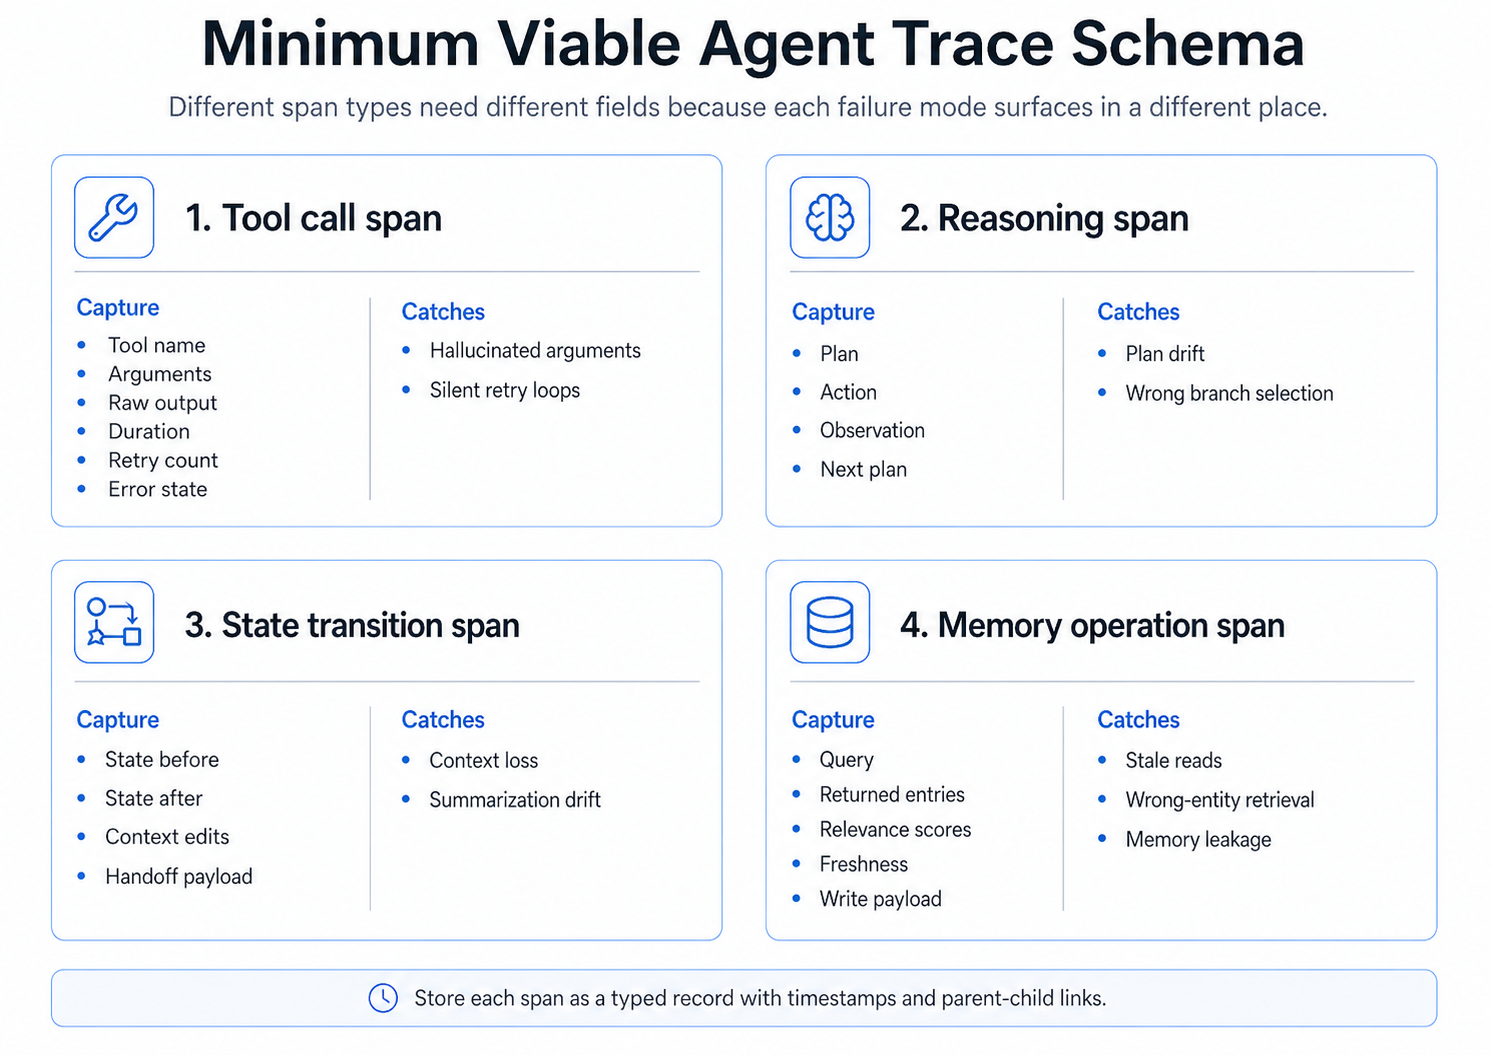
Production agents fail in patterns that map directly to four span types. A minimum viable agent trace schema captures one span type per failure mode, so the surface where the failure shows up is also the surface where you fix it.
1. Tool-call spans
Agents act on the world through tool calls. Each tool span should record the tool name, arguments, raw output, duration, retry count, and error state. Without that data, hallucinated arguments and silent retry loops blend into normal traffic.
2. Reasoning spans
Reasoning spans capture the model's plan, the action it picked, the observation it made, and what it decided to do next. These spans surface plan drift and wrong-branch selection that a single LLM span cannot show.
3. State transition spans
Agents carry working memory across steps. State transition spans record the state before and after each step, including context edits and handoff payloads. They catch context loss and summarization drift that quietly degrade longer runs.
4. Memory operation spans
Memory spans capture reads and writes to long-term stores, including the query, returned entries, relevance scores, and freshness. They expose stale reads, wrong-entity retrieval, and memory leakage between users that no aggregate metric will surface.
Together, these four span types form a structured record of the agent's behavior. Each span is typed with timestamps and parent-child links, so a single trace shows the full execution graph for one user request.
Implementing agent observability across frameworks
Most production teams run a mix of frameworks: OpenAI Agents SDK for newer features, LangGraph for graph-based control flow, Mastra for TypeScript-first stacks, Pydantic AI for type-safe Python agents, and custom in-house orchestrators that predate any of the above. A workable instrumentation strategy has to span all of them without forcing a rewrite.
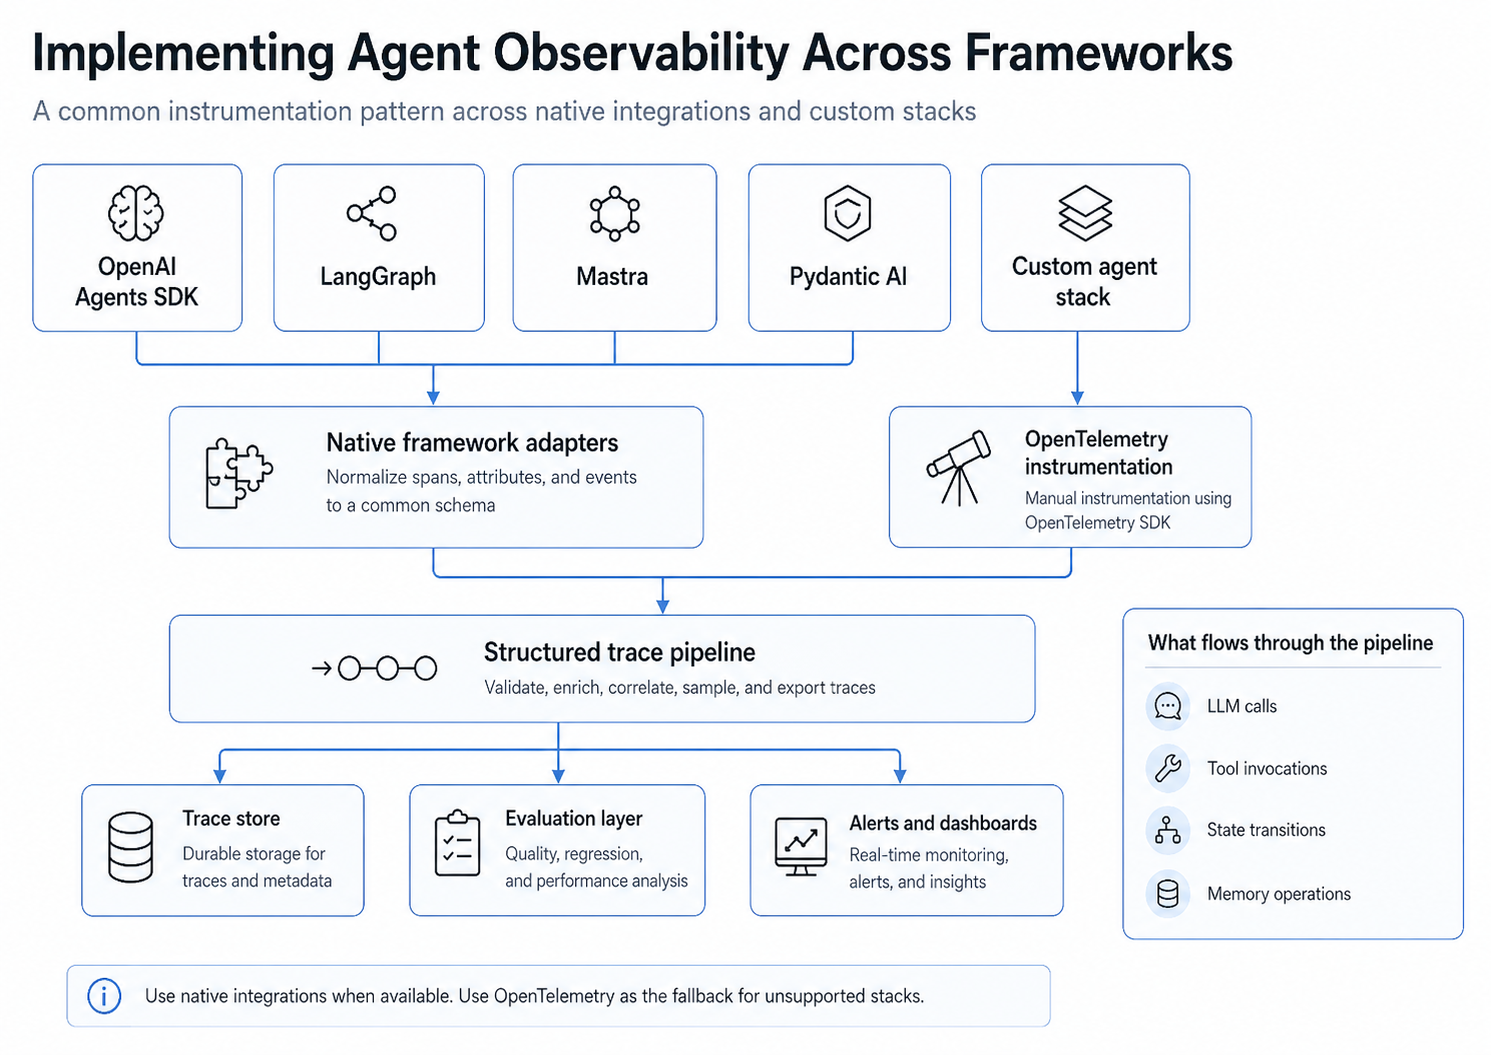
The pattern is consistent across stacks. Native framework adapters normalize spans, attributes, and events into a common schema. For unsupported frameworks, OpenTelemetry instrumentation using the OpenTelemetry SDK provides a fallback path. Both routes feed into a structured trace pipeline that validates, enriches, samples, and exports traces to a trace store, an evaluation layer, and alerts and dashboards.
LangGraph (Python)
import braintrust
from braintrust_langchain import BraintrustCallbackHandler, set_global_handler
from langgraph.graph import StateGraph

braintrust.init_logger(project="My Project")

handler = BraintrustCallbackHandler()
set_global_handler(handler)

graph = StateGraph(AgentState)
graph.add_node("plan", plan_node)
graph.add_node("act", act_node)
graph.add_edge("plan", "act")

app = graph.compile()
result = app.invoke({"input": "Refund the duplicate charge from last week"})
Each LangGraph node becomes a nested span under the parent agent run, so plan and act steps stay linked across the full execution.
Mastra (TypeScript)
initLogger({ projectName: "My Project" });

const assistant = new Agent({
  name: "assistant",
  instructions: "You are a helpful assistant.",
  model: wrapLanguageModel({
    model: openai("gpt-4o"),
    middleware: BraintrustMiddleware(),
  }),
  tools: { lookupTransactions, createRefund },
});

const wrappedAgent = wrapMastraAgent(assistant, { span_name: "assistant" });
const result = await wrappedAgent.generateVNext(
  "Refund the duplicate charge from last week",
);
Wrapping the Mastra agent produces nested spans for the agent run, each tool call, and each underlying LLM request, so every step in the agent's execution graph stays inspectable.
OpenTelemetry fallback
For custom or unsupported frameworks, the BraintrustSpanProcessor converts standard OpenTelemetry spans into structured agent traces. Teams that already export OTEL spans to a backend can add Braintrust as an additional exporter without changing existing instrumentation.
How to design a minimum viable agent trace schema
The trace schema is the contract between the agent and every downstream consumer: the debugging UI, the evaluation layer, the alerting system, and any analytics on top. A small, opinionated schema is easier to enforce and easier to evaluate against than a free-form log.
A minimum viable schema records, for each step:
- Span type: tool call, reasoning, state transition, or memory operation.
- Inputs: structured arguments, queries, or prior state.
- Outputs: raw return value, retrieved entries, or new state.
- Timing: start time, end time, and duration.
- Errors and retries: typed error state, retry count, and parent retry context.
- Identifiers: trace ID, parent span ID, session ID, and user or tenant ID.
Storing each step as a typed record with timestamps and parent-child links keeps the trace queryable. Engineers can filter by tool name, span type, error class, or session, instead of grepping through unstructured logs.
Multi-agent observability: parent-child spans across handoffs
Multi-agent systems compound the single-agent failure modes with one new class: handoff failures, where Agent A passes incomplete or incorrect context to Agent B and Agent B continues based on wrong assumptions. Without cross-agent tracing, the team debugging Agent B's output cannot see that the root cause was upstream.
The fix is parent-child span propagation across agents. The handoff payload is recorded as a span on the parent agent's trace, the receiving agent's run is nested under that handoff span, and the same trace ID flows through both agents. The result is a single trace that shows the planning agent, the handoff payload, the sub-agent's tool calls, and the final response in one view.
Treat each agent boundary as a logical service boundary. Log the inputs, outputs, and timing of every handoff, the same way you would log a remote procedure call between two services.
Connecting observability to evaluation
Tracing without evaluation tells you what the agent did. It does not tell you whether what the agent did was correct. Production agent quality requires online evaluation that scores live traces and offline evaluation that runs the agent against a curated dataset before deployment.
- Online evaluation attaches scorers to live production traces. LLM-as-a-judge checks, custom scorers, and rule-based assertions catch quality regressions as they happen, not after a customer complaint.
- Offline evaluation runs the agent against a curated set of golden cases. The same evaluation definitions run locally, in CI, and in production, so quality checks stay consistent across environments.
The feedback loop matters as much as either side on its own. Production traces that fail an online scorer are converted into eval cases, the eval suite grows from real user behavior, and future regressions are caught automatically. The GitHub Action runs evals on every pull request, blocking merges that drop quality below a configured threshold.
How Braintrust supports agent observability
Braintrust connects tracing, evaluation, and release control into a single workflow. Each capability supports a specific stage of the agent observability pipeline, from capturing the full execution graph to enforcing quality gates in CI.
Native framework integrations: Braintrust ships SDK wrappers for OpenAI Agents SDK, LangGraph, Mastra, Pydantic AI, LangChain, CrewAI, and Vercel AI SDK. Wrapping the framework instance produces structured agent traces with no manual instrumentation. The full list of SDK integrations covers more than 20 frameworks.
OpenTelemetry support: The BraintrustSpanProcessor converts OTEL spans into structured agent traces. Teams that already export OpenTelemetry data can add Braintrust as an additional exporter.
Nested agent spans: Tool calls, reasoning steps, state transitions, and memory operations each appear as typed spans nested under the parent agent run. Engineers can open any trace and inspect the full decision path from initial request to final response.
Online evaluation on production traces: Inline scorers and LLM-as-a-judge checks run on live traces, so quality regressions surface as they happen. Production failures convert into eval cases in one click.
Loop: Braintrust's AI assistant for evaluation development understands natural language instructions and acts directly on production trace data. Teams can describe the failures they want to investigate, and Loop analyzes traces, generates evaluation datasets, and recommends custom scorers.
Brainstore: Braintrust's data store built for AI workloads supports fast queries across millions of agent traces, including large nested trace trees and high-cardinality observability data.
CLI: The bt CLI provides a terminal workflow for querying logs, running evals, and integrating Braintrust into existing CI/CD pipelines.
Production release enforcement and trace-to-eval workflows: The GitHub Action runs evals on every PR, posts results to the pull request, and blocks merges when a change degrades agent quality. Production traces convert into reusable eval cases, so the eval suite grows from real failures.
Notion, Stripe, Vercel, Zapier, Airtable, and Instacart use Braintrust for production AI observability and evaluation. Notion increased issue triage from 3 issues per day to 30 by using Braintrust's observability and eval workflows.
Start using Braintrust for free — the free tier includes 1M trace spans and 10k evaluation scores per month.
Agent observability platform comparison
The platforms below all offer some form of agent observability. The differences show up in how completely each one captures multi-step agent behavior, how directly it connects observability to evaluation, and how it handles enterprise security requirements.
| Capability | Braintrust | LangSmith | Arize Phoenix | Datadog LLM Observability |
|---|---|---|---|---|
| Native agent framework integrations | OpenAI Agents SDK, LangGraph, Mastra, Pydantic AI, LangChain, CrewAI, Vercel AI SDK | LangChain and LangGraph first-class; others via OTEL | OpenAI, LangChain, LlamaIndex via OTEL | OpenAI, LangChain via APM SDKs |
| Tool-call tracing | Tool calls captured as nested spans automatically through SDK wrappers, and calls can be traced with the tool() decorator | Tool spans available for LangChain and LangGraph runs | Tool spans available through OpenInference instrumentation | Tool spans surface as APM resources |
| Multi-agent / handoff spans | Parent-child spans propagate across agent boundaries | Nested runs supported within LangChain and LangGraph | Supported via OpenInference span links | Limited — relies on standard APM trace context |
| Online evaluation on traces | Inline scorers and LLM-as-a-judge run on live traces | Online evaluators on traces | Phoenix evals run on traces | Out-of-the-box quality monitors |
| Cost tracking | Per-span estimated cost and trace-level rollups | Per-call token and cost tracking | Token-based cost tracking rolled up to traces | Token cost as APM metric |
| CI/CD integration | GitHub Action with PR-level quality gates | LangSmith CLI and CI runners | Phoenix CI helpers | Datadog CI Visibility |
| Self-hosting | Hybrid and fully self-hosted on Enterprise — see self-hosting | LangSmith self-hosted on Plus / Enterprise | Open-source self-host available | Self-host via Datadog Private Locations |
| Enterprise security | SOC 2 Type II, HIPAA, GDPR, encryption options, RBAC | SOC 2 Type II, GDPR, RBAC | Depends on deployment | SOC 2 Type II, HIPAA, GDPR, RBAC |
| Free tier | ✅ Available — 1M trace spans and 10k eval scores per month | Free tier with capped traces | Open-source | Paid product, no free tier |
LangSmith is the strongest option inside the LangChain ecosystem. Phoenix is a good fit for teams that want an open-source, OpenTelemetry-first stack. Datadog covers the operational observability surface but provides limited support for agent-specific concepts. Braintrust focuses on the trace-to-eval workflow, where production failures become eval cases and CI gates enforce quality before release.
How to roll out agent observability without a six-month project
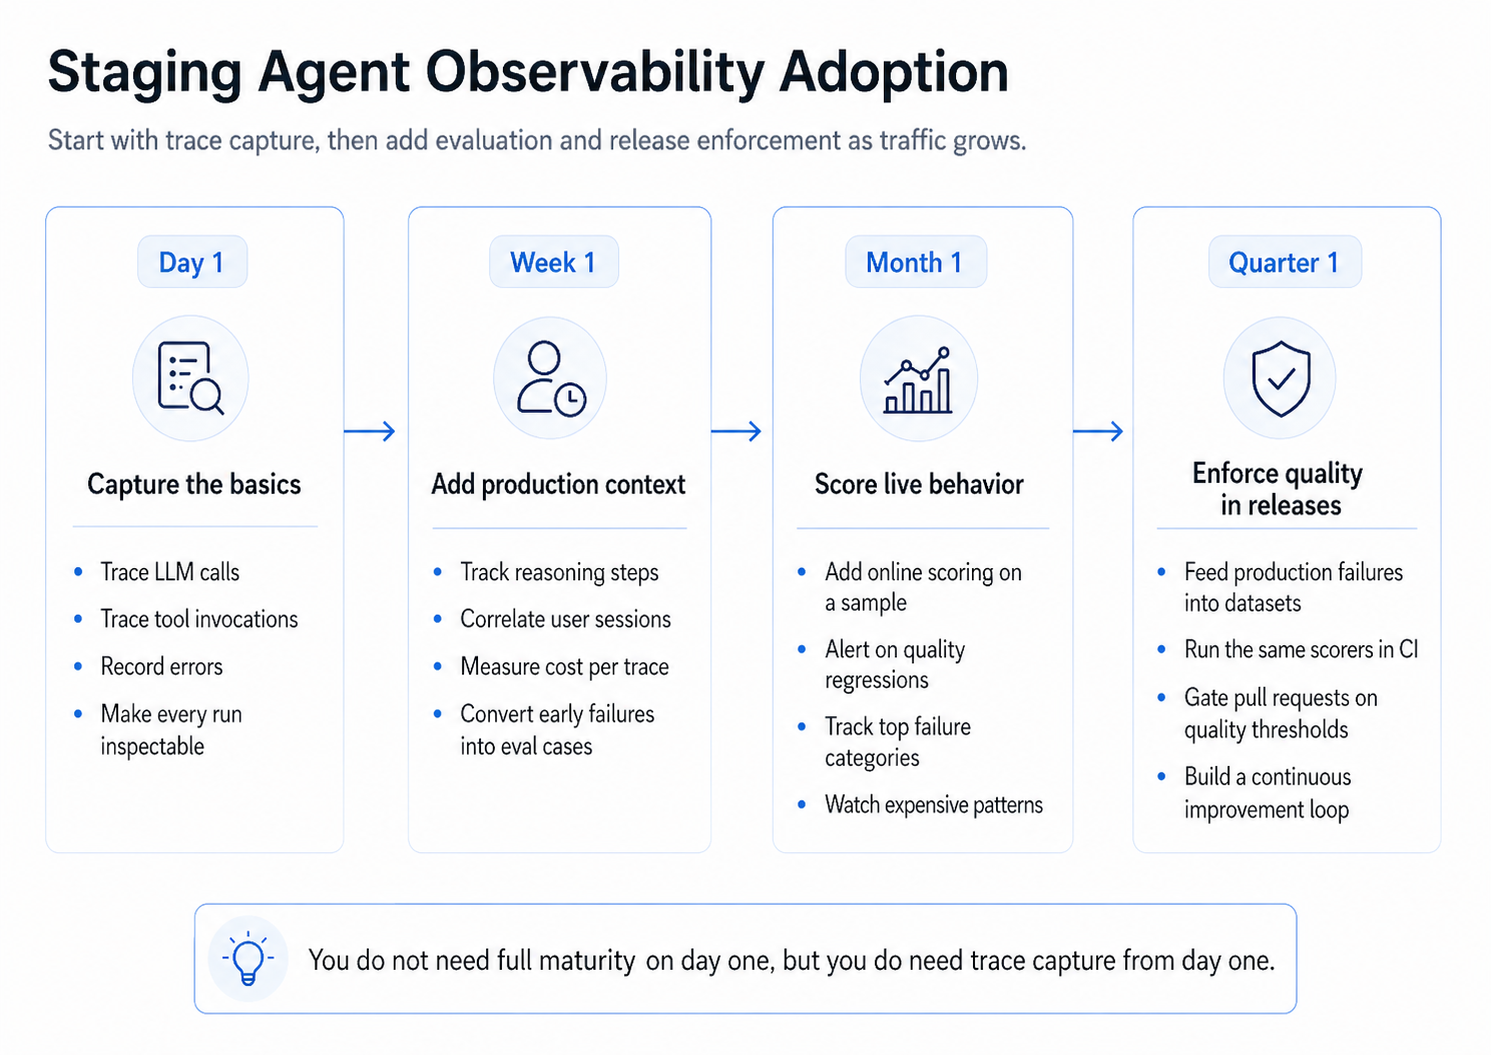
Most teams do not need full multi-agent maturity on day one. They need basic visibility across the agent on day one and a clear path to add evaluation, alerting, and release enforcement as production traffic grows.
A practical adoption path:
- Day 1: Capture the basics. Trace LLM calls and tool invocations, record errors, and make every run visible. The free tier covers this stage with no procurement loop.
- Week 1: Add production context. Trace reasoning steps, correlate user sessions, measure cost per trace, and convert early failures into eval cases.
- Month 1: Score live behavior. Add online scoring on a sample of traces, alert on quality regressions, track top failure categories, and watch expensive workflow patterns.
- Quarter 1: Enforce quality in releases. Feed production failures into datasets, run the same scorers in CI, gate pull requests on quality thresholds, and build a continuous improvement loop where every regression becomes a test.
The order matters. Trace capture is the foundation that every later stage depends on, but evaluation and release enforcement are where the cost of agent failures actually drops.
Conclusion
Agent observability is the layer of telemetry that captures how an AI agent reasons, acts, and adjusts across a multi-step workflow. Traditional APM dashboards and unstructured logs cannot show that an agent picked the wrong tool, drifted from its plan, or retrieved stale memory. A typed trace schema with tool-call, reasoning, state, and memory spans makes those failure modes visible, and connecting that trace data to evaluation turns one-off debugging into a continuous quality loop.
Braintrust brings tracing, evaluation, and release enforcement into one workflow, so teams can inspect real agent runs, score live production traces, convert failures into eval cases, and block regressions in CI. Start using Braintrust for free — the free tier includes 1M trace spans and 10k evaluation scores per month, which is enough to instrument live traffic from day one.
Agent observability FAQs
What is agent observability?
Agent observability is the practice of capturing every step an AI agent takes during execution, including tool calls, reasoning steps, state transitions, and memory operations. The output is a structured trace that lets engineers reconstruct what the agent did, in what order, and with what inputs and outputs at each step.
How is agent observability different from LLM observability?
LLM observability tracks a single model call, including the prompt, response, token usage, and latency. Agent observability tracks the full workflow behind a request, including multiple LLM calls, tool use, memory access, sub-agent handoffs, and decision branches, and connects those steps into a single execution path.
Why is traditional APM not enough for AI agents?
Traditional APM measures request rate, latency, and error rate. An agent that loops, calls the wrong tool, or hallucinates an answer can still return a 200 response within normal latency, so APM reports a healthy system while agent quality drops. Agent observability adds the semantic context APM does not capture, so engineers can inspect failures rather than guess at them from aggregate metrics.
How do I implement agent observability across agent frameworks?
Use native framework adapters where they exist — for OpenAI Agents SDK, LangGraph, Mastra, Pydantic AI, LangChain, CrewAI, and Vercel AI SDK — and use OpenTelemetry instrumentation as the fallback for custom or unsupported stacks. Both routes should produce traces that conform to the same schema so the downstream evaluation and alerting layers do not need framework-specific logic.
How does agent observability connect to evaluation?
Online evaluation attaches scorers to live production traces, so quality regressions surface as they happen. Offline evaluation runs the agent against a curated dataset of golden cases before deployment. The feedback loop converts production failures into eval cases, and CI gates block merges that degrade quality. Braintrust connects tracing, online and offline evaluation, and CI enforcement in one workflow.
What is the easiest way to start with agent observability?
Start with trace capture: instrument LLM calls and tool invocations, record errors, and make every run inspectable. Once traces are flowing, add online scoring on a sample of traffic, then convert recurring failures into eval cases, then run the same scorers in CI to gate releases. Braintrust's free tier covers the first stage with 1M trace spans and 10k evaluation scores per month.