- Braintrust - Best overall debugging platform. Evaluation-first architecture that turns production failures into permanent test cases with one click, with Topics classification that surfaces recurring failure modes across all traffic and CI/CD quality gates that block regressions before they ship.
- Maxim AI - Agent simulation and multi-evaluator debugging for cross-functional teams testing scenarios before production.
- Langfuse - Open-source tracing and prompt management with self-hosting for teams that need data control.
- Arize Phoenix - OpenTelemetry-native tracing with embedding clustering for teams that want vendor-agnostic debugging.
- Helicone - Proxy-based observability for teams debugging cost spikes and latency issues across providers.
- Agenta - Open-source, self-hostable platform that pairs trace inspection with full-trace evaluation and team annotation.
- Galileo - Automated failure detection with high-volume production safety checks.
Most agent failures do not trigger visible errors because the system still returns a successful status code even when the result is wrong. An agent may retrieve the wrong document, select the wrong tool, or pass incorrect parameters, and traditional monitoring will only show that the request completed. It does not record how the agent moved from one step to the next, which makes it difficult to trace or reproduce the issue.
Debugging an AI agent means inspecting the full execution path of a request and identifying the specific step that caused the incorrect outcome, including tools that expose model calls, tool usage, and intermediate decisions, so teams can understand what happened and prevent the same issue from reaching production again.
This guide explains how debugging AI agents differs from traditional monitoring and observability, and reviews the best tools that support the full debugging workflow, from reconstructing execution paths to preventing regressions before production.
What is AI agent debugging?
Agent debugging is the process of tracing, isolating, and resolving failures in multi-step AI agent workflows running in production. Traditional software debugging relies on stack traces and error codes, but agent failures rarely produce either. An agent might misinterpret retrieved context, call the wrong API, or hallucinate a response, all while returning a clean response to the user.
Effective agent debugging requires reconstructing the full execution path across every model call, tool invocation, and retrieval step so teams can see exactly what the agent did for a specific request. Once the full path is visible, teams identify the step that caused the incorrect behavior, reproduce the issue in a controlled environment, apply a fix, and convert the failure into a permanent evaluation case that prevents the same regression from shipping again.
A debugging workflow is incomplete without evaluation. Fixing a production issue solves the immediate problem, but only adding that failure to an automated evaluation suite ensures it won't recur. Teams that ship stable AI products connect debugging, evaluation, and CI gating into a single process so every resolved failure becomes a test that protects future releases.
Debugging vs. monitoring vs. observability
Debugging, monitoring, and observability often get used interchangeably, but they describe different levels of visibility into your agent's behavior. Understanding how debugging, monitoring, and observability differ helps you pick the right tool for the problem you are trying to solve.
| Criteria | Monitoring | Observability | Debugging |
|---|---|---|---|
| Primary question | "Is the system healthy?" | "What is happening inside the system?" | "Why did this specific request fail, and how do I fix it?" |
| Scope | Aggregate metrics like uptime, latency, error rates, and cost | Request-level traces showing the full execution path of each agent run | Step-level root-cause analysis with replay, diffing, and regression prevention |
| Typical output | Dashboards and alerts | Trace trees with inputs, outputs, and timing for every span | Isolated failure steps, reproducible test cases, and CI/CD quality gates |
| When you need it | You want to know if something is broken | You want to understand how your agent behaves across requests | You want to find exactly why a request failed and prevent it from happening again |
The 7 best tools for debugging AI agents in production (2026)
1. Braintrust
Best for: Teams scaling LLM applications who want production failures to automatically strengthen their eval suite and block bad releases before they impact customers.
Not for: Teams that only need basic request logging without evaluation workflows.
Braintrust unifies the entire agent debugging lifecycle into a single workflow, so production failures move quickly from diagnosis to prevention. Teams can trace the issue, isolate the failing step, validate a fix, convert the incident into a permanent eval case, and enforce it in CI before the next deployment. Each failure becomes a guardrail that improves reliability and reduces release risk over time.
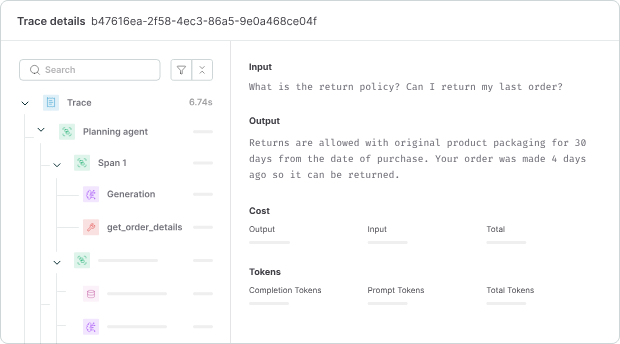
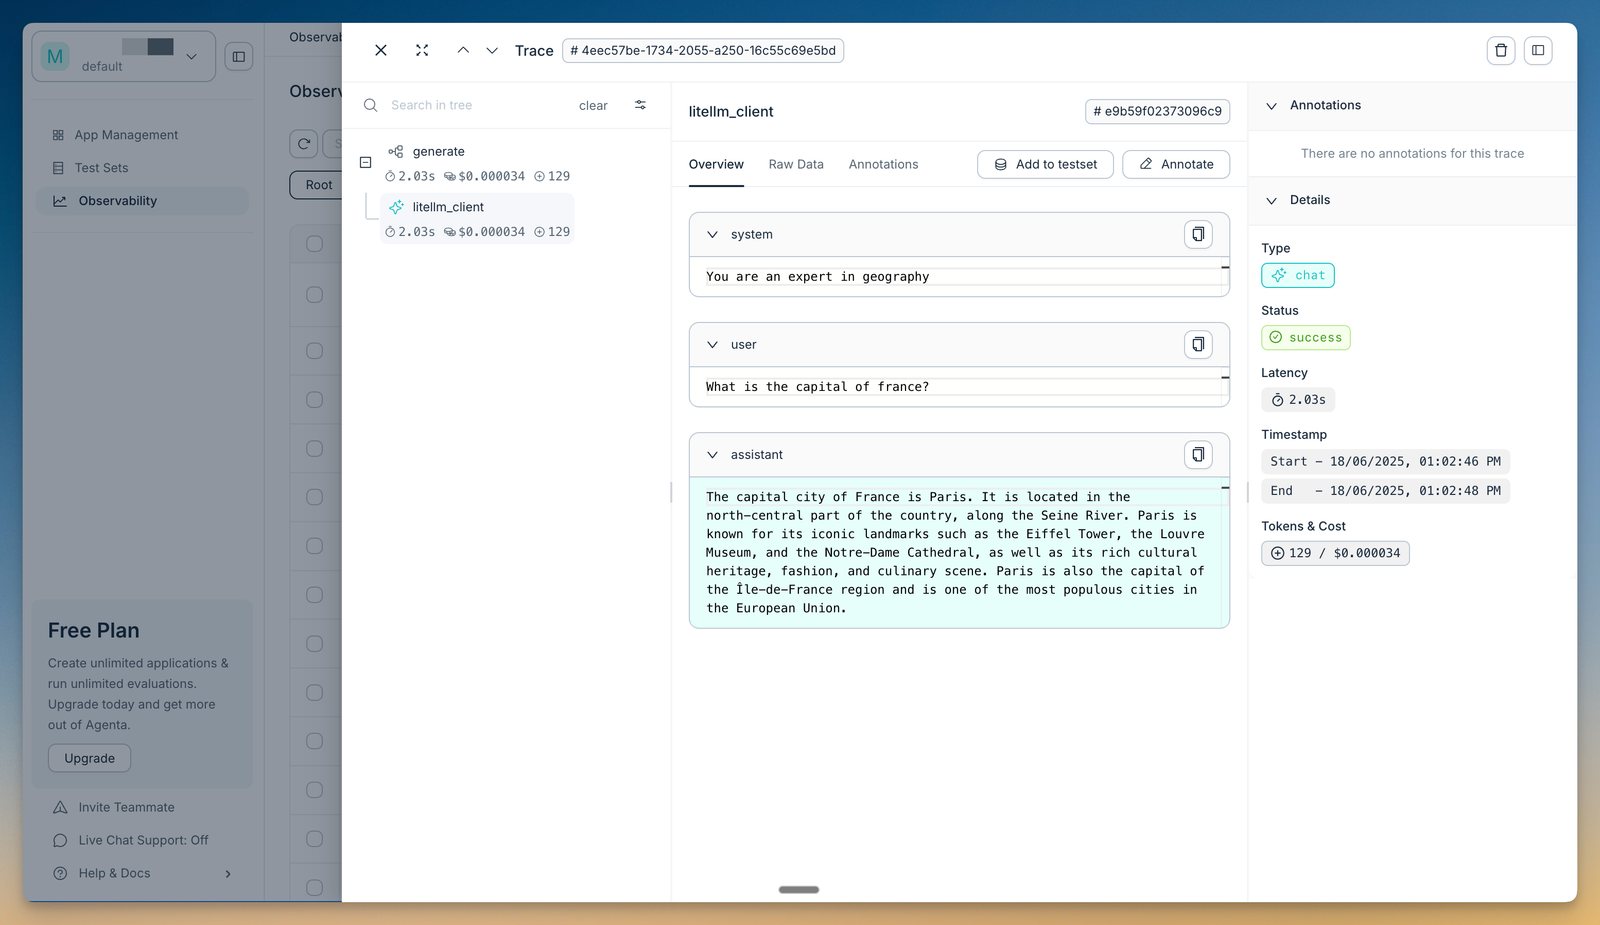
Reconstructing the full decision path
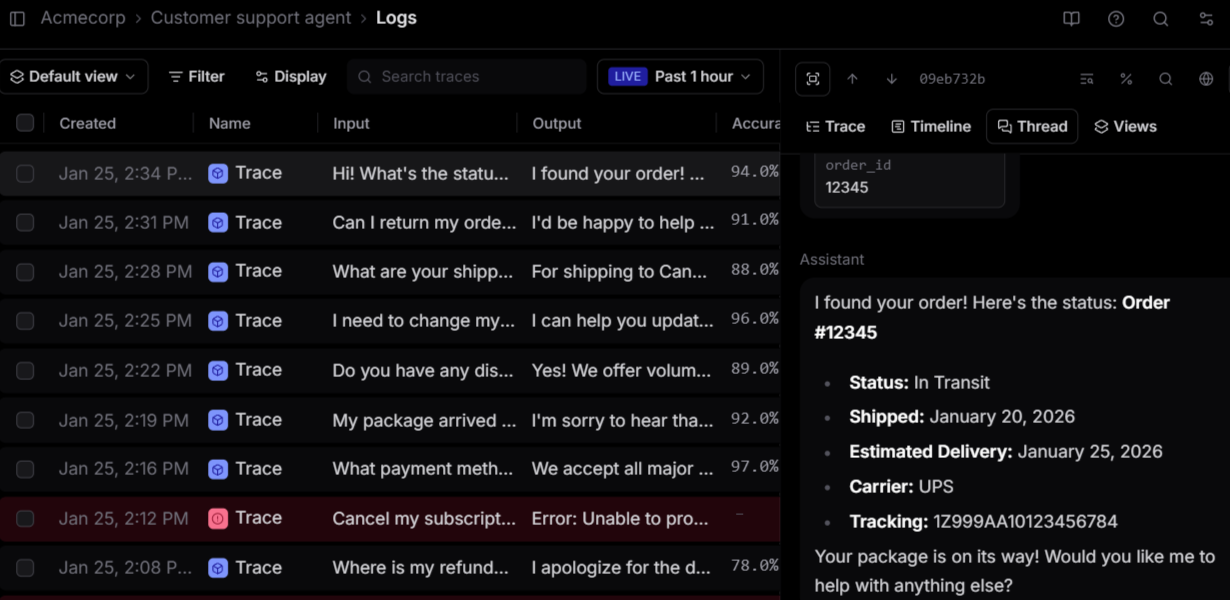
When an agent produces a bad output, you need to see every step it took to get there. Braintrust captures complete traces across model calls, tool invocations, and retrieval steps in an expandable tree of nested spans, where each span shows inputs, outputs, timing, cost, and evaluation scores.
Brainstore, Braintrust's trace query engine, is optimized for AI trace data and loads results significantly faster than general-purpose databases. Faster queries translate directly into less time spent filtering through a week of production traffic to find the failure pattern you need to isolate.
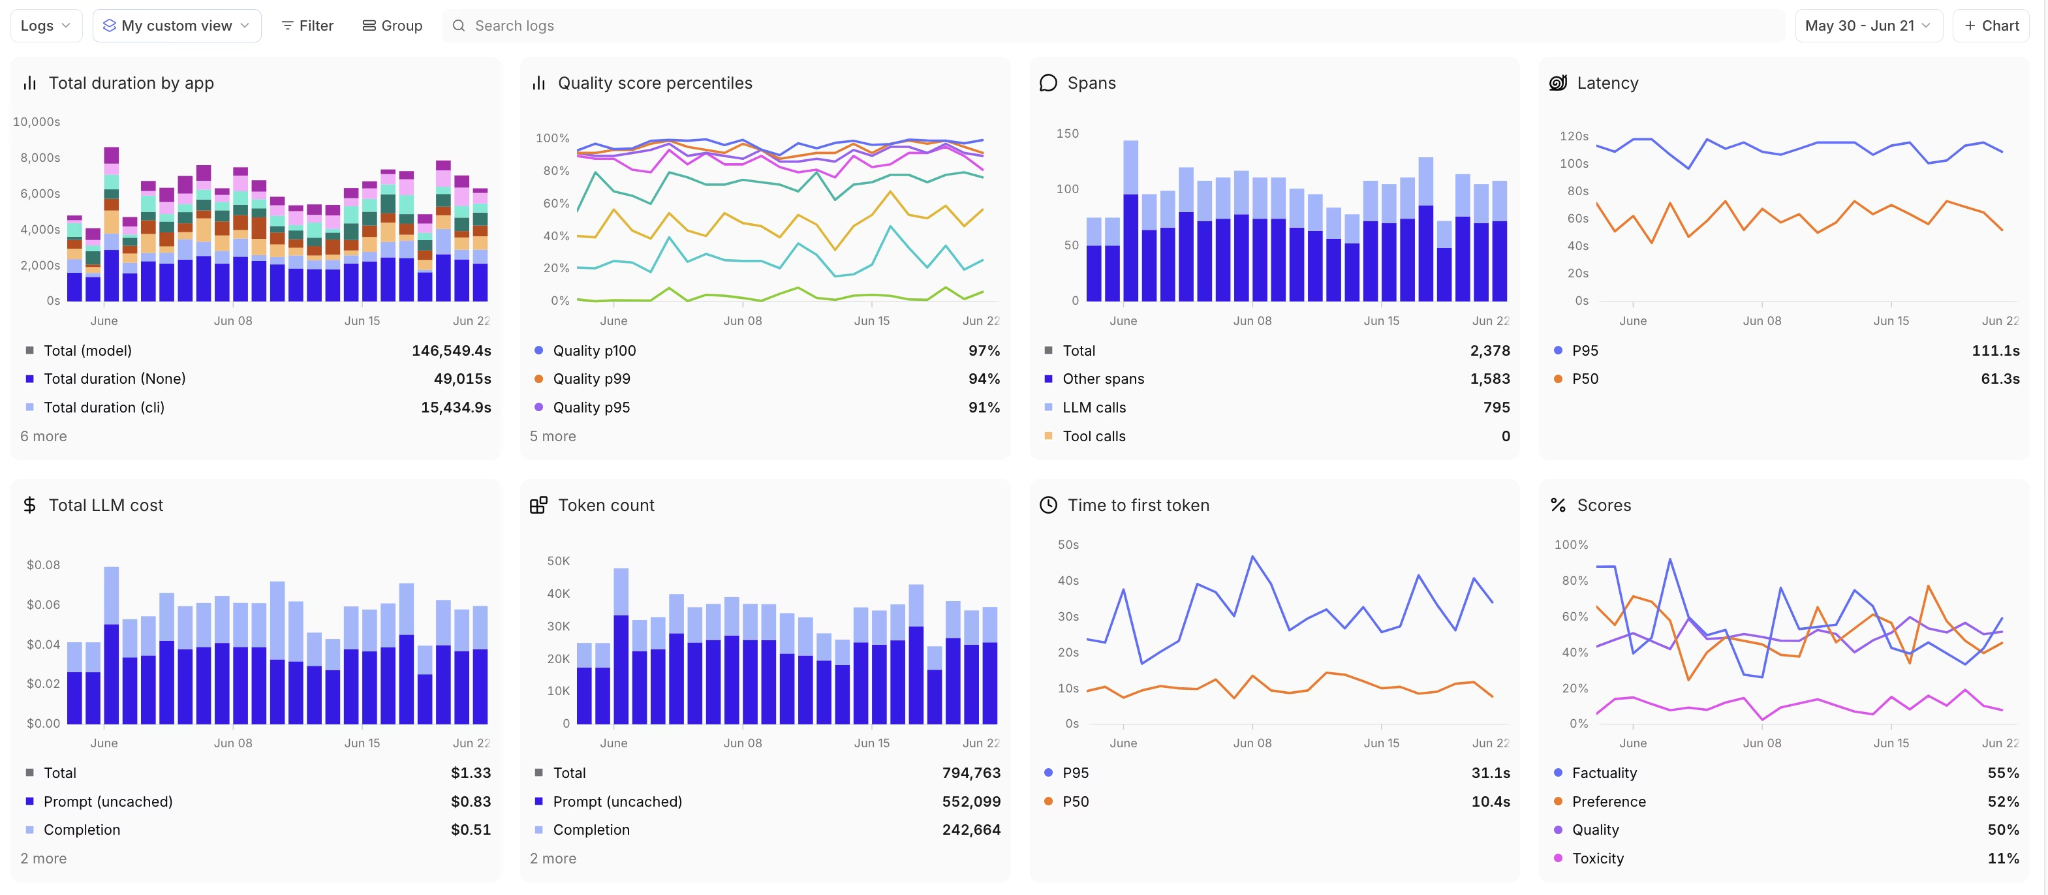
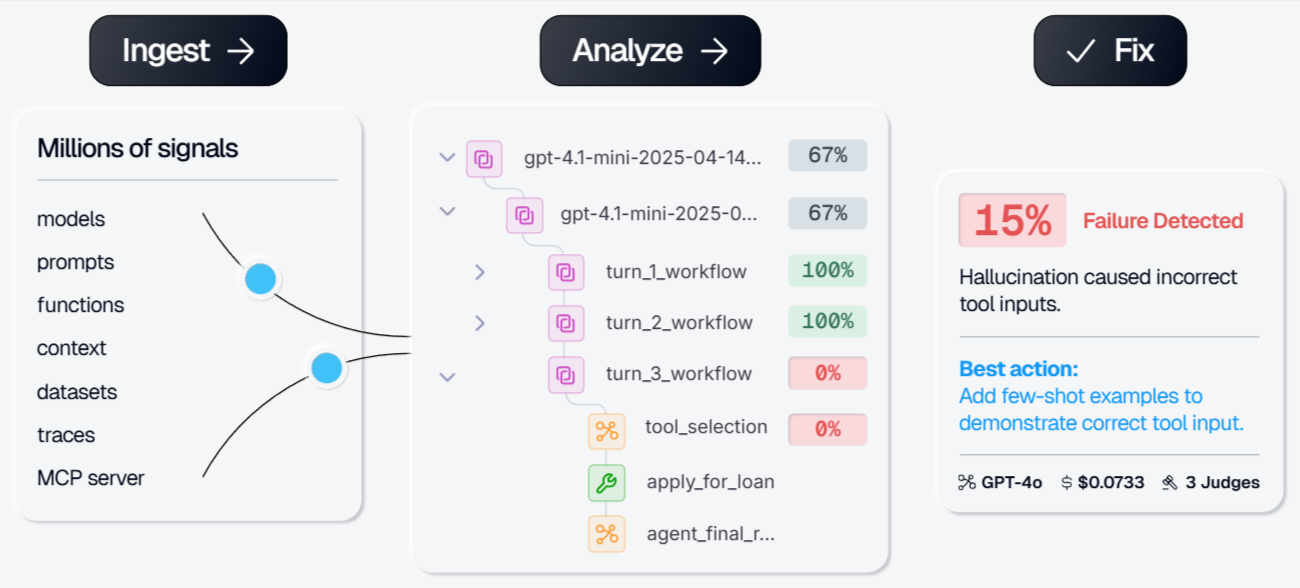
Categorizing failures at scale by dimension
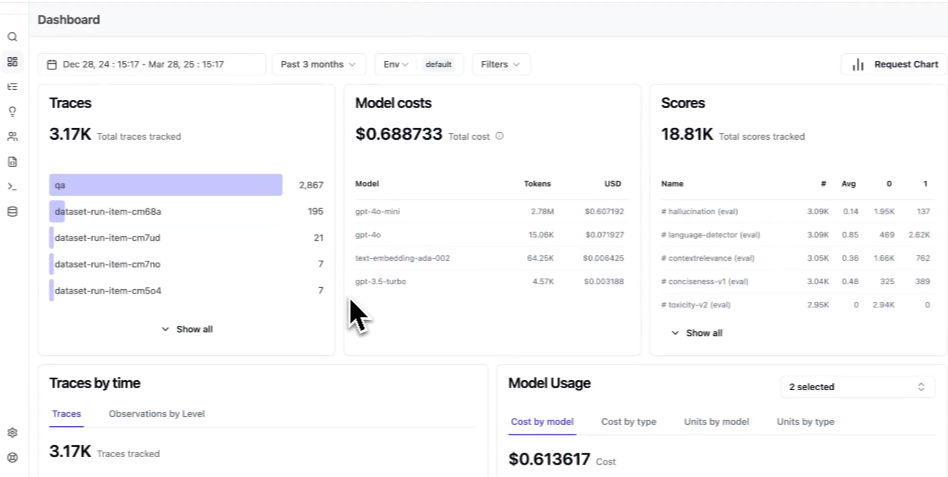
Inspecting one trace at a time isolates a single failure. Debugging at scale means finding which failures recur and where they concentrate. This is what Braintrust calls active observability: rather than leaving you to query dashboards, it surfaces the patterns worth acting on across high-volume traffic on its own. Topics runs a daily classification pipeline that labels every production trace by three built-in facets (Task, which captures the user's intent; Sentiment; and Issues), plus any custom facet you define, such as a churn-risk level or a specific tool-failure category. Each classification is written back to the logs, so you can filter, query with SQL like classifications.Issues.label = "Empty tool output", and rank which failure modes dominate production traffic.
Because the labels apply to every run rather than only the ones a detector flags, recurring problems surface as ranked clusters across all traffic, and the matching traces promote into a dataset for the trace-to-eval workflow below.
Turning failures into repeatable eval cases
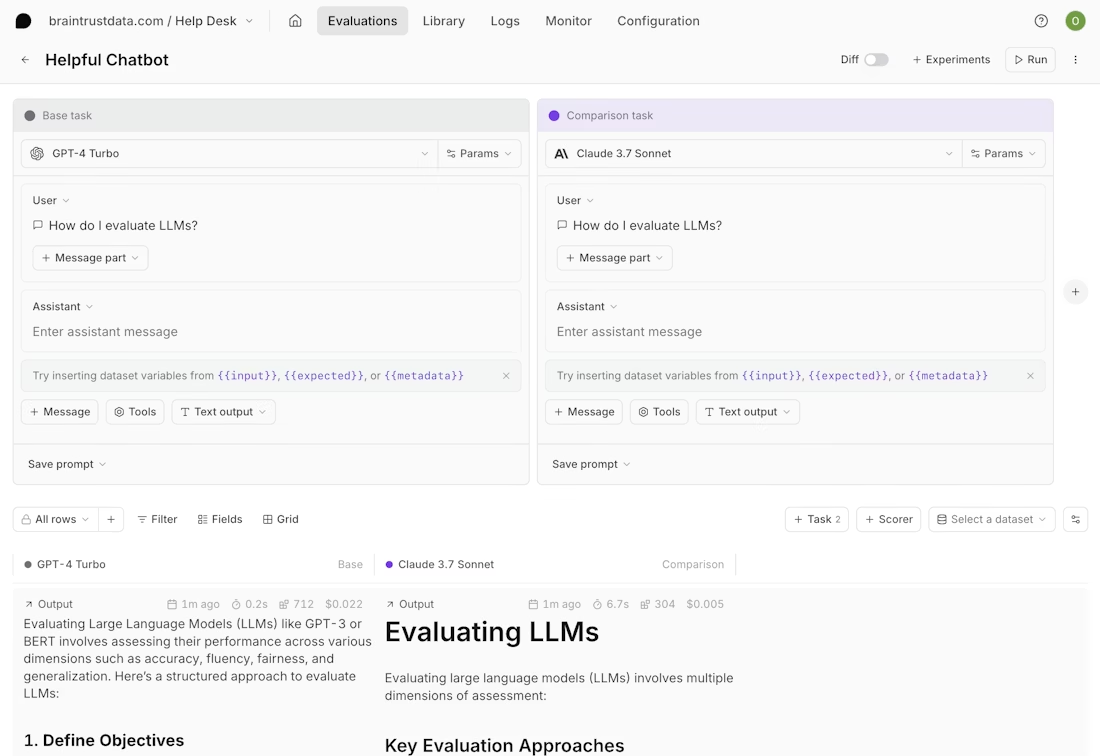
Once the failing step is identified, the trace can be loaded into Braintrust's Playground and re-run against the exact production inputs, tool calls, intermediate steps, and model configuration that triggered the failure. Unlike generic prompt tools that test prompts in isolation, the Playground preserves full execution context, so changes to prompts, parameters, routing logic, or tool responses are validated under the same real conditions. Results can be compared side by side to confirm the issue is fully resolved and does not introduce new regressions.
After fixing, add the failure with the fix as a permanent eval case to your dataset with one click. That eval case now runs on every future code change, which means the same failure cannot ship again. Without trace-to-eval conversion, teams fix individual failures but have no mechanism to prevent the same class of failure from recurring in the next deployment.
Gating deployments with CI/CD quality checks
Eval cases only prevent regressions if they actually run before code ships. Braintrust's native GitHub Action runs the full eval suite on every pull request and posts the results directly as PR comments. If quality scores drop below the configured thresholds, the merge is blocked. This automated gating replaces manual QA review for prompt and model changes, ensuring that every deployment is validated against the growing library of real production failures.
Shared debugging context for PMs and engineers
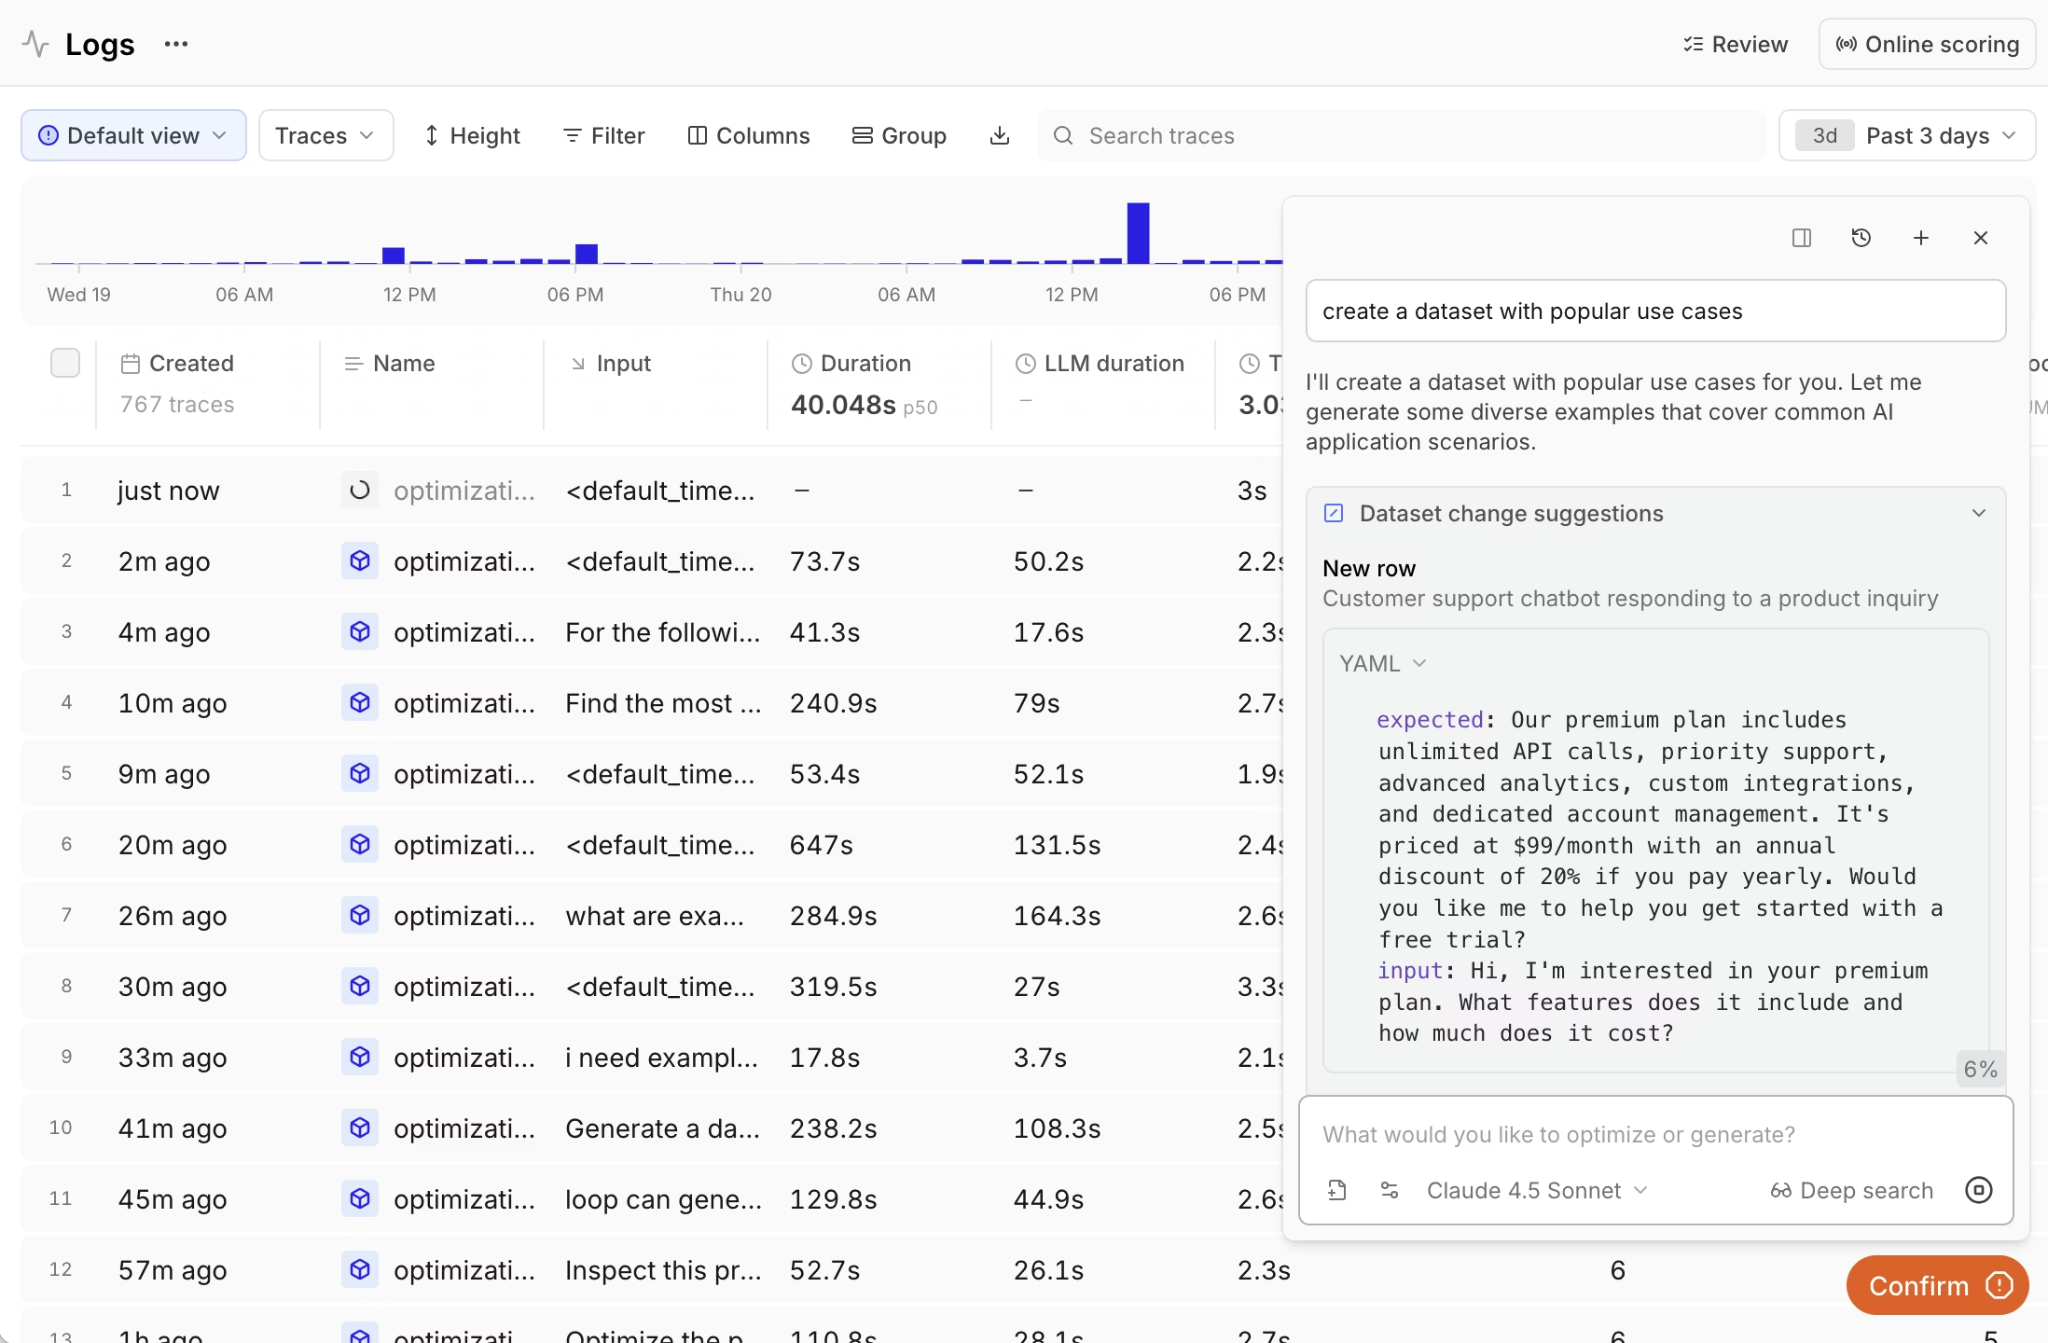
Agent failures often involve product-level decisions, where the correct agent behavior depends on business logic defined by PMs. Loop, Braintrust's AI assistant, lets anyone on the team analyze production logs with natural language, generate test datasets from real traffic, and create custom scorers from plain English descriptions. PMs and engineers can view the same traces, eval results, and quality metrics in a single workspace, eliminating the handoff overhead that slows down debugging.
Braintrust supports 40+ framework integrations, including LangChain, LlamaIndex, CrewAI, OpenAI Agents SDK, and Vercel AI SDK, along with OpenTelemetry for existing instrumentation and an AI gateway that logs requests with zero code changes, enabling immediate production visibility without re-architecting the stack.
Braintrust's evaluation-focused debugging workflow lets teams ship agent updates faster, because every change is validated against real production failures before it reaches users.
Pros
- One-click conversion of production failures into permanent eval cases that run on every future change
- CI/CD quality gates through native GitHub Actions that block regressions before merging
- Loop AI assistant lets non-technical team members analyze traces, generate datasets, and build scorers from natural language
- Playground loads any production trace for prompt iteration with side-by-side comparison against your eval suite
- 25+ built-in scorers for accuracy, relevance, and safety, plus custom scorer support
- Topics classifies every production trace by intent, sentiment, issues, and custom dimensions, surfacing recurring failure modes across all traffic
- Unified workspace where PMs and engineers share the same debugging views, eval results, and quality metrics
Cons
- Advanced features like self-hosting require an enterprise plan
- Initial evaluation setup requires defining scorers and building a baseline dataset
Pricing
Free tier with 1 GB of processed data, 10K scores, and unlimited users. Pro plan at $249/month. Custom enterprise pricing available. See pricing details here.
2. Maxim AI
Best for: Cross-functional teams that want to simulate agent behavior across scenarios before production and debug with multiple evaluator types.
Not for: Teams that want a minimal setup and don't need agent simulation or a broad evaluator configuration surface.
Maxim AI pairs distributed tracing with agent simulation. Teams can reproduce agent behavior across hundreds of scenarios and user personas before they deploy, then watch quality in real time once the agent is live. It records model calls, tool usage, and intermediate steps at the session, trace, and span levels, and it runs deterministic checks, statistical scoring, LLM-as-a-judge, and human review from one system. A no-code interface lets product managers, QA teams, and domain experts help set up evaluations, though that wider set of options can make the first setup more involved.
Pros
- Agent simulation across hundreds of scenarios and personas before production
- Deterministic, statistical, LLM-as-a-judge, and human evaluators in one system
- No-code configuration for technical and non-technical reviewers
- SDKs in Python, TypeScript, Java, and Go
Cons
- Broader configuration surface can make the setup more involved
- Shorter enterprise track record than more established platforms
Pricing
Free plan with 10K logs/month. Paid plans start at $29/seat/month. Custom enterprise pricing.
3. Langfuse
Best for: Teams that need open-source debugging with full self-hosting and data control.
Not for: Teams that want turnkey CI/CD quality gates and automated dataset generation without custom engineering.
Langfuse captures nested traces for agent workflows, allowing teams to inspect model calls, tool usage, and execution paths when investigating failures. Developers can instrument Python functions across different frameworks, and teams can self-host the platform to meet data residency requirements. However, turning traces into CI-enforced regression tests or automated quality gates requires additional engineering effort rather than built-in debugging workflows.
Pros
- Open-source with unrestricted self-hosting
- 50+ framework integrations with framework-agnostic tracing
- Prompt versioning with deployment labels and rollback support
- Annotation workflows with inline comments and team review
Cons
- CI/CD quality gates and automated eval pipelines require custom integration
- Self-hosting requires managing PostgreSQL, ClickHouse, and Redis infrastructure
Pricing
Free cloud plan with 50K units/month. Paid plan starts at $29/month. Self-hosting is free with all features.
4. Arize Phoenix
Best for: Teams that want OpenTelemetry-native, vendor-agnostic debugging with embedded analysis.
Not for: Teams that need a fully managed debugging platform with integrated eval workflows.
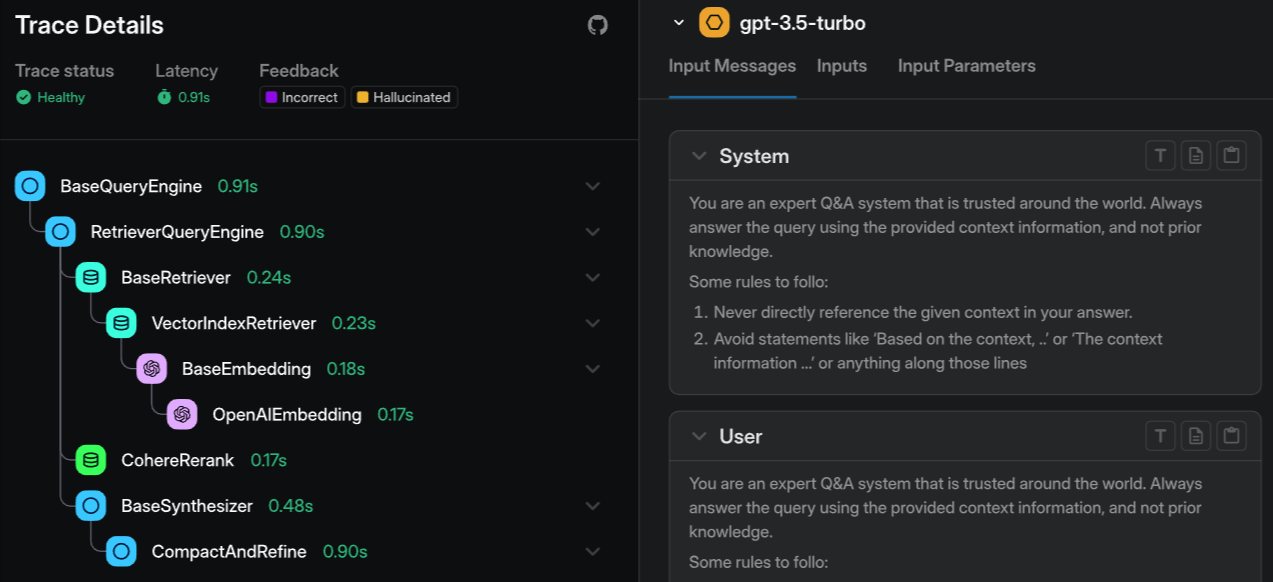
Arize Phoenix uses OpenTelemetry and the OpenInference standard for trace capture, enabling portable data across vendor-agnostic architectures. It supports replaying traces to inspect failures and includes evaluation templates to analyze model behavior during debugging. Phoenix also offers embedding clustering and drift detection to identify patterns across similar cases, though clusters are grouped by embedding proximity and left for you to interpret rather than labeled along named dimensions like intent, sentiment, or issue type. The open-source version is fully self-hostable without any feature restrictions, while the managed cloud offering, Arize AX, provides enterprise support and additional compliance capabilities.
Pros
- OpenTelemetry-native with vendor-agnostic, portable trace data
- Embedding clustering for identifying failure patterns that text filtering misses
- Free and self-hostable with no feature restrictions
- Broad framework support through OpenInference instrumentation
Cons
- Managed cloud features require Arize AX with separate enterprise pricing
- Evaluation workflows are less integrated than eval-first platforms
Pricing
Open-source and free for self-hosting. Arize AX has a free tier with 25K spans/month, and the paid plan starts at $50/month.
5. Helicone
Best for: Teams that need fast, proxy-based debugging for cost spikes and latency issues across multiple LLM providers.
Not for: Teams that need deep agent trace reconstruction with step-level debugging and eval integration.
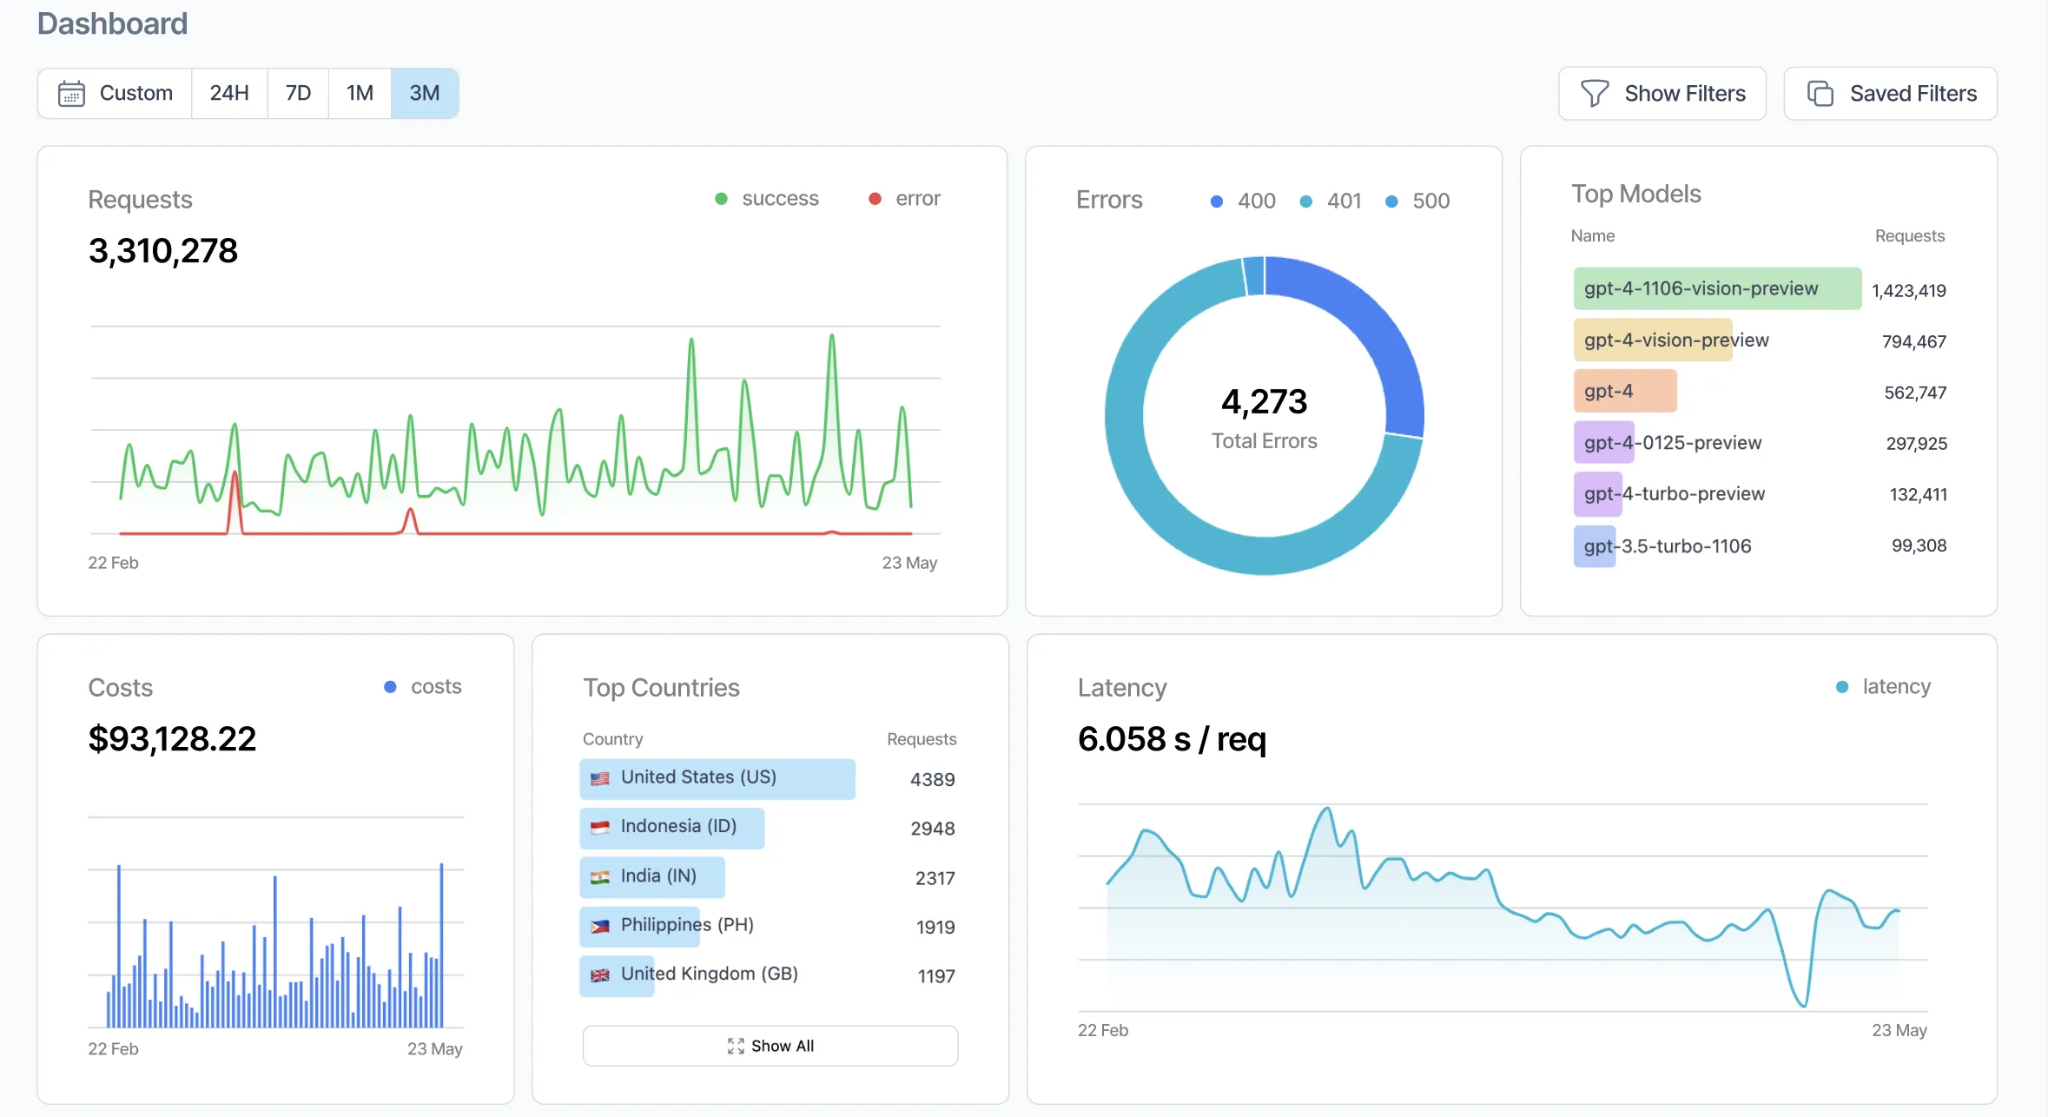
Helicone acts as a proxy between your application and LLM providers, logging each request and response, along with costs, latencies, and token usage. Teams enable Helicone by changing the base URL, and the platform supports many model providers through a unified API. Helicone groups related requests into sessions, which helps with multi-turn conversation debugging and traffic analysis, but it captures request-level data rather than internal agent steps. Teams that need tool-level tracing or integrated regression workflows must combine Helicone with a separate debugging system.
Pros
- One-line proxy integration with no code changes required
- Automatic cost-based routing and caching across 100+ providers
- Session tracing for multi-turn conversation debugging
- Open-source with self-hosting via Docker and Kubernetes
Cons
- Proxy architecture captures request-level data, not internal agent reasoning steps
- Limited evaluation and CI/CD integration for regression prevention
Pricing
Free plan with 10,000 requests/month. Pro plan starts at $79/month, with custom enterprise pricing available.
6. Agenta
Best for: Teams that want an open-source, self-hostable platform combining trace inspection, evaluation, and prompt management in one place.
Not for: Teams that need native CI/CD release gating and fast queries over very large trace volumes.
Agenta is an open-source (MIT-licensed) LLMOps platform that brings a prompt playground, prompt management, evaluation, and observability together. For debugging, you can trace every request to pinpoint where a run failed, then evaluate the full trace across the agent's reasoning steps using LLM-as-a-judge and custom evaluators. Domain experts can annotate traces directly, so product and engineering teams review failures from the same data. Agenta is model-agnostic and integrates with LangChain, LlamaIndex, and OpenAI, and the whole platform can be self-hosted. It does not gate releases through CI, and query performance over large trace volumes trails engines built specifically for that scale.
Pros
- Open-source and self-hostable under an MIT license, with no vendor lock-in
- Full-trace evaluation across agent reasoning steps with LLM-as-a-judge and custom evaluators
- Trace annotation so domain experts and engineers review the same failures
- LangChain, LlamaIndex, and OpenAI integrations, with a prompt playground and version history
Cons
- No native CI/CD gating to block regressions before they ship
- Trace-query performance and scale fall short of engines purpose-built for large trace volumes
Pricing
Free Hobby tier (2 seats, 5K traces/month, 30-day retention). Pro at $49/month. Business at $399/month. Custom enterprise pricing. Self-hosting the open-source version is free.
7. Galileo
Best for: Teams running high-volume agents that need automated failure detection with real-time evaluators.
Not for: Teams that want full trace replay and sandbox debugging for individual failures.
Galileo emphasizes automated failure analysis over manual trace inspection. Its Insights Engine scans production traces to detect recurring failure patterns, cluster similar issues, and suggest corrective actions. The engine clusters the failures it detects rather than classifying every run by intent, sentiment, or a custom dimension, so categorization centers on flagged problems instead of the full distribution of production traffic. Galileo also offers Luna-2 evaluators designed for low-latency, lower-cost scoring at scale, enabling real-time evaluation across high-volume requests. While Galileo provides agent-specific metrics such as tool selection accuracy and task completion rates, it focuses more on aggregate failure detection than on step-by-step trace replay or sandbox-based debugging of individual requests.
Pros
- Insights Engine surfaces failure patterns and prescribes fixes automatically
- Agent-specific metrics for tool selection, task completion, and session success
- Eval-to-guardrail pipeline converts pre-production checks into production safety filters
- Cost-effective Luna-2 evaluators
Cons
- Less suited for individual trace replay and sandbox debugging workflows
- Categorization centers on detected failures rather than classifying all traffic by custom dimensions
- Evaluation logic depends on Galileo's proprietary Luna-2 models
Pricing
Free tier with 5,000 traces/month. Pro plan starts at $100/month for 50,000 traces. Custom enterprise pricing.
Comparison table: best AI agent debugging tools (2026)
| Tool | Multi-step trace reconstruction | Replay / Sandbox | Root-cause workflow | Eval integration | CI/CD quality gates | Alerting | Cross-functional collaboration | Starting price (SaaS) |
|---|---|---|---|---|---|---|---|---|
| Braintrust | Full multi-step tracing with nested spans across model calls, tools, and retrieval | Playground replays full production traces with preserved execution context | Topics classifies every trace by intent, sentiment, issues, and custom facets; span inspection, side-by-side comparison, Loop AI-assisted analysis | One-click trace-to-eval conversion, offline + online scoring | Native GitHub Action with merge blocking on score thresholds | Webhooks (Slack, PagerDuty), score-based monitoring | Shared trace + eval workspace for PMs and engineers | Free (1 GB data, 10K scores) |
| Maxim AI | Distributed tracing at session, trace, and span levels | Agent simulation across scenarios and personas | Multi-evaluator analysis, human review | Deterministic, statistical, LLM-as-judge evals | CI integration via SDKs | Real-time quality monitoring | No-code setup for PMs, QA, and domain experts | Free (10K logs) |
| Langfuse | Nested tracing across frameworks | Limited replay (prompt-focused) | Filtering, dashboards, annotations | LLM-as-judge, custom evaluators | Requires custom CI integration | Custom webhook setup | Shared dashboards + comments | Free (50K units) |
| Arize Phoenix | OpenTelemetry-based multi-step tracing | Trace replay in open-source UI | Embedding-proximity clustering (interpret manually), drift detection | Evaluation templates (less tightly integrated with CI) | Requires custom CI integration | Custom alerting via AX | Dashboard sharing | Free (25K spans) |
| Helicone | Request-level proxy logging (not internal agent step tracing) | Session replay for conversations | Cost and latency analytics | Limited eval support | Not native | Cost + latency alerts | Team dashboards | Free (10K requests) |
| Agenta | Request-level tracing across agent steps (open-source) | Replay via the prompt playground | Trace inspection with full-trace evaluation | Full-trace LLM-as-judge and custom evaluators | No native CI gating | Manual trace annotation | Shared traces with team annotation | Free Hobby (2 seats, 5K traces) |
| Galileo | Agent workflow tracing with automated clustering | Limited individual trace replay | Insights Engine clusters detected failures | Automated Luna-2 scoring | Limited native CI gating | Quality drift alerts | Dashboard sharing | Free (5K traces) |
Ready to close the debugging loop? Start debugging with Braintrust's free tier
Why Braintrust is the best choice for agent debugging
Agent debugging in production is only effective when investigating a failure directly strengthens the system that ships the next release. Braintrust integrates trace inspection, evaluation creation, and CI enforcement into a single continuous workflow, so that debugging immediately produces a lasting safeguard.
In Braintrust, a production trace that exposes a failure can be converted into a permanent evaluation case and enforced automatically through CI quality gates. Every subsequent pull request is validated against the accumulated evaluation suite, and merges are blocked when defined thresholds are not met. This trace-to-evaluation workflow ensures that each resolved issue becomes a regression test tied directly to deployment controls, allowing teams to scale agent complexity without repeatedly fixing the same classes of failures.
Topics extends this workflow to production scale. By classifying every trace by intent, sentiment, issues, and custom dimensions, it turns high-volume traffic into a ranked view of recurring failure modes, so teams decide which categories of failure are worth converting into evals instead of triaging traces one at a time.
Production teams at Notion, Stripe, Cloudflare, Replit, and Zapier run their agent debugging workflows through Braintrust. Start debugging AI agents for free with Braintrust
How we chose the best agent debugging tools
We evaluated all the listed tools against the criteria below, which reflect the full agent debugging workflow from failure detection to regression prevention.
Agent trace reconstruction: The tool must capture multi-step execution traces across model calls, tool invocations, and retrieval steps, with complete input and output context for each span so teams can see exactly what happened during a request.
Replay and sandboxing: The tool should allow teams to load a production trace into a controlled environment, adjust prompts or configurations, and rerun the scenario to verify a fix without affecting live systems.
Root-cause workflow: The tool should support filtering, clustering, and running comparisons so teams can isolate the failing step and understand how it differs from successful runs.
Evals integration: The tool must allow teams to convert production failures into permanent evaluation cases and run regression checks across offline datasets and live traffic.
CI/CD quality gates: The tool should integrate with systems such as GitHub to block merges when evaluation scores fall below defined thresholds.
Alerting: The tool should support alerts for latency increases, quality drops, or cost spikes.
Collaboration: Engineers and product teams should be able to review the same traces, evaluation results, and debugging context within a shared workspace.
AI agent debugging FAQs
What is AI agent debugging?
AI agent debugging is the process of identifying, reproducing, and fixing failures in multi-step agent workflows running in production. Unlike traditional software, agents can return a valid response while making incorrect decisions across model calls, tool invocations, or retrieval steps. Debugging requires reconstructing the full execution path, isolating the step where the behavior went wrong, verifying the fix in a controlled environment, and converting the failure into a permanent evaluation case so it cannot reappear in future releases.
How is agent debugging different from LLM observability?
LLM observability captures trace data showing what happened during a request, including inputs, outputs, timing, and costs for each step. Agent debugging uses that trace data to determine why the request failed and how to prevent it from failing again. While observability captures what happened during a request, debugging adds structured workflows for reproducing failures, validating fixes, turning failures into evaluation cases, and enforcing quality gates through CI/CD so regressions do not ship.
How do I choose the right agent debugging tool?
Choose a tool that supports the full debugging lifecycle rather than only trace inspection. A strong debugging platform lets you analyze step-level decisions, replay failures in a sandbox, convert real production failures into evaluation datasets, and automatically validate every code change through CI/CD. Braintrust provides a complete debugging workflow in a single platform, with native GitHub Actions, one-click trace-to-eval conversion, and shared views for engineers and product managers working from the same data.
Is Braintrust better than Maxim AI for debugging agents?
Braintrust is the stronger option for teams that want debugging tightly connected to evaluation and CI/CD enforcement across multiple frameworks. It supports 40+ integrations, converts production traces into evaluation cases with a single click, and runs automated evaluations on every pull request via its native GitHub Action. Maxim AI offers agent simulation across scenarios and a broad set of evaluator types, which suits cross-functional teams that want to test behavior before production. Teams that need eval-driven release gates wired directly into CI typically benefit more from Braintrust's integrated workflow.
How do I get started with agent debugging?
The fastest way to get started is to instrument your agents with tracing so you can see every step of their execution, then build a small eval dataset from real production failures. With Braintrust, you can begin capturing traces in minutes using the SDK or AI gateway, then enable CI evaluation through the native GitHub Action so every pull request runs against your regression suite. Braintrust's free tier includes 1 GB of processed data and 10,000 evaluation scores per month, which is enough to instrument a production agent, investigate failures, and establish CI quality gates from the first release.