Contributed by Ornella Altunyan on 2024-10-31
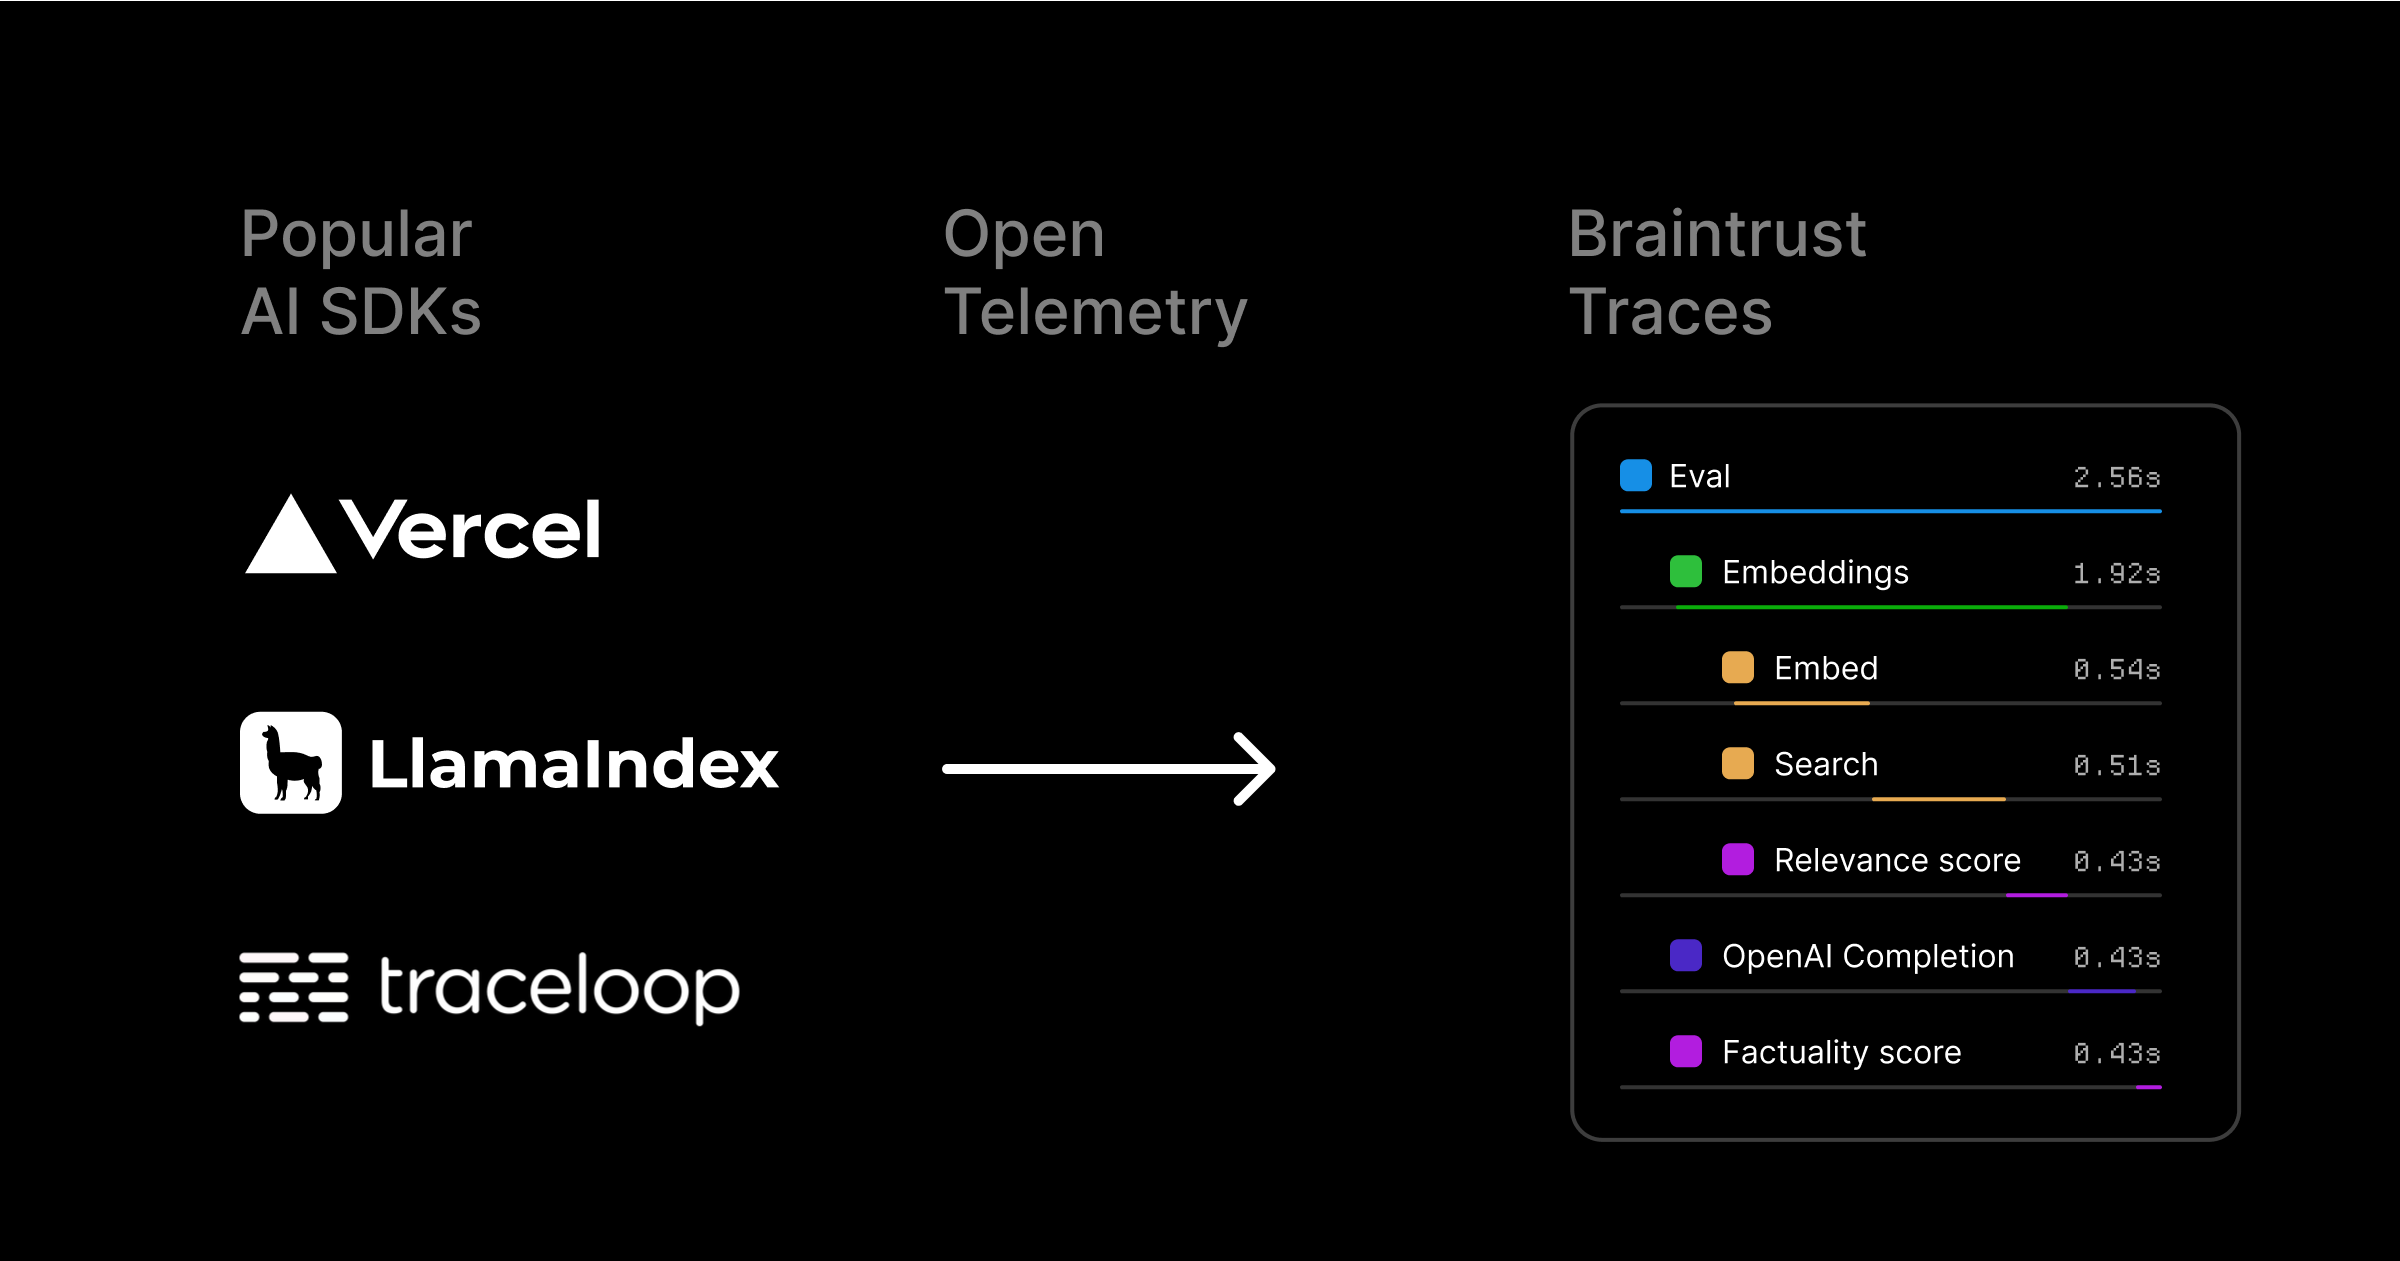
OpenTelemetry (OTel) is an open-source observability framework designed to help developers collect, process, and export telemetry data from their applications for performance monitoring and debugging. It’s used by popular libraries like the Vercel AI SDK, LlamaIndex, and Traceloop OpenLLMetry for observability in AI applications. OTel support extends to many programming languages including Python, TypeScript, Java, and Go.
Getting started
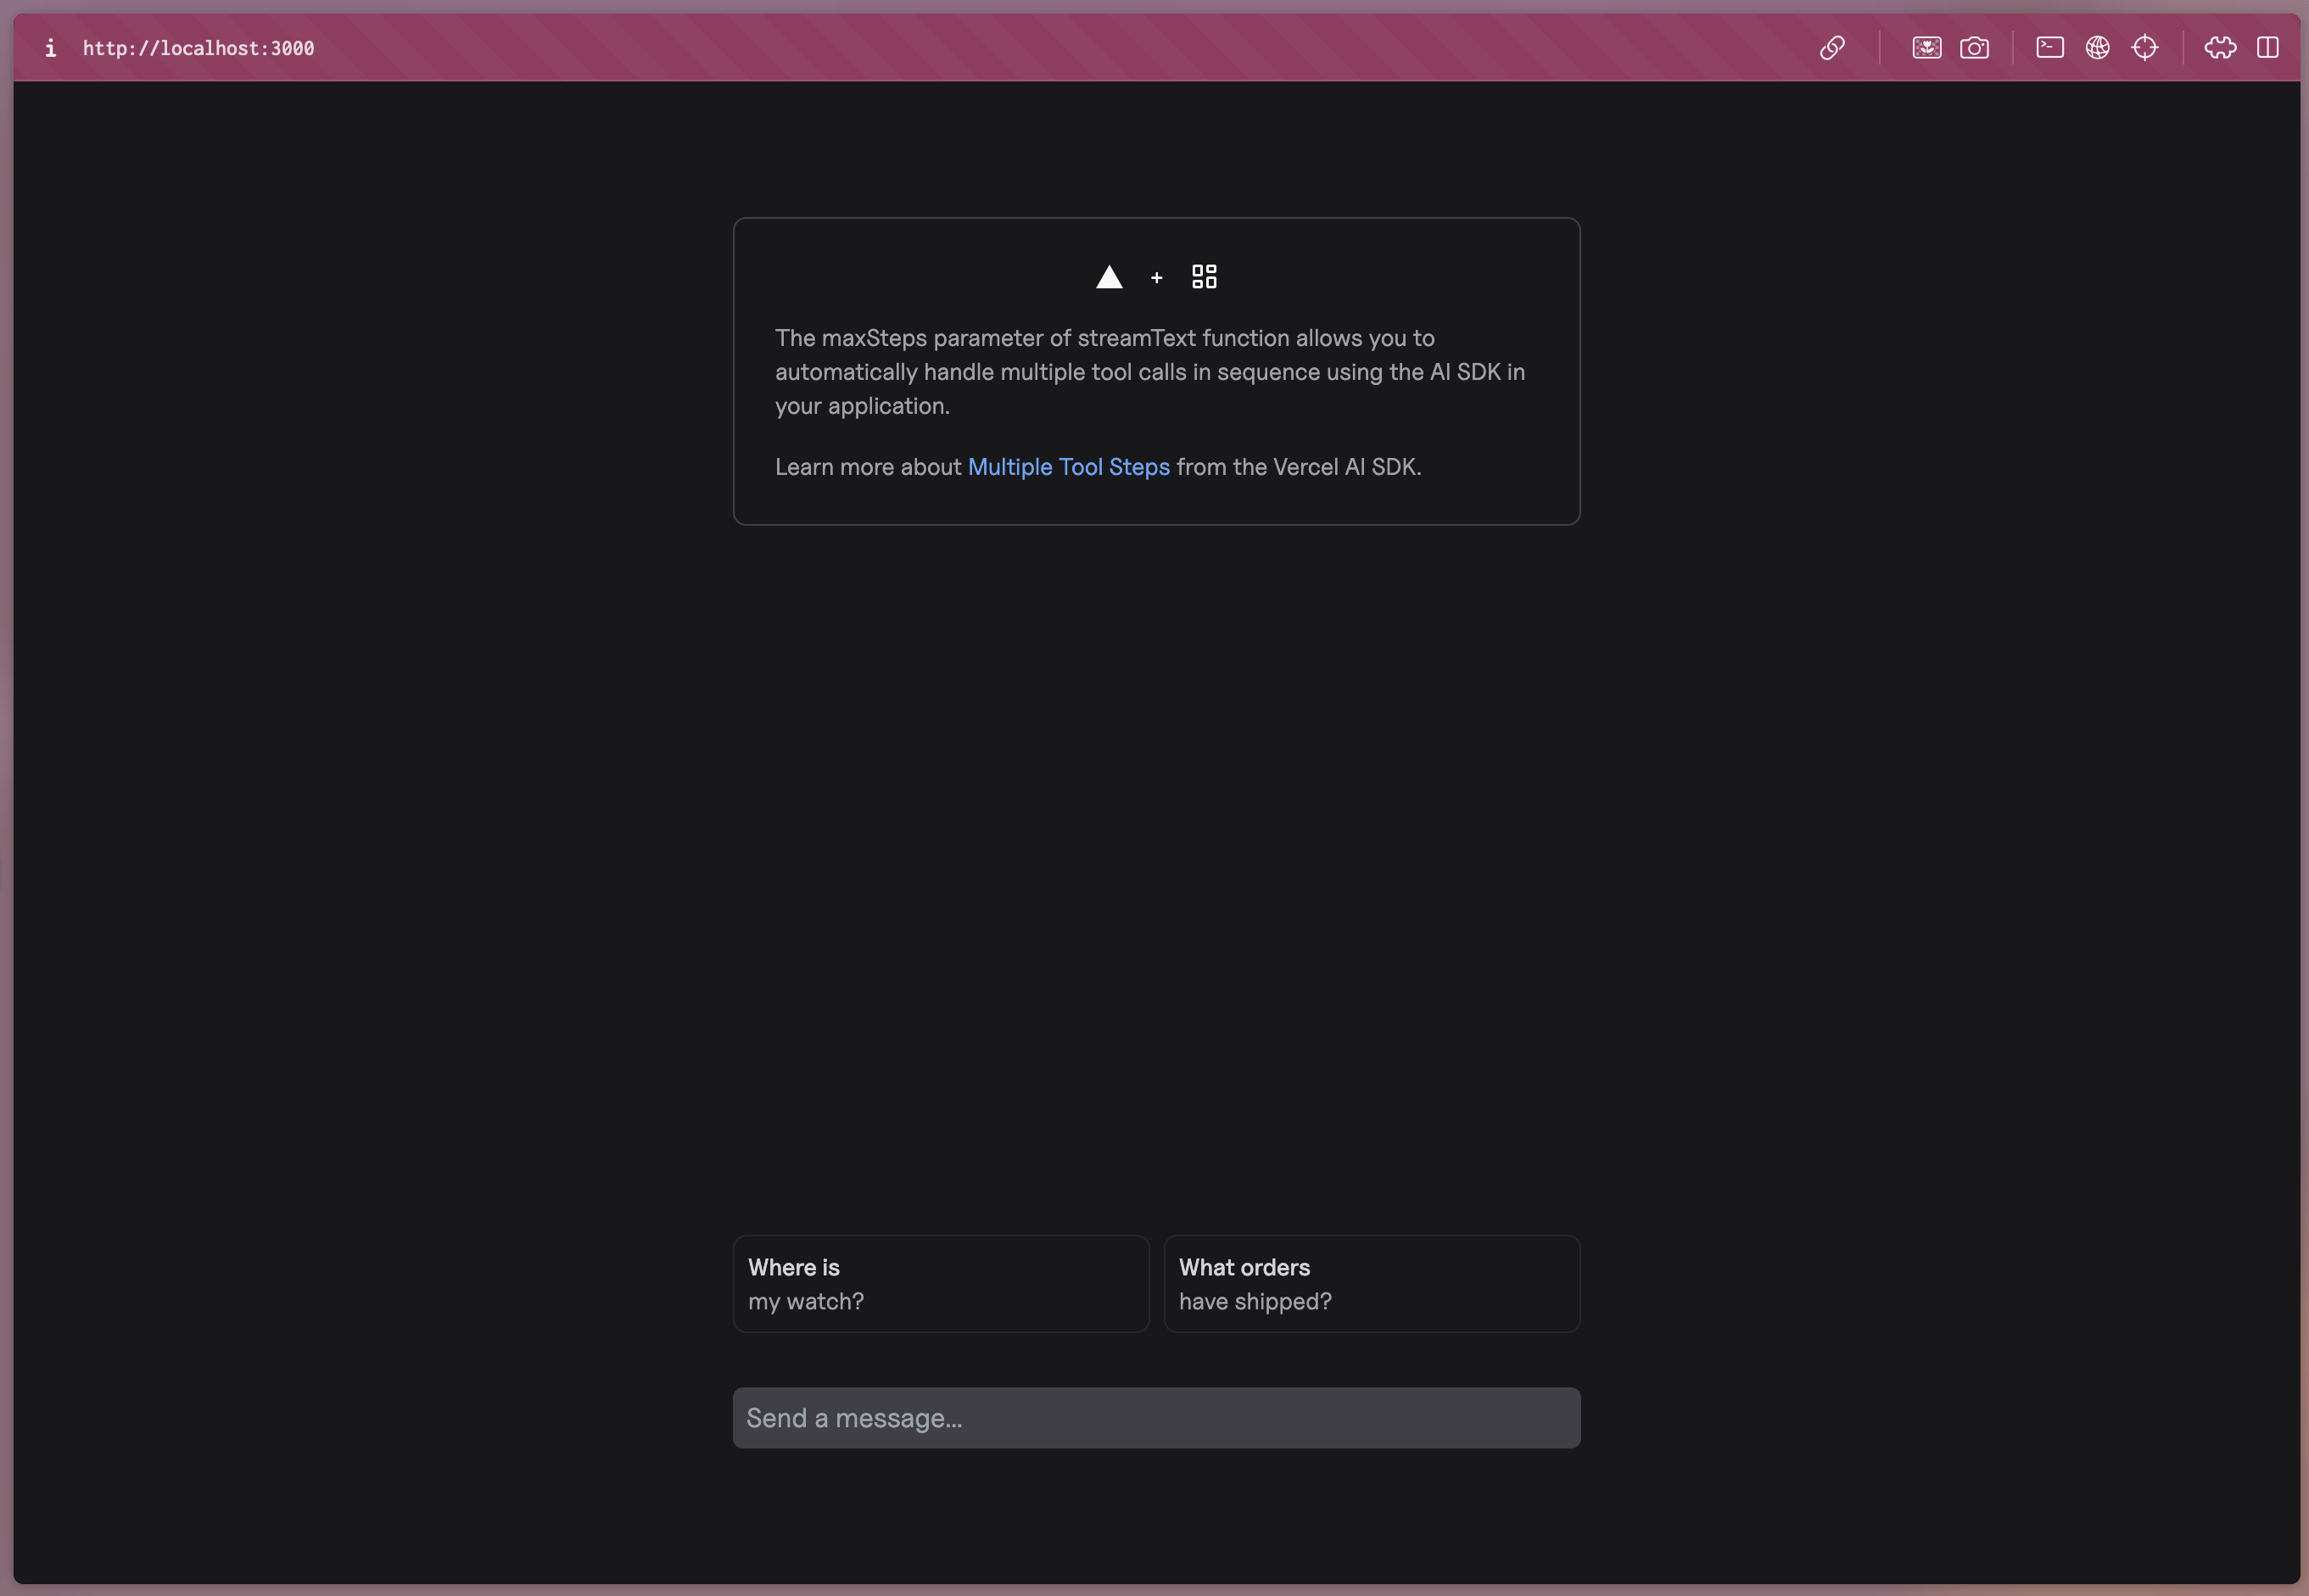
We’ll use the Automatic Multiple Tool Steps Preview sample app from Vercel to demonstrate how simple it is to log to Braintrust, even if you have multiple steps and tool calls in your application. To get started, you’ll need Braintrust and OpenAI accounts, along with their corresponding API keys, and the npm and create-next-app libraries installed locally. First, bootstrap the example:.env file to set the required environment variables. Start by adding your OpenAI API key:
You can also use the OpenAI API by adding your Braintrust API key and using
the Braintrust AI Proxy.
Setting up OTel
To set up Braintrust as an OpenTelemetry backend, you’ll use theBraintrustSpanProcessor which handles all the configuration automatically. First, install the required dependencies:
.env file:
<Your API Key> with your Braintrust API key, and <Your Project Name> with the name of the project in Braintrust where you’d like to store your logs.
The
BRAINTRUST_PARENT environment variable sets the trace’s parent project
or experiment. You can use a prefix like project_id:, project_name:, or
experiment_id: here, or pass in a span
slug (span.export()) to nest the
trace under a span within the parent object.instrumentation.ts to set up the Braintrust span processor:
next.config.mjs file:
experimental_telemetry option to enable telemetry on supported AI SDK function calls. In your route.ts file, add the experimental_telemetry parameter to your LLM call:
Logging LLM requests in Braintrust
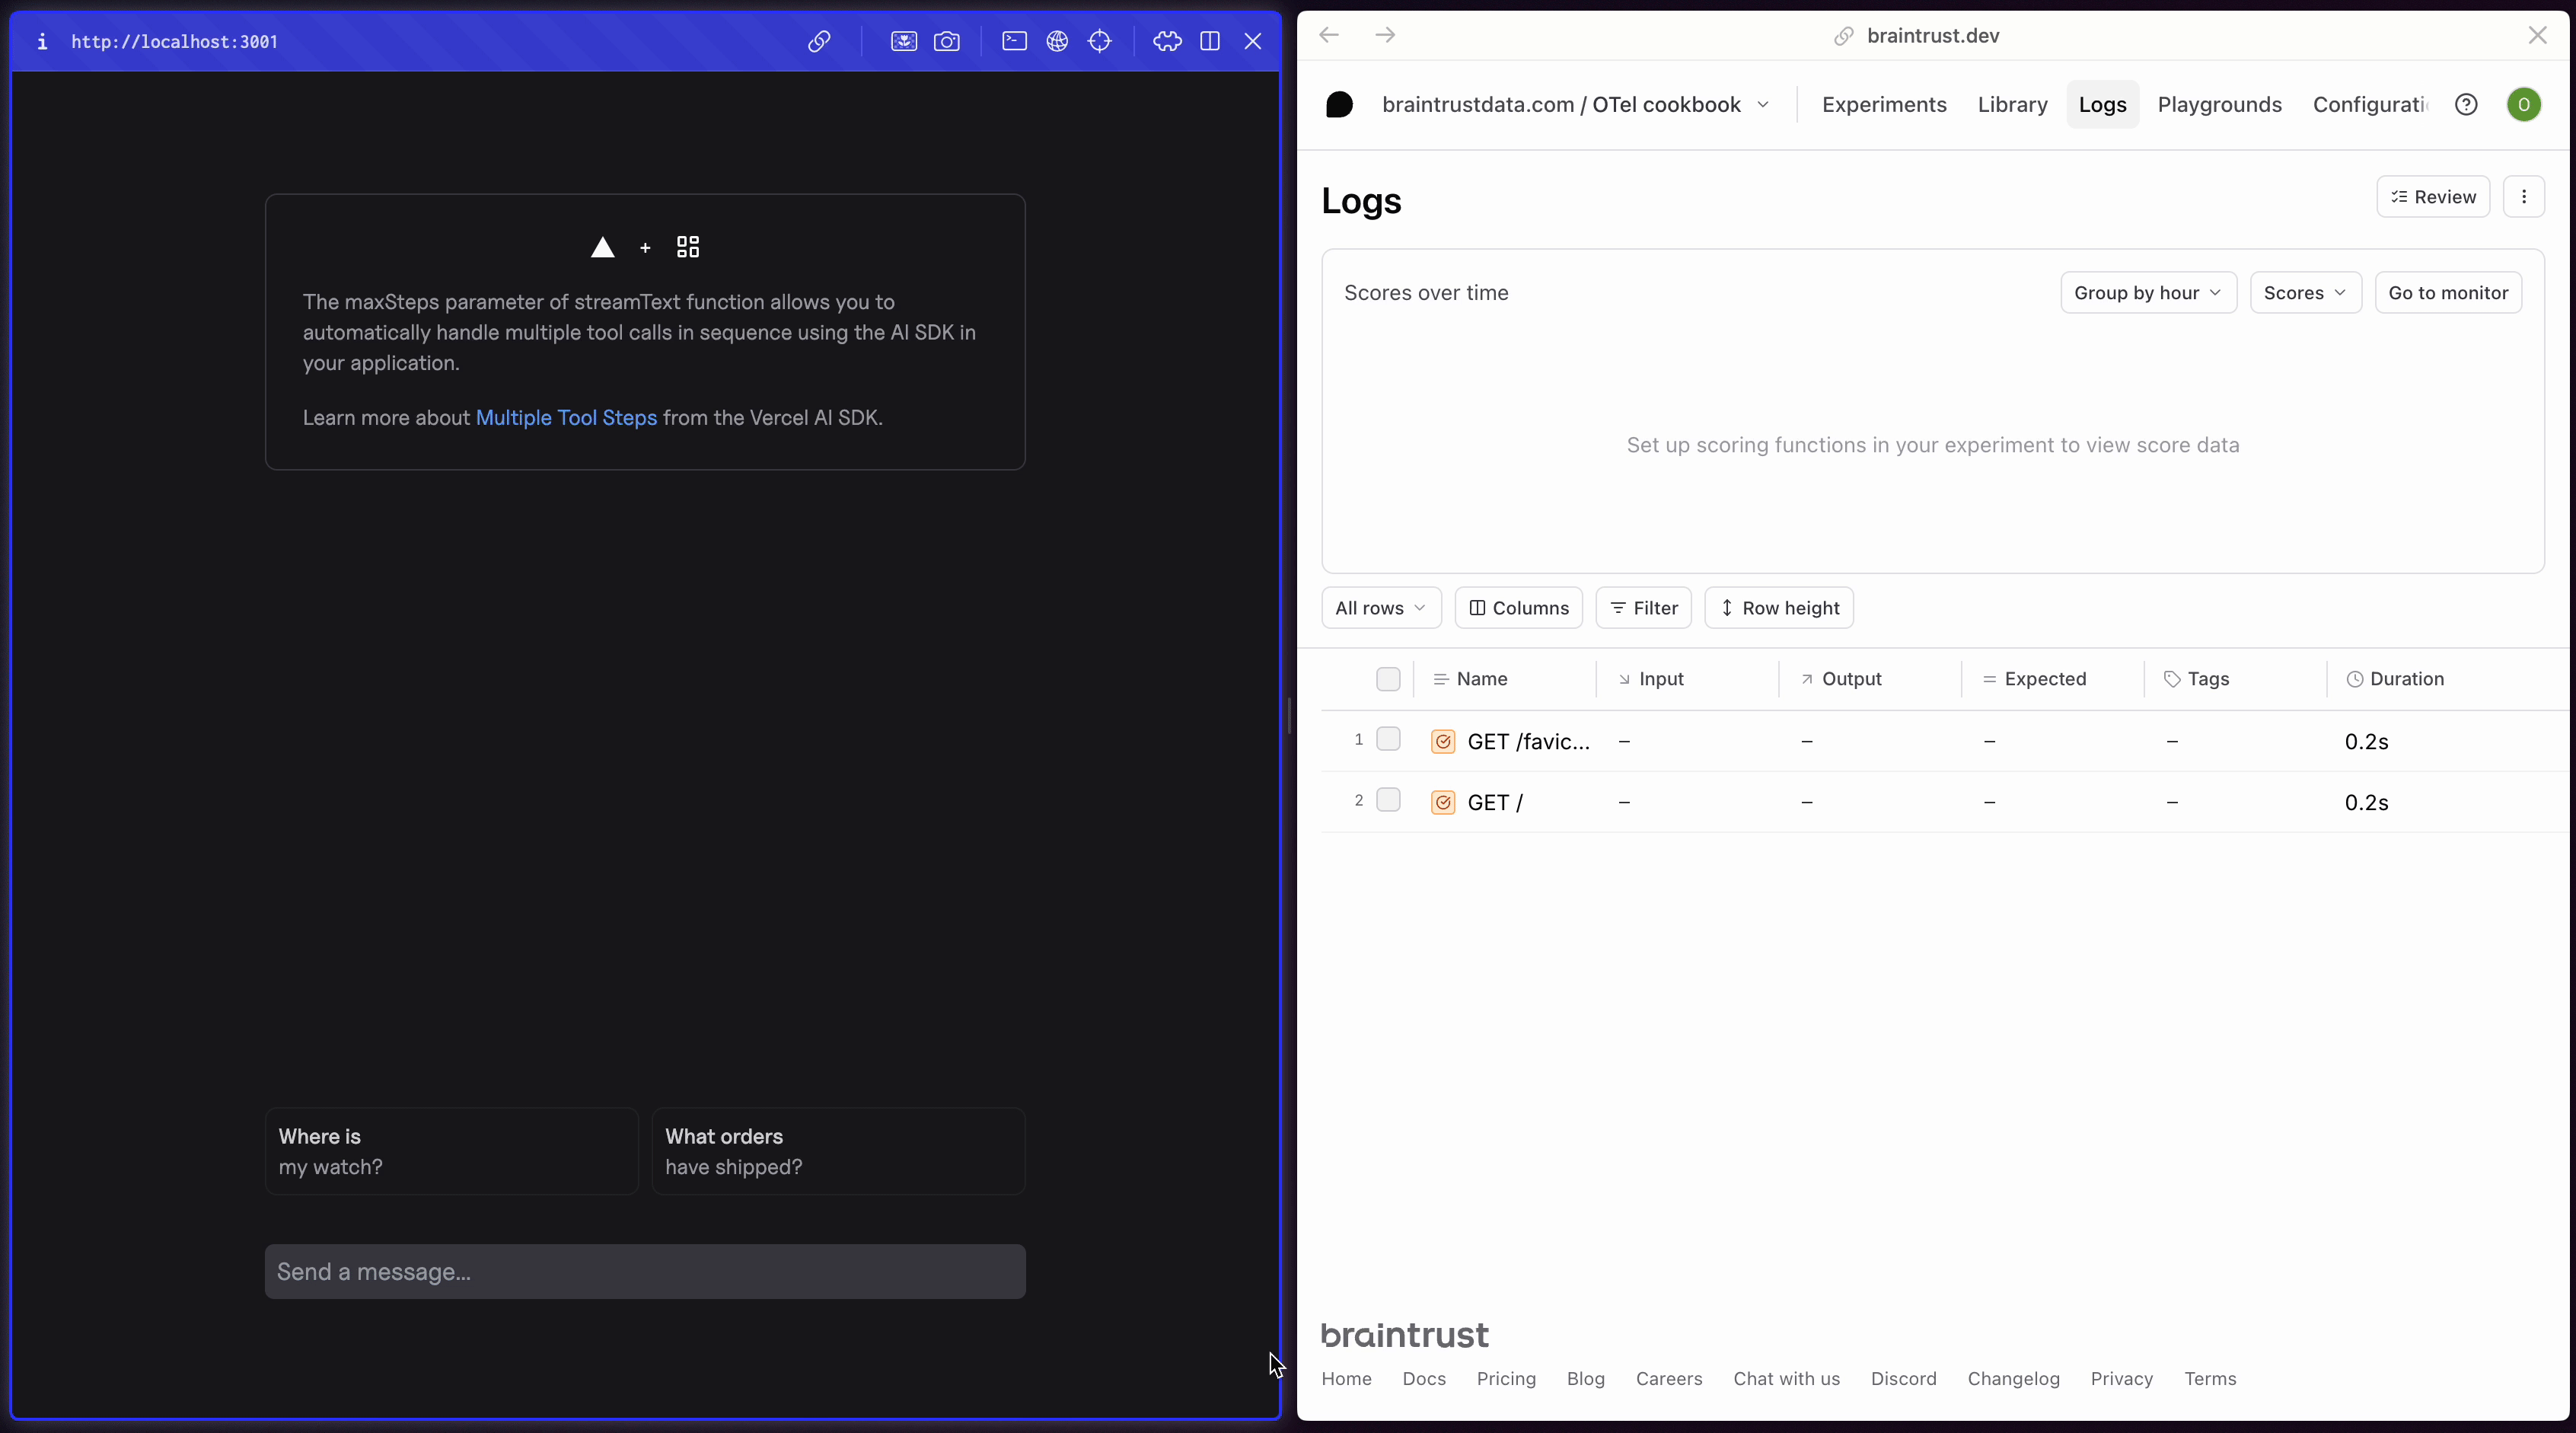
Runnpm install to install the required dependencies, then npm run dev to launch the development server. Your app should be served on localhost:3000 or another available port.
Filtering your logs
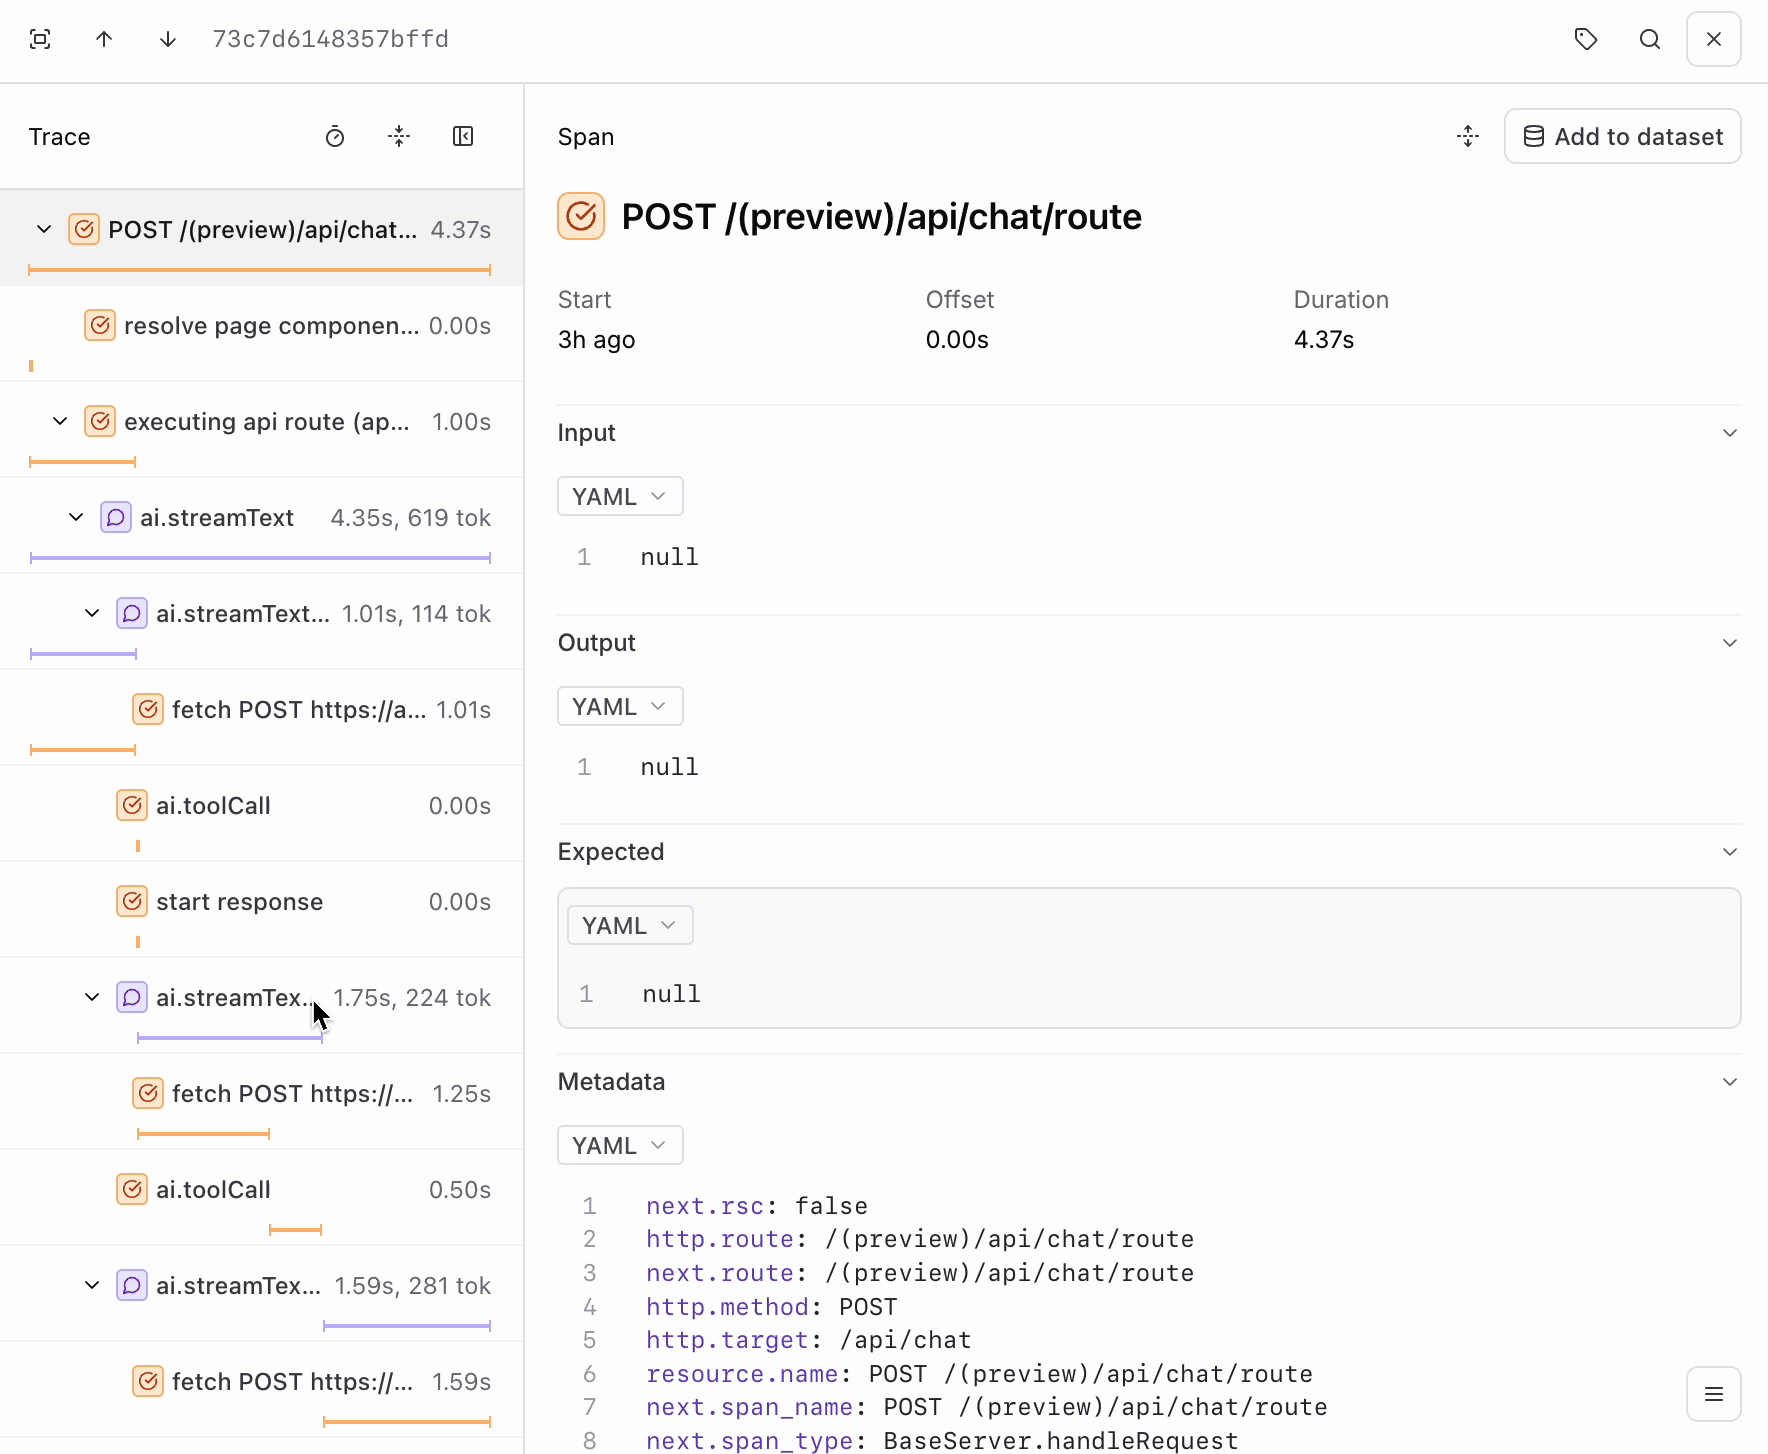
Run a couple more queries in the app and notice the logs that are generated. Our app is logging bothGET and POST requests, but we’re most interested in the POST requests since they contain our LLM calls. We can apply a filter using the BTQL query Name LIKE 'POST%' so that we only see the traces we care about:
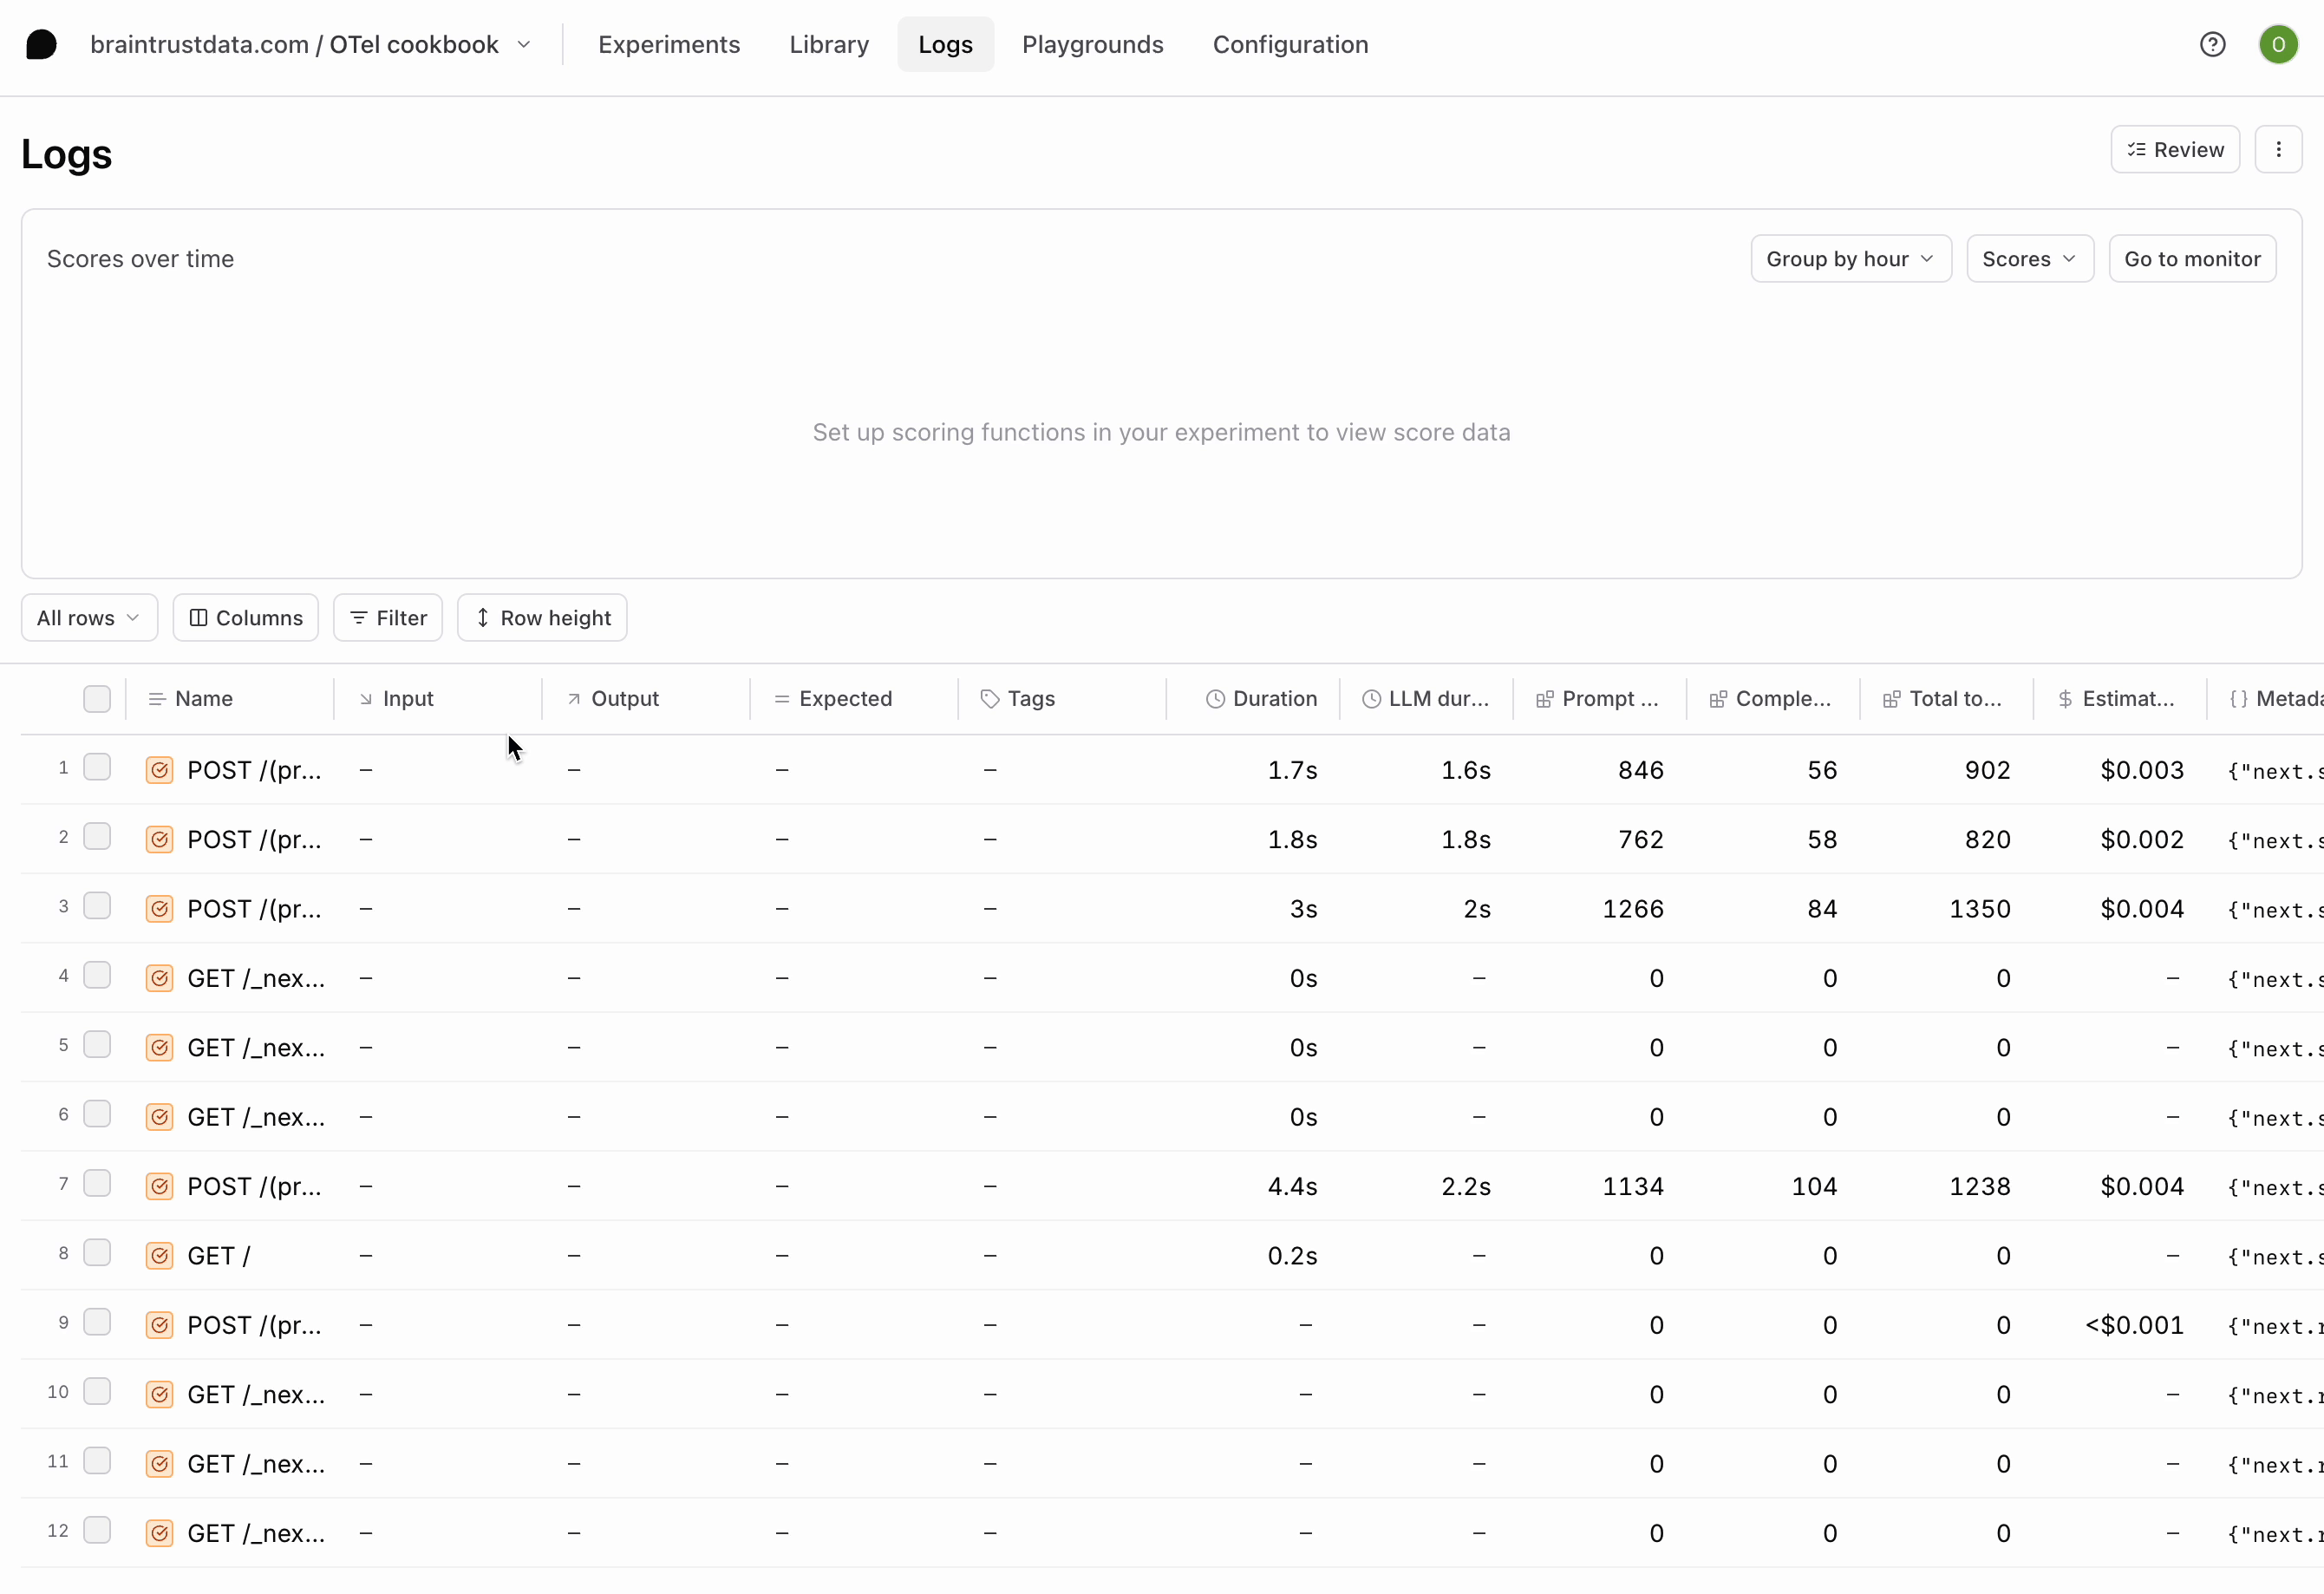
POST requests your app has made. Each contains the inputs and outputs of each LLM call in a span called ai.streamText. If you go further into the trace, you’ll also notice a span for each tool call.
Next steps
Now that you’re able to log your application in Braintrust, you can explore other workflows like:- Adding your tools to your library and using them in experiments and the playground
- Creating custom scorers to assess the quality of your LLM calls
- Adding your logs to a dataset and running evaluations comparing models and prompts