Comparing evals across multiple AI models

This tutorial will teach you how to use Braintrust to compare the same prompts across different AI models and parameters to help decide on choosing a model to run your AI apps.

Before starting, please make sure that you have a Braintrust account. If you do not, please sign up. After this tutorial, feel free to dig deeper by visiting the docs.

Installing dependencies

To see a list of dependencies, you can view the accompanying package.json file. Feel free to copy/paste snippets of this code to run in your environment, or use tslab to run the tutorial in a Jupyter notebook.

Setting up the data

For this example, we will use a small subset of data taken from the google/boolq dataset. If you'd like, you can try datasets and prompts from any of the other cookbooks at Braintrust.

// curl -X GET "https://datasets-server.huggingface.co/rows?dataset=google%2Fboolq&config=default&split=train&offset=500&length=5" > ./assets/dataset.json
import dataset from "./assets/dataset.json";
 
// labels these 1-3 so that they will be easier to recognize in the app
const prompts = [
  "(1) - true or false",
  "(2) - Answer using true or false only",
  "(3) - Answer the following question as accurately as possible with the words 'true' or 'false' in lowercase only. Do not include any other words in the response",
];
 
// extract question/answers from rows into input/expected
const evalData = dataset.rows.map(({ row: { question, answer } }) => ({
  input: question,
  expected: `${answer}`,
}));
console.log(evalData);
[
  {
    input: 'do you have to have two license plates in ontario',
    expected: 'true'
  },
  {
    input: 'are black beans the same as turtle beans',
    expected: 'true'
  },
  {
    input: 'is a wooly mammoth the same as a mastodon',
    expected: 'false'
  },
  {
    input: 'is carling black label a south african beer',
    expected: 'false'
  },
  {
    input: 'were the world trade centers the tallest buildings in america',
    expected: 'true'
  }
]

Running comparison evals across multiple models

Let's set up some code to compare these prompts and inputs across 3 different models and different temperature values. For this cookbook we will be using Braintrust's LLM proxy to access the API for different models.

All we need to do is provide a baseURL to the proxy with the relevant API key that we want to access, and the use the wrapOpenAI function from braintrust which will help us capture helpful debugging information about each model's performance while keeping the same SDK interface across all models.

import { wrapOpenAI } from "braintrust";
import { OpenAI } from "openai";
 
async function callModel(
  input: string,
  {
    model,
    apiKey,
    temperature,
    systemPrompt,
  }: {
    model: string;
    apiKey: string;
    temperature: number;
    systemPrompt: string;
  }
) {
  const client = wrapOpenAI(
    new OpenAI({
      baseURL: "https://api.braintrust.dev/v1/proxy",
      apiKey, // Can use OpenAI, Anthropic, Mistral etc. API keys here
    })
  );
 
  const response = await client.chat.completions.create({
    model: model,
    messages: [
      {
        role: "system",
        content: systemPrompt,
      },
      {
        role: "user",
        content: input,
      },
    ],
    temperature,
    seed: 123,
  });
  return response.choices[0].message.content || "";
}

Then we will set up our eval data for each combination of model, prompt and temperature.

const combinations: {
  model: { name: string; apiKey: string };
  temperature: number;
  prompt: string;
}[] = [];
for (const model of [
  {
    name: "claude-3-opus-20240229",
    apiKey: process.env.ANTHROPIC_API_KEY ?? "",
  },
  {
    name: "claude-3-haiku-20240307",
    apiKey: process.env.ANTHROPIC_API_KEY ?? "",
  },
  { name: "gpt-4", apiKey: process.env.OPENAI_API_KEY ?? "" },
  { name: "gpt-4o", apiKey: process.env.OPENAI_API_KEY ?? "" },
]) {
  for (const temperature of [0, 0.25, 0.5, 0.75, 1]) {
    for (const prompt of prompts) {
      combinations.push({
        model,
        temperature,
        prompt,
      });
    }
  }
}
 
[process.env.ANTHROPIC_API_KEY, process.env.OPENAI_API_KEY].forEach(
  (v, i) => !v && console.warn(i, "API key not set")
);
// don't log API keys
console.log(
  combinations.slice(0, 5).map(({ model: { name }, temperature, prompt }) => ({
    model: name,
    temperature,
    prompt,
  }))
);
[
  {
    model: 'claude-3-opus-20240229',
    temperature: 0,
    prompt: '(1) - true or false'
  },
  {
    model: 'claude-3-opus-20240229',
    temperature: 0,
    prompt: '(2) - Answer using true or false only'
  },
  {
    model: 'claude-3-opus-20240229',
    temperature: 0,
    prompt: "(3) - Answer the following question as accurately as possible with the words 'true' or 'false' in lowercase only. Do not include any other words in the response"
  },
  {
    model: 'claude-3-opus-20240229',
    temperature: 0.25,
    prompt: '(1) - true or false'
  },
  {
    model: 'claude-3-opus-20240229',
    temperature: 0.25,
    prompt: '(2) - Answer using true or false only'
  }
]

Let's use the functions and data that we have set up to run some evals on Braintrust! We will be using two scorers for this eval:

  1. A simple exact match scorer that will compare the output from the LLM exactly with the expected value
  2. A Levenshtein scorer which will calculate the Levenshtein distance between the LLM output and our expected value

We are also adding the model, temperature, and prompt into the metadata so that we can use those fields to help our visualization inside the braintrust app after the evals are finished running.

import { Eval } from "braintrust";
import { Levenshtein } from "autoevals";
 
const exactMatch = (args: { input; output; expected? }) => {
  return {
    name: "ExactMatch",
    score: args.output === args.expected ? 1 : 0,
  };
};
 
await Promise.all(
  combinations.map(async ({ model, temperature, prompt }) => {
    Eval("Model comparison", {
      data: () =>
        evalData.map(({ input, expected }) => ({
          input,
          expected,
        })),
      task: async (input) => {
        return await callModel(input, {
          model: model.name,
          apiKey: model.apiKey,
          temperature,
          systemPrompt: prompt,
        });
      },
      scores: [exactMatch, Levenshtein],
      metadata: {
        model: model.name,
        temperature,
        prompt,
      },
    });
  })
);
 ████████████████████████████████████████ | Model comparison                         | 100% | 5/5 datapoints
 
=========================SUMMARY=========================
main-1716504446-539a4a27 compared to main-1716504446-c81946d8:
52.00% ''Levenshtein'' score    (0 improvements, 0 regressions)
40.00% ''ExactMatch' ' score    (0 improvements, 0 regressions)
 
5.06s 'duration'        (0 improvements, 0 regressions)
 
See results for main-1716504446-539a4a27 at https://www.braintrust.dev/app/braintrustdata.com/p/Model%20comparison/experiments/main-1716504446-539a4a27
 
 
=========================SUMMARY=========================
main-1716504446-44ef0250 compared to main-1716504446-75fa02ea:
0.00% ''ExactMatch' ' score     (0 improvements, 0 regressions)
1.43% ''Levenshtein'' score     (0 improvements, 0 regressions)
 
1.05s 'duration'        (0 improvements, 0 regressions)
 
See results for main-1716504446-44ef0250 at https://www.braintrust.dev/app/braintrustdata.com/p/Model%20comparison/experiments/main-1716504446-44ef0250

Visualizing

Now we have successfully run our evals! Let's log onto braintrust.dev and take a look at the results.

Click into the newly generated project called Model comparison, and check it out! You should notice a few things:

initial-chart

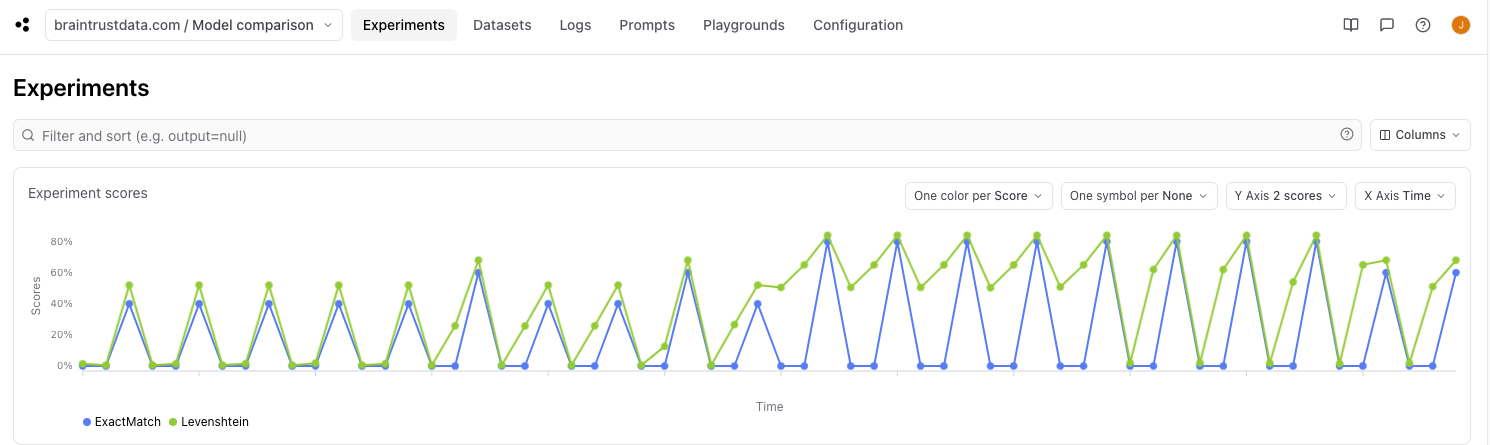
  • Each line represents a score over time, and each data point represents an experiment that was run.
    • From the code, we ran 60 experiments (5 temperature values x 4 models x 3 prompts) so one line should consist of 60 dots, each with a different combination of temperature, model, and prompt.
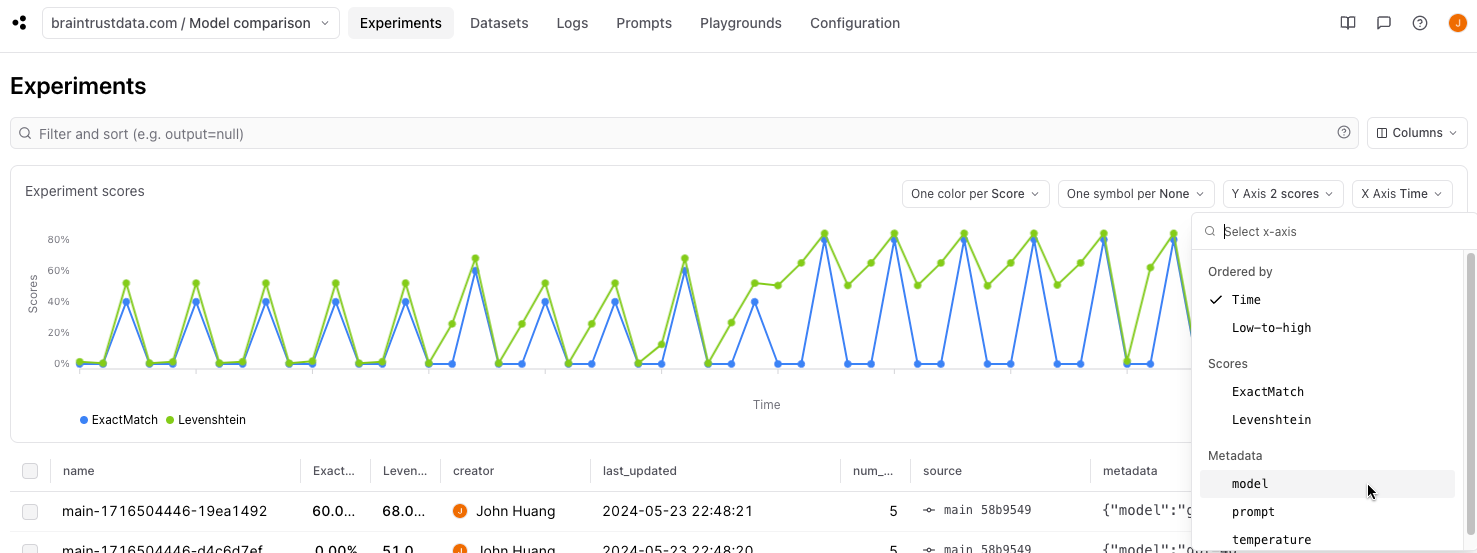
  • Metadata fields are automatically populated as viable X axis values.
  • Metadata fields with numeric values are automatically populated as viable Y axis values.

initial-chart-temperature

Diving in

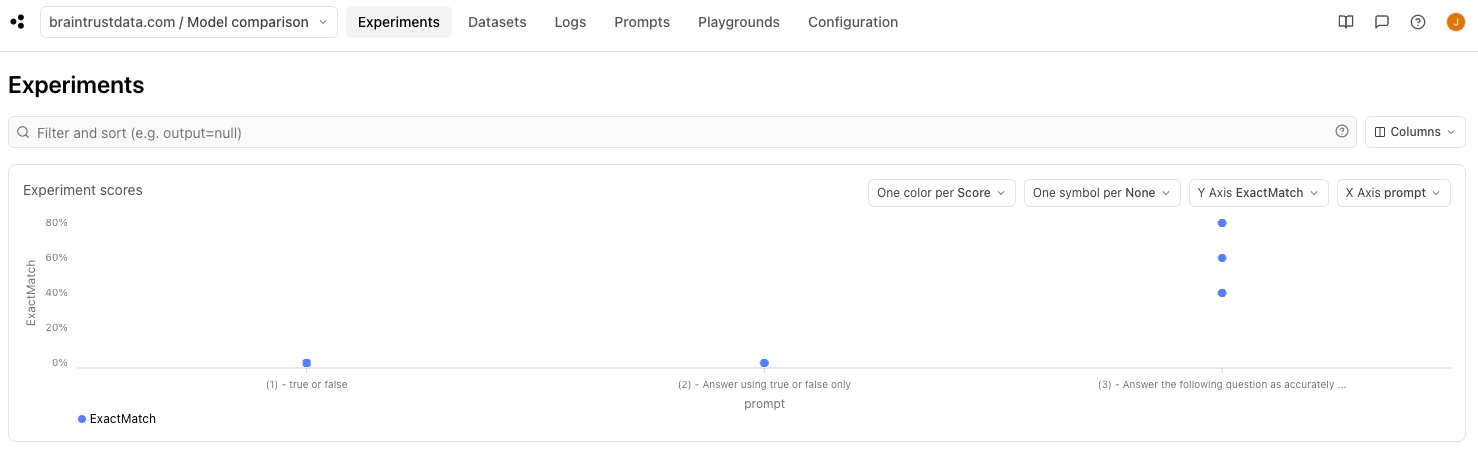
This chart allows us to also group data to allow us to compare experiment runs by model, prompt, and temperature.

By selecting X Axis prompt, we can see pretty clearly that the longer prompt performed better than the shorter ones.

grouped-chart

By selecting the 
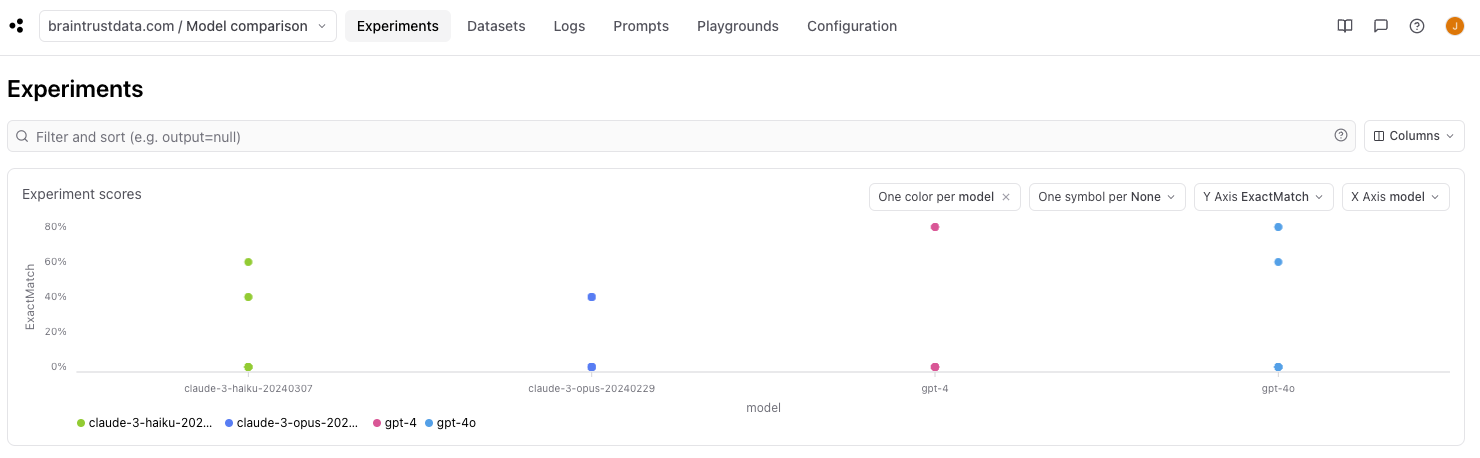
one color per model and X Axis model, we can also visualize performance between different models. From this view we can see that the OpenAI models outperformed the Anthropic models.

grouped-chart

Let's see if we can find any differences between the OpenAI models by selecting the one color per model, one symbol per prompt, and X Axis temperature.

grouped-chart

In this view, we can see that 
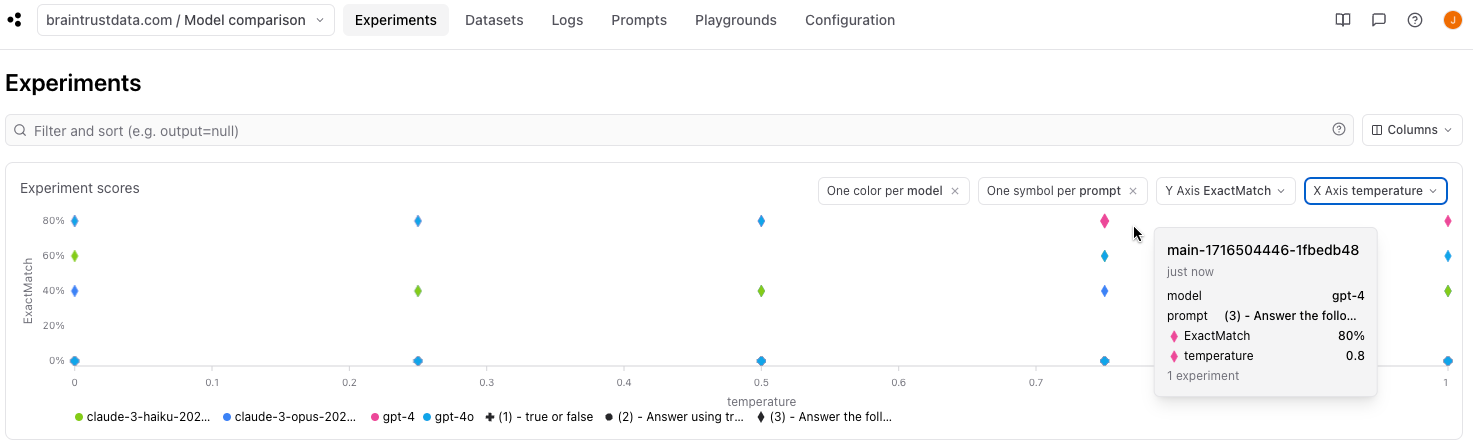
gpt-4 performed better than gpt-4o at higher temperatures!

Parting thoughts

This is just the start of evaluating and improving your AI applications. From here, you should run more experiments with larger datasets, and also try out different prompts! Once you have run another set of experiments, come back to the chart and play with the different views and groupings. You can also add filtering to filter for experiments with specific scores and metadata to find even more insights.

Happy evaluating!