Open Loop
Select Loop in the bottom right corner of the Logs page to open the chat window. Loop keeps track of your queries in a queue, so you can ask multiple follow-ups while it’s running. Use the Enter key to interrupt the current operation and execute the next query in the queue. Loop is also available on the project overview page, when viewing individual traces, and in playgrounds. Select a trace from the logs table and open it in fullscreen or in a separate page, then select Loop in the bottom right corner. Loop maintains conversation history, letting you edit and re-run earlier messages and make inline model adjustments.Configure Loop
Select a model
Change the AI model in the dropdown at the bottom of the Loop chat window. Loop supports Claude, GPT, and Gemini models. Recommended models are labeled Recommended, and newly evaluated models are labeled Beta.Only models from organization-level AI providers are available to Loop. Administrators can configure AI providers at the organization level and select which models are available to Loop.
Toggle auto-accept
By default, Loop asks for confirmation before executing certain actions. To enable auto-accept, select settings in your Loop chat window and select Auto-accept edits.Select data sources
Loop can access different parts of your project. Select add context and search for the data sources you want Loop to query, such as specific datasets or experiments. You can also reference data sources directly in your message by typing@ followed by the name of a dataset, experiment, project log, playground, or SQL query. Loop shows an autocomplete menu of available options organized by type. Select an option to add it as context for your query.
Use slash commands
Type/ in the Loop chat input to see available commands. Slash commands provide quick access to common Loop operations like generating filters, optimizing prompts, or requesting support.
Available slash commands vary by context:
/generate-filter- Create SQL filters from natural language/find-similar- Find semantically similar traces/file-support-ticket- Initiate a support request with the Braintrust team
Analyze logs
Select Loop in the bottom right corner of the Logs page to open the chat window. Use Loop to analyze patterns across all your logs, generate SQL filters from natural language, find similar traces semantically, create datasets from log patterns, and generate scorers based on identified issues. Example queries:- “What are the most common errors?”
- “Show me traces where users were frustrated”
- “Find requests that took longer than 60 seconds”
- “Create a dataset from logs with errors”
- “What user retention trends do you see?”
- “Find common failure modes”
- “What patterns do you see in high-latency requests?”
Generate filters
Use Loop to create SQL queries from natural language descriptions:- Select Filter to open the filter editor.
- Switch to SQL mode.
- Select Generate and describe the filter you want.
- “Only LLM spans”
- “From user John Smith”
- “Logs from the last 5 days where factuality score is less than 0.5”
- “Traces that took longer than 60 seconds”
Find similar traces
Select rows in the logs table and use Find similar traces. Loop analyzes the selected traces to identify common traits and returns similar traces. This helps you:- Discover patterns across different user interactions
- Find edge cases with similar characteristics
- Group related issues together
- Build datasets from similar examples
Analyze individual traces
When viewing a single trace in fullscreen or a separate page, select Loop to analyze that specific trace. Loop can summarize trace execution, identify errors and performance issues, search project logs for similar patterns, and generate custom visualizations.Understand trace execution
Understand trace execution
Ask Loop to summarize or explain what happened in a specific trace:Example queries:
- “Summarize this trace”
- “What are the errors that are happening in this trace?”
- “What was the total latency and where was time spent?”
- “Explain the tool calls that were made”
Find patterns across logs
Find patterns across logs
Loop on trace pages can search your project logs to find similar patterns or related issues:Example queries:
- “Find logs where users showed frustration”
- “Find logs where the agent failed to answer the user’s question”
- “Are there other traces with similar errors?”
- “Show me traces with comparable latency patterns”
Create custom trace visualizations
Create custom trace visualizations
Generate custom views for your trace data using natural language:Example queries:
- “Create a view that renders a list of all tools available in this trace and their outputs”
- “Show a timeline of all LLM calls with their token counts”
Loop on trace pages has a focused set of tools optimized for single-trace analysis. For broader log analysis and dataset generation, use Loop from the main Logs page.
Optimize prompts in playgrounds
Loop is available in playgrounds to help you optimize prompts based on your annotations. After adding thumbs up/down reactions or free text annotations to playground outputs, select Optimize to open Loop with your annotations as context. Loop receives your annotations alongside the playground outputs and can suggest prompt improvements to address issues you’ve flagged.Generate datasets
Create datasets from your logs based on specific criteria: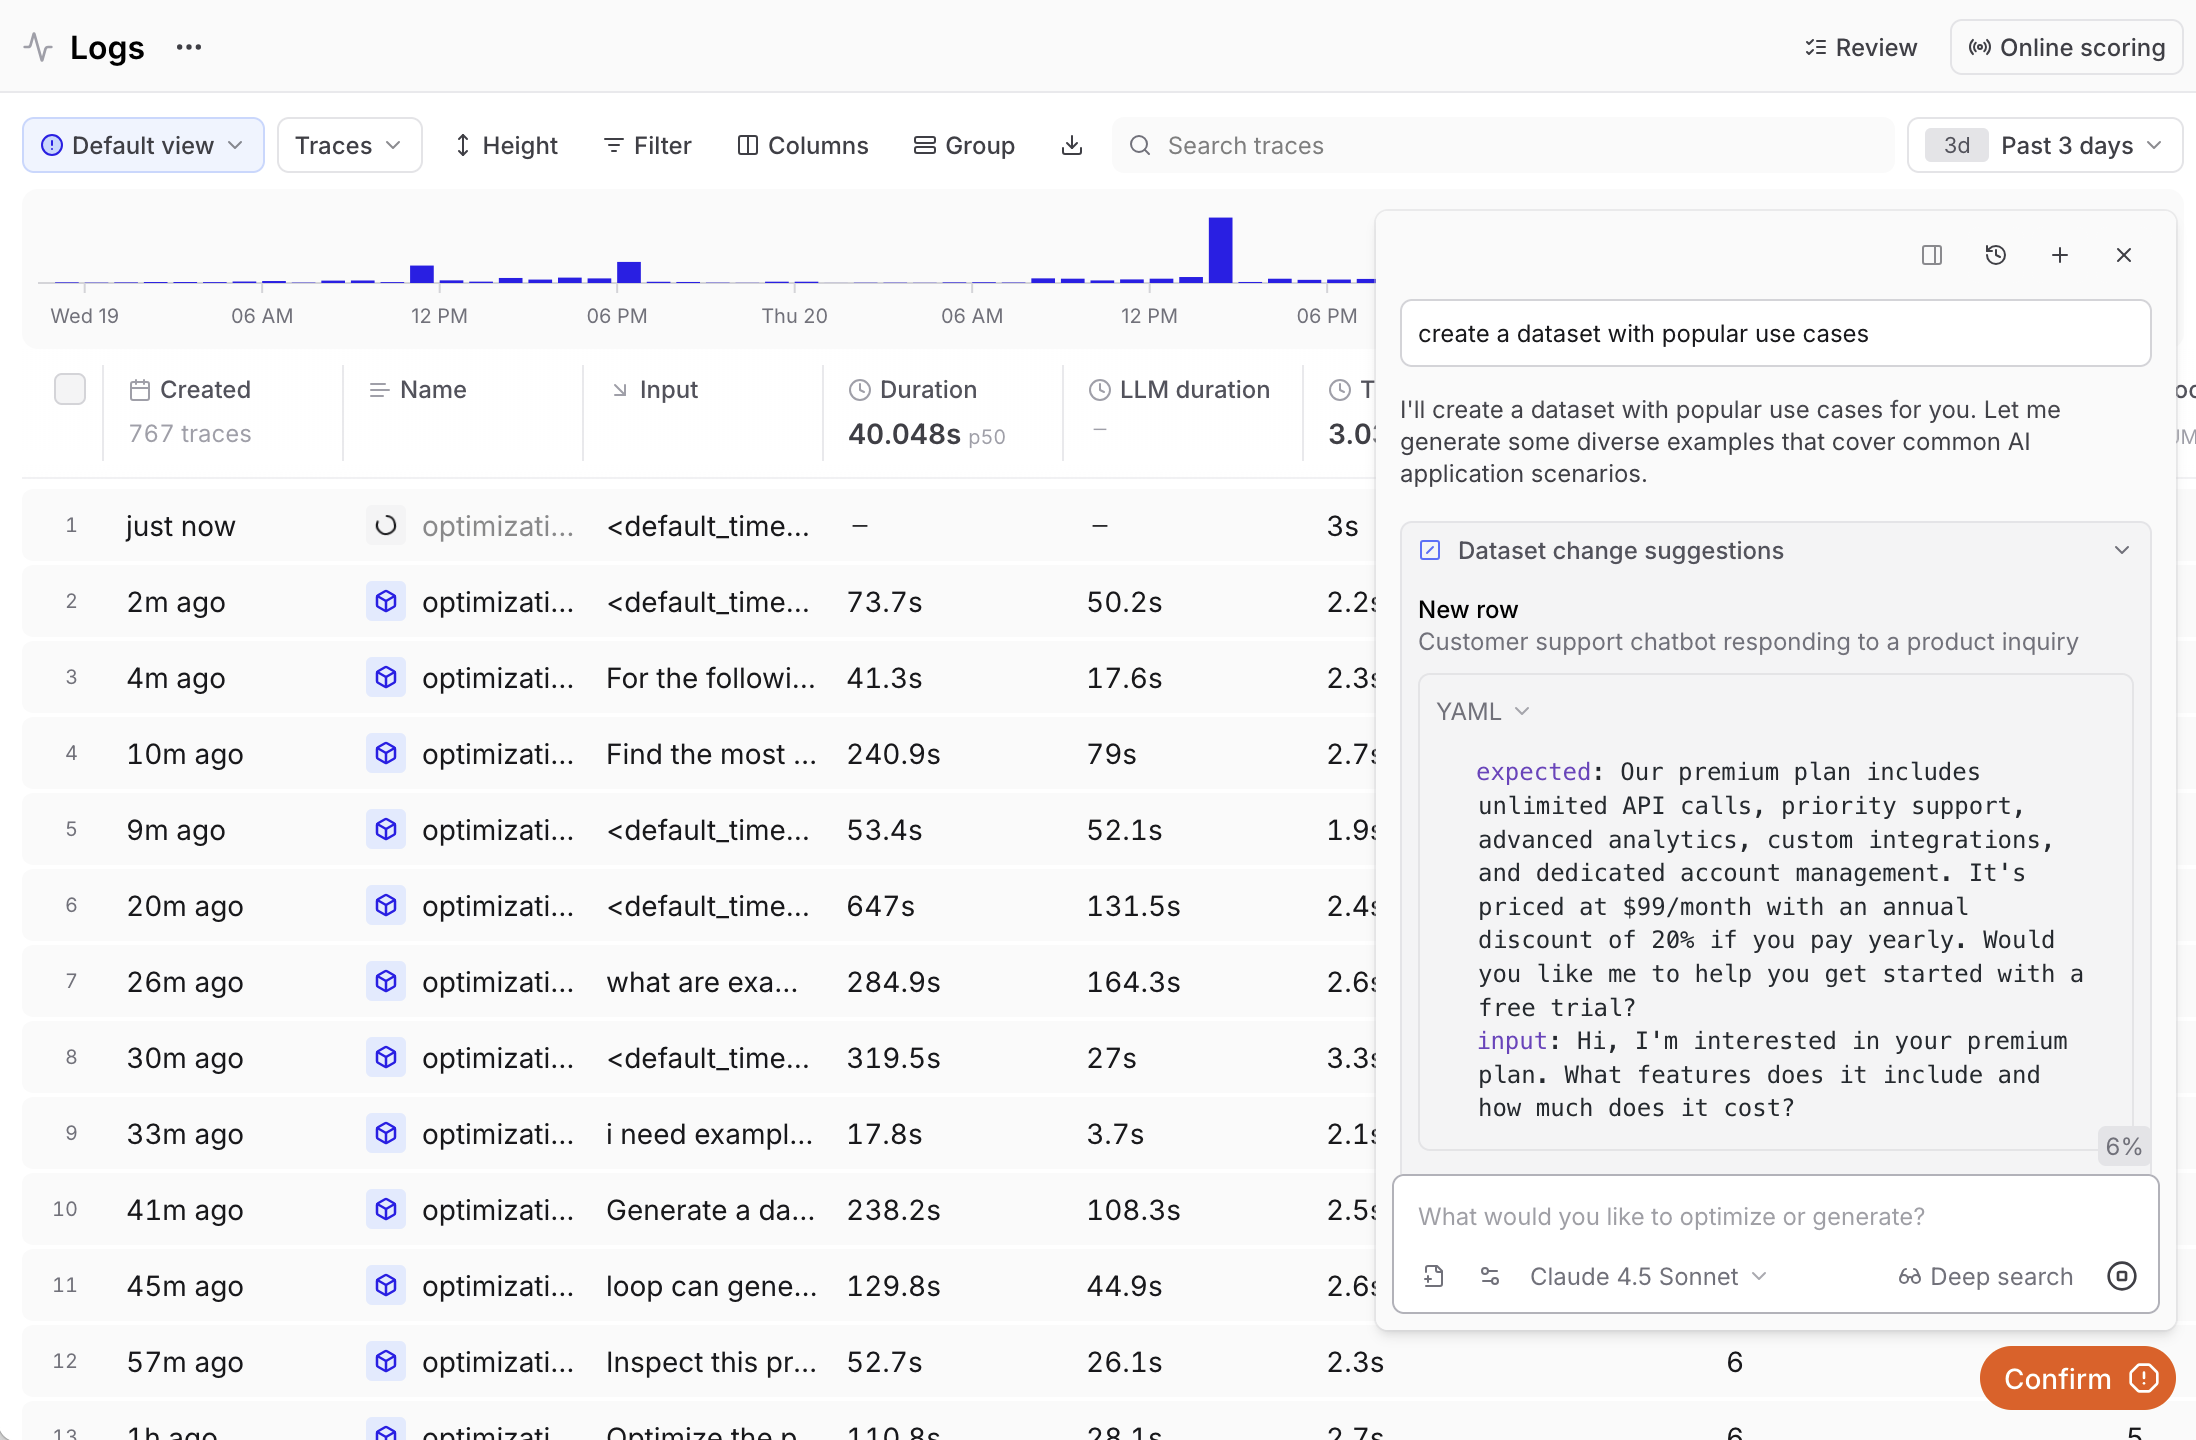
- “Create a dataset from the most common inputs in the logs”
- “Generate a dataset from logs with errors”
- “Build a dataset from high-scoring examples”
Manage dataset versions
When Loop is opened from a dataset page, it can save, list, and restore snapshots and tag versions with environments. Use this to checkpoint a dataset before edits, roll back to a saved version, or promote a snapshot to environments likeproduction or staging without leaving the chat.
Example queries:
- “Snapshot this dataset.”
- “Restore to last week’s snapshot.”
- “Tag the current head as production.”
- “Untag staging.”
- “List environments.”
- “Create a new environment called preview.”
Tagging an environment affects every consumer that loads the dataset by environment, including production evals and automations, so Loop asks for confirmation before applying a tag unless auto-accept is enabled.
Generate scorers
Create scorers based on patterns you identify in logs: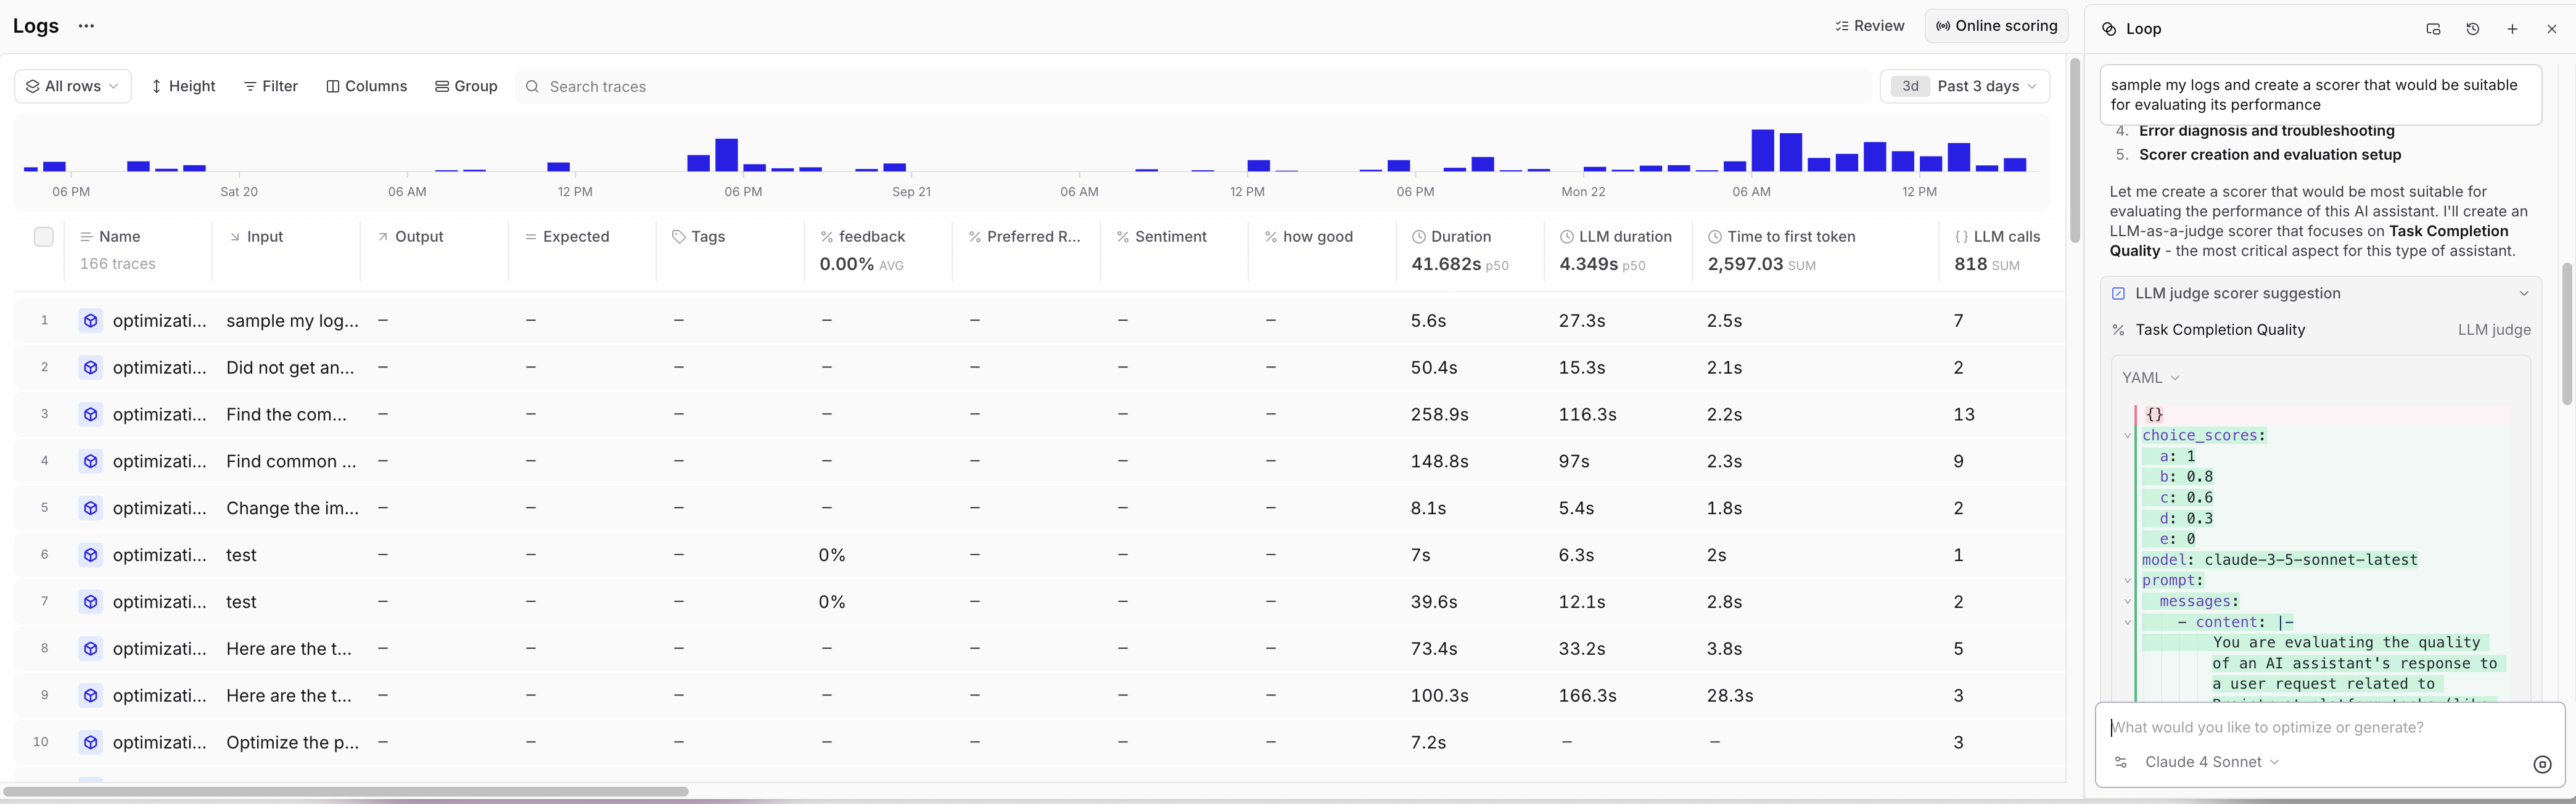
- “Generate a code-based scorer based on project logs”
- “Write a scorer that detects the errors I just identified”
- “Create an LLM-as-a-judge scorer for helpfulness based on these logs”
Search documentation
Ask Loop to search through Braintrust documentation for relevant information and guidance: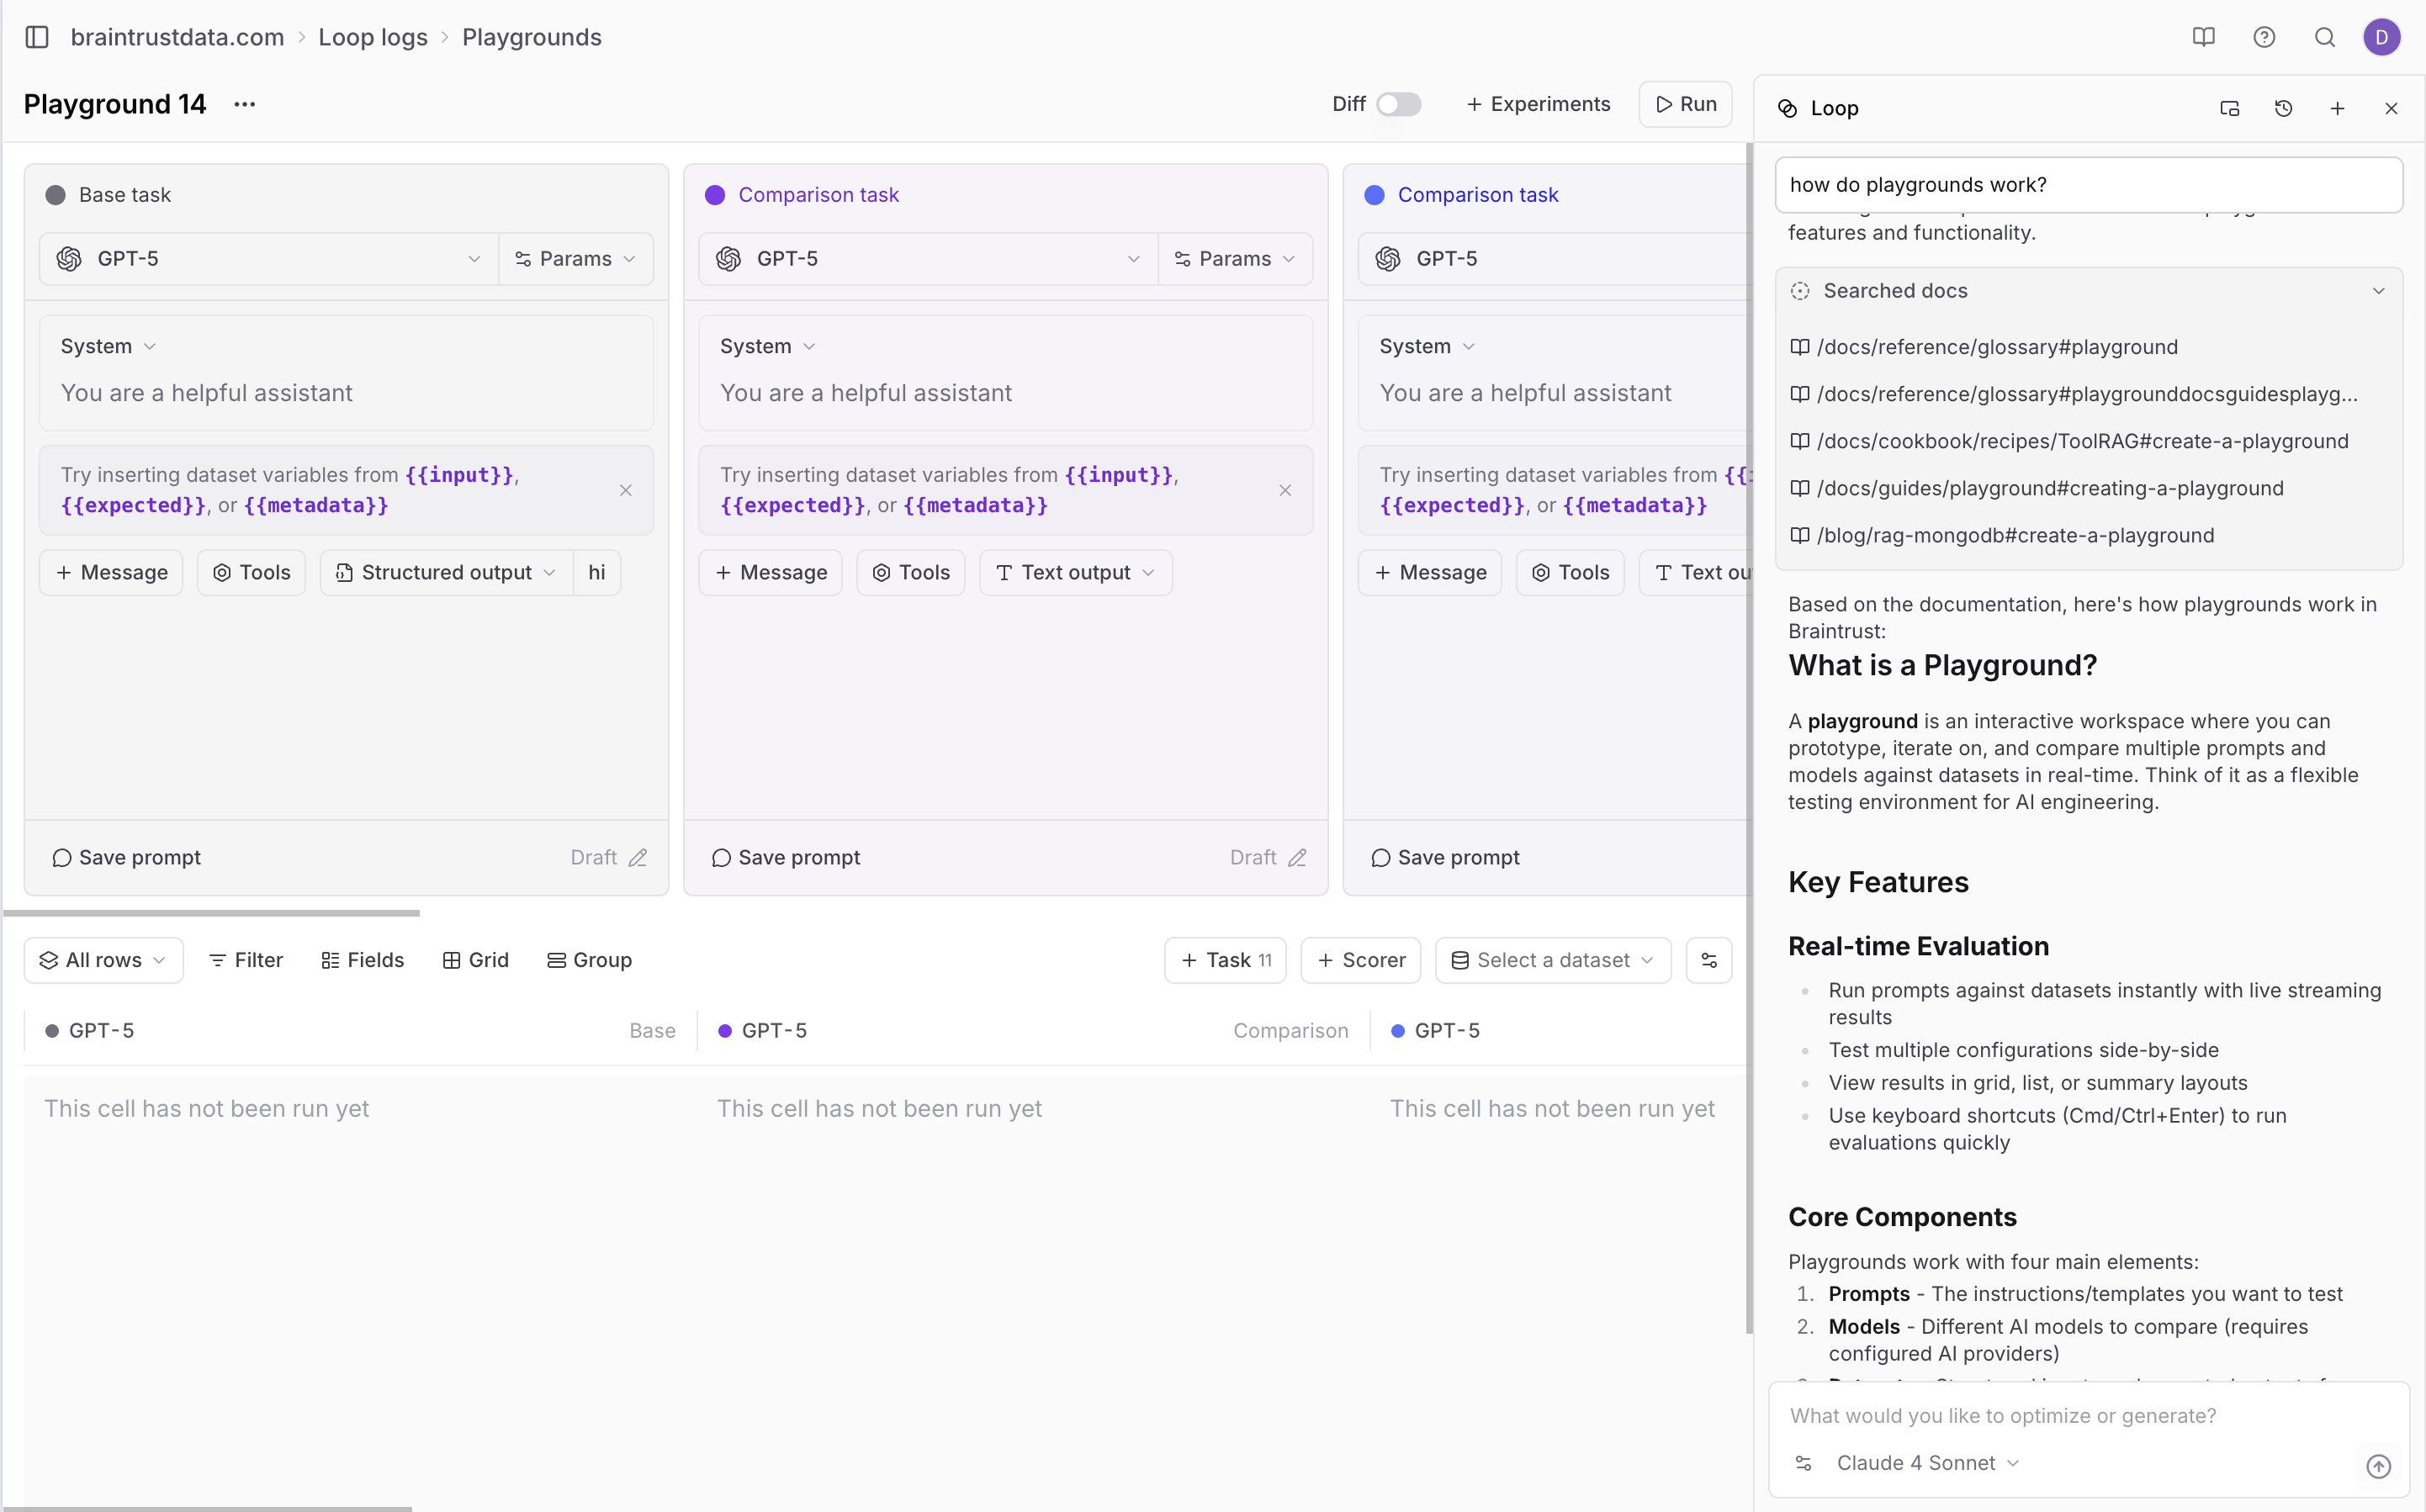
- “How do I use the Braintrust SDK?”
- “What is the difference between a prompt and a scorer?”
- “How do I configure online scoring?”
Request support
Loop can help you file support tickets with the Braintrust support team when you encounter issues or need assistance. When Loop identifies that your question requires support team help, or when you explicitly ask to file a ticket, Loop guides you through creating a support request with a title and description. Example queries:- “I need help with this issue”
- “Can you file a support ticket for this error?”
- “I need to contact support about this problem”
Analyze projects
Select Loop agent in the bottom right corner of a project’s Overview page to analyze that project in depth. Loop has access to the project’s logs, recent experiments, datasets, prompts, and the score progress chart visible on the overview page. Example queries:- “What’s the trend in my accuracy score over the last 7 days?”
- “Which experiments had the biggest score changes?”
- “Show me recent logs with errors”
- “What datasets were created recently?”
- “How has my project’s token usage changed over time?”
- “Which scorer has been improving the most?”
- “Which projects have the highest token usage?”
- “Show me trends in log volume across projects”
- “What projects were created in the last month?”
- “Compare latency metrics across my top 5 projects”
- “Which projects have the most experiments?”
- “Show me projects with declining usage”
Next steps
- Create custom views for tailored interfaces
- Build datasets from patterns you identify
- Create scorers based on log analysis
- Run experiments to validate improvements
- View individual traces to analyze specific executions
- Annotate playground outputs and use Loop to optimize prompts
- Try the Loop cookbook for more examples