Using Braintrust to evaluate agentic setups from large-scale Hugging Face data
Running an AI agent in production generates traces, but making sense of them is a more complex puzzle. Raw agent traces don't come built in with answers. You still have to figure out how to query them, score them, and make sure the patterns you're seeing are real.
To understand this process, we took 1,781 real agent traces from Exgentic, hosted on Hugging Face, and used Braintrust to process them for patterns and high-level learnings.
Here's what we did, how we did it, and what the data actually showed.
The main takeaways (if you only have 5 minutes)
-
The harness matters ~7× more than the model. If you keep the model the same but change the harness, success could swing from 12% to 92%. This change is also nearly free, since harness choice has almost no effect on token cost.
-
Open-weight models are production-ready for coding. DeepSeek and Kimi solved 96% and 94% of SWE-bench tasks successfully, matching the best closed models. The benefit is that you can self-host these models.
-
High average doesn't mean dependable. Some configs score well overall but fall apart on specific task types. Reliable configs are consistent across suites; high-variance configs have at least one suite where they fail badly.
-
There's no universal winner. Claude won SWE-bench and customer service tasks, Gemini won airline support tasks, and DeepSeek and Kimi won AppWorld tasks. The answer to "which is the best model?" is always "depends on the task."
-
Cost per task and cost per success rank configs very differently. Open-weight models cost $0.73–$1.27 per successful SWE-bench task. Closed models cost $4–$5. On conversational tasks, gpt-4.1 flips the table at $0.02–$0.03 per success.
-
Don't always trust token efficiency. gpt-4.1 looked 10–100× cheaper on tokens, but on hard tasks, it was cheap because it failed early, not because it was smarter. Cost without success is just failure with fewer tokens burned.
-
Failure patterns flip. Coding agents that fail use more tokens because they thrash. Customer-service agents that fail use fewer tokens because they give up early.
The dataset: what we were working with
The dataset is from Exgentic on Hugging Face, which has 1,781 agent runs across six benchmarks. Each run includes a task, the agent's complete conversation (every LLM call it made), and metadata like model, benchmark, harness, token count, and number of LLM calls. Each run generates child spans for individual LLM calls. There were ~49k child spans total across all 1,781 runs, averaging about 27 LLM calls per run.
It's important to note that the dataset had zero ground-truth labels. Exgentic never exported the grading verdicts, so all scores and expected fields were null. We had to build our own success measure from scratch, which we'll get to in an upcoming section.
Models
Six models appeared across the dataset:
| Model (API name) | Common name | Type |
|---|---|---|
| claude-opus-4-5 | Claude Opus 4.5 | Closed |
| gemini-3-pro | Gemini 3 Pro | Closed |
| gpt-4.1 | GPT-4.1 | Closed |
| gpt-5.2 | GPT-5.2 | Closed |
| Kimi-K2.5 | Kimi K2.5 | Open-weight |
| DeepSeek-V3.2 | DeepSeek V3.2 | Open-weight |
Closed models are proprietary, meaning that you access them via API but the weights aren't publicly available. Open-weight models publish their weights, so you can download and self-host them.
Benchmarks
The six benchmarks in the dataset cover fundamentally different kinds of tasks:
| Benchmark | What it tests |
|---|---|
| SWE-bench | Fix a real GitHub issue inside a large existing codebase. Read files, edit code, run tests iteratively. Pure software engineering. |
| AppWorld | Complete a personal-assistant task by orchestrating app APIs (Venmo, Gmail, Spotify, Splitwise, Todoist). Often code-heavy. |
| BrowseComp+ | Answer a hard research question by browsing the web. No coding. |
| TAU2 Airline | Customer-service agent handling airline support requests via tools. |
| TAU2 Retail | Customer-service agent handling retail/commerce support. |
| TAU2 Telecom | Customer-service agent handling network and technical support. |
Harnesses
A harness is the agent scaffold wrapped around the model. The model (like Claude and GPT) only predicts text, but the harness does context management and turns that text into actions. It formats the task and available tools into the prompt, parses the model's output into actual actions, executes those actions, feeds results back, manages the loop, handles retries, and decides when to stop.
Five harnesses appeared in the dataset:
claude_code: Anthropic's native agent loop. Uses Claude's custom XML format for tool calls and manages the agentic loop natively.tool_calling: Structured JSON function-calling, one tool call at a time. The standard approach, but tighter constraints.tool_calling_with_shortlisting: Same as above, but with a pre-filtering step that narrows which tools are offered each turn.smolagents_code: Hugging Face's framework. The model writes Python code to call tools, executes it, and returns the output. Lets the agent chain logic in a single step.openai_solo: A minimal OpenAI-style scaffold. Thin wrapper.
Getting the data from Hugging Face into Braintrust
The dataset ships as 39 Parquet shards on Hugging Face. A Parquet file is a column-oriented data format commonly used for storing large datasets efficiently. "Shards" just means the dataset was split across 39 separate files instead of one big file, which is a common pattern for large datasets on Hugging Face.
We import the data with a small, reusable cookbook script, hf_bt_cookbook/import_logs.py. It's a worked example you edit and re-run, not a black box: the entire mapping lives in an EDIT ME block at the top of the file, where you name the Hugging Face repo and which columns hold the session ID, the trace, the metadata, and any scores. The script turns each raw session into Braintrust-shaped JSONL spans and uploads them via bt sync push. Here's how it works:
- Stream the rows with
datasets.load_dataset("Exgentic/agent-llm-traces", streaming=True). Streaming pulls rows on demand, so there's no need to download and materialize all 39 Parquet shards locally. - One session, many spans. For each session row, emit a root span (
type=task) with the initial task, the agent's final response, and all session metadata, plus one child span per LLM call (type=llm) with input/output messages and per-call token metrics. - Deterministic span IDs.
root_id = uuid5(NAMESPACE_DNS, "root:" + session_id). This mattered later, since stable IDs mean re-imports upsert the same rows instead of duplicating, and made a score write-back possible. - Message normalization. The source uses the OpenTelemetry GenAI "parts" format, but we convert to OpenAI-style messages so Braintrust renders them as readable chat turns.
- Preview, then upload. Running the script writes the JSONL and prints the span and session counts with no network writes. Passing
--pushruns the upload for you:bt sync push project_logs:"Hugging Face topics" --in out/logs/.
If your stack already exports OTel spans natively, Braintrust accepts them directly via the OpenTelemetry integration with no conversion step needed.
The final output is all 1,781 sessions → 1,781 root spans in the Hugging Face topics Braintrust project.
The same cookbook also ships hf_bt_cookbook/import_dataset.py, which turns a Hugging Face dataset into a gradable Braintrust dataset if you want to run evals rather than analyze existing traces.
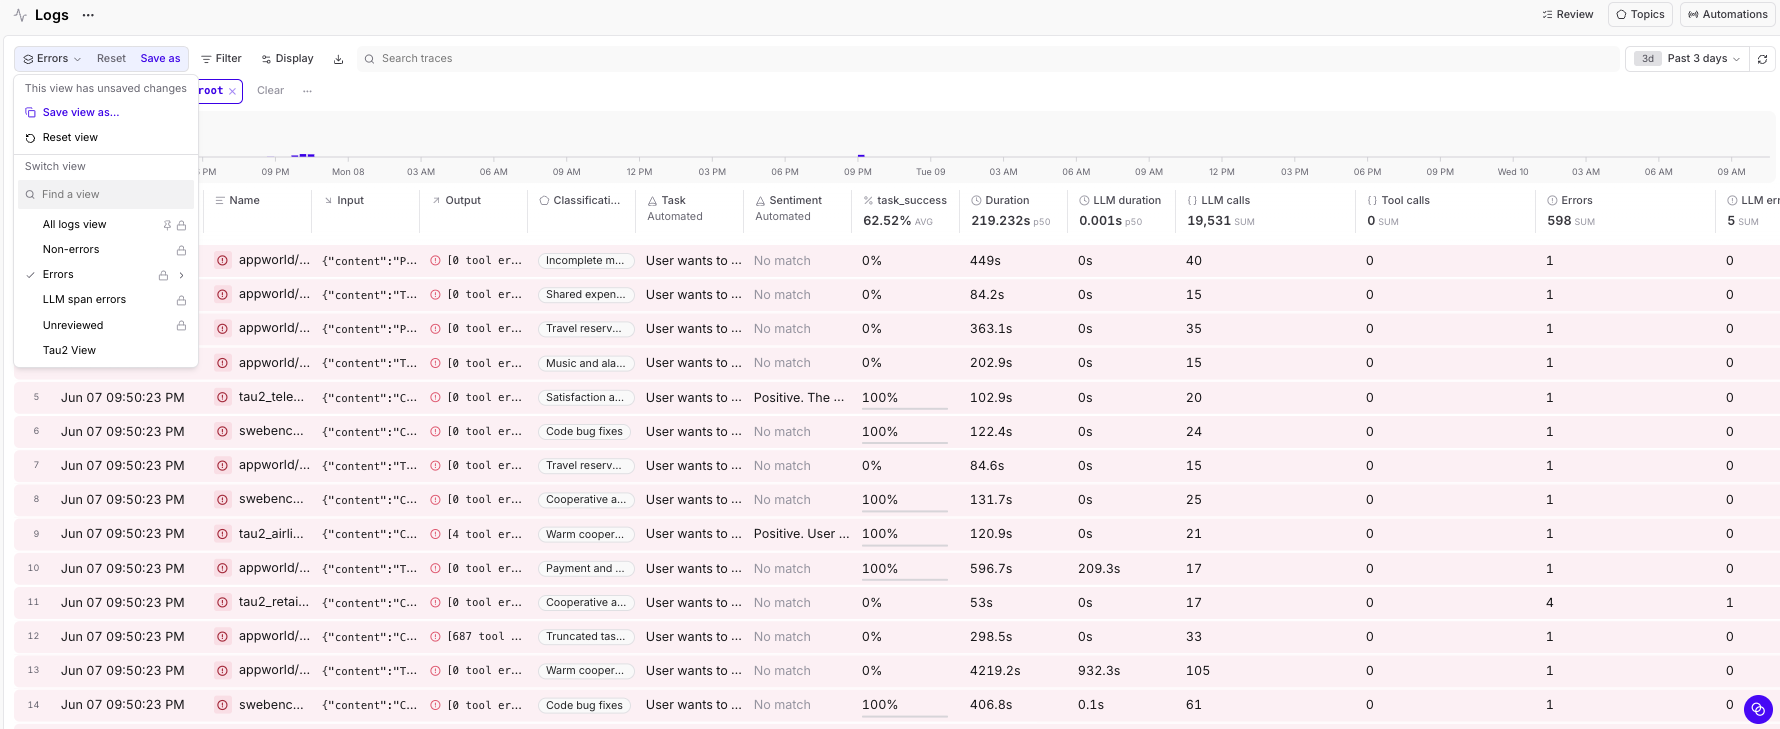
Once imported, every run is a row you can sort, filter, and slice on any metadata field: model, benchmark, harness, tokens, scores, duration. The Braintrust Logs view turns 1,781 opaque Hugging Face JSON files into a queryable table.
Adding success scores as metadata
There was one problem with the dataset. Each benchmark grades against something hidden, like test cases, database state, or proprietary rubrics, but none of that was exported alongside the traces. Basically, the traces had info on the runs but not the verdicts.
Also, the error field in the original dataset is not a crash flag. It's a diagnostic string like "[N tool error(s) detected. Examples: ...]" that appears even when N=0. So the "error rate" is pretty meaningless here, which is exactly why a real success measure was necessary.
To fix this issue, we built an LLM-as-judge proxy to judge success rate of the task completion.
Essentially, for each of 1,781 runs, we extract the full final conversation (all tool calls, results, the agent's final message), feed gpt-4.1 the task, conversation, and a benchmark-specific grading rubric, and get back success (0/1), confidence (low/medium/high), and short reasoning (≤35 words).
Here's the prompt we used for our LLM-as-a-judge:
You grade whether an AI agent SUCCEEDED at a task, from its execution trace.
Task type: {benchmark description}
Grading rule: {benchmark-specific rubric}
You see the task and the agent's full final conversation incl real tool outputs.
Judge from visible verification; you may NOT have the official grader.
Be strict: ambiguous/unverified = 0.
Respond ONLY with JSON: {"success":0 or 1,"confidence":"low"|"medium"|"high","reasoning":"<=35 words"}
Note: we used GPT-4o to judge gpt-4.1's own runs to avoid self-grading.
Reliability varies by benchmark:
- SWE-bench (strong): the judge sees the actual diff and test output, it can verify independently.
- AppWorld and TAU2 (medium): the judge sees tool calls and the agent's confirmation, but not the hidden DB state.
- BrowseComp+ (weak): there's no gold answer. The judge has to infer from reasoning quality.
Once we had scores, we wrote them back to each root span in Braintrust as scores.task_success and metadata.judge_*. Because Braintrust spans are immutable records, we couldn't just patch a field. We had to rebuild complete rows (original data + new score) and re-upload them via bt sync push.
An example of LLM-as-a-judge in action
For example, we had an AppWorld run that finished cleanly with zero tool errors in the original Hugging Face logs, but our LLM-as-a-judge scored a failure.
- Log:
86c1014d-321f-522b-ae63-5a0b2da977f9,appworld,claude-opus-4-5 - Task: "Reset friends on Venmo to be the same as my friends in my phone. Befriend and unfriend as needed."
- Judge reasoning: "The agent only attempted to remove friends from Venmo but did not add any missing friends from the phone contacts. The task required both befriending and unfriending."
- What the agent actually did: login →
search_friends×3 →show_profile×2 →remove_friend×~15 →finish(success). Zeroadd_friendcalls.
From the trace, we learned that the agent did half the task, declared success, and had a perfectly clean error log. A finish-status or error-count metric would have called this a pass. This is why task_success had to be built from trace content and not from status codes.
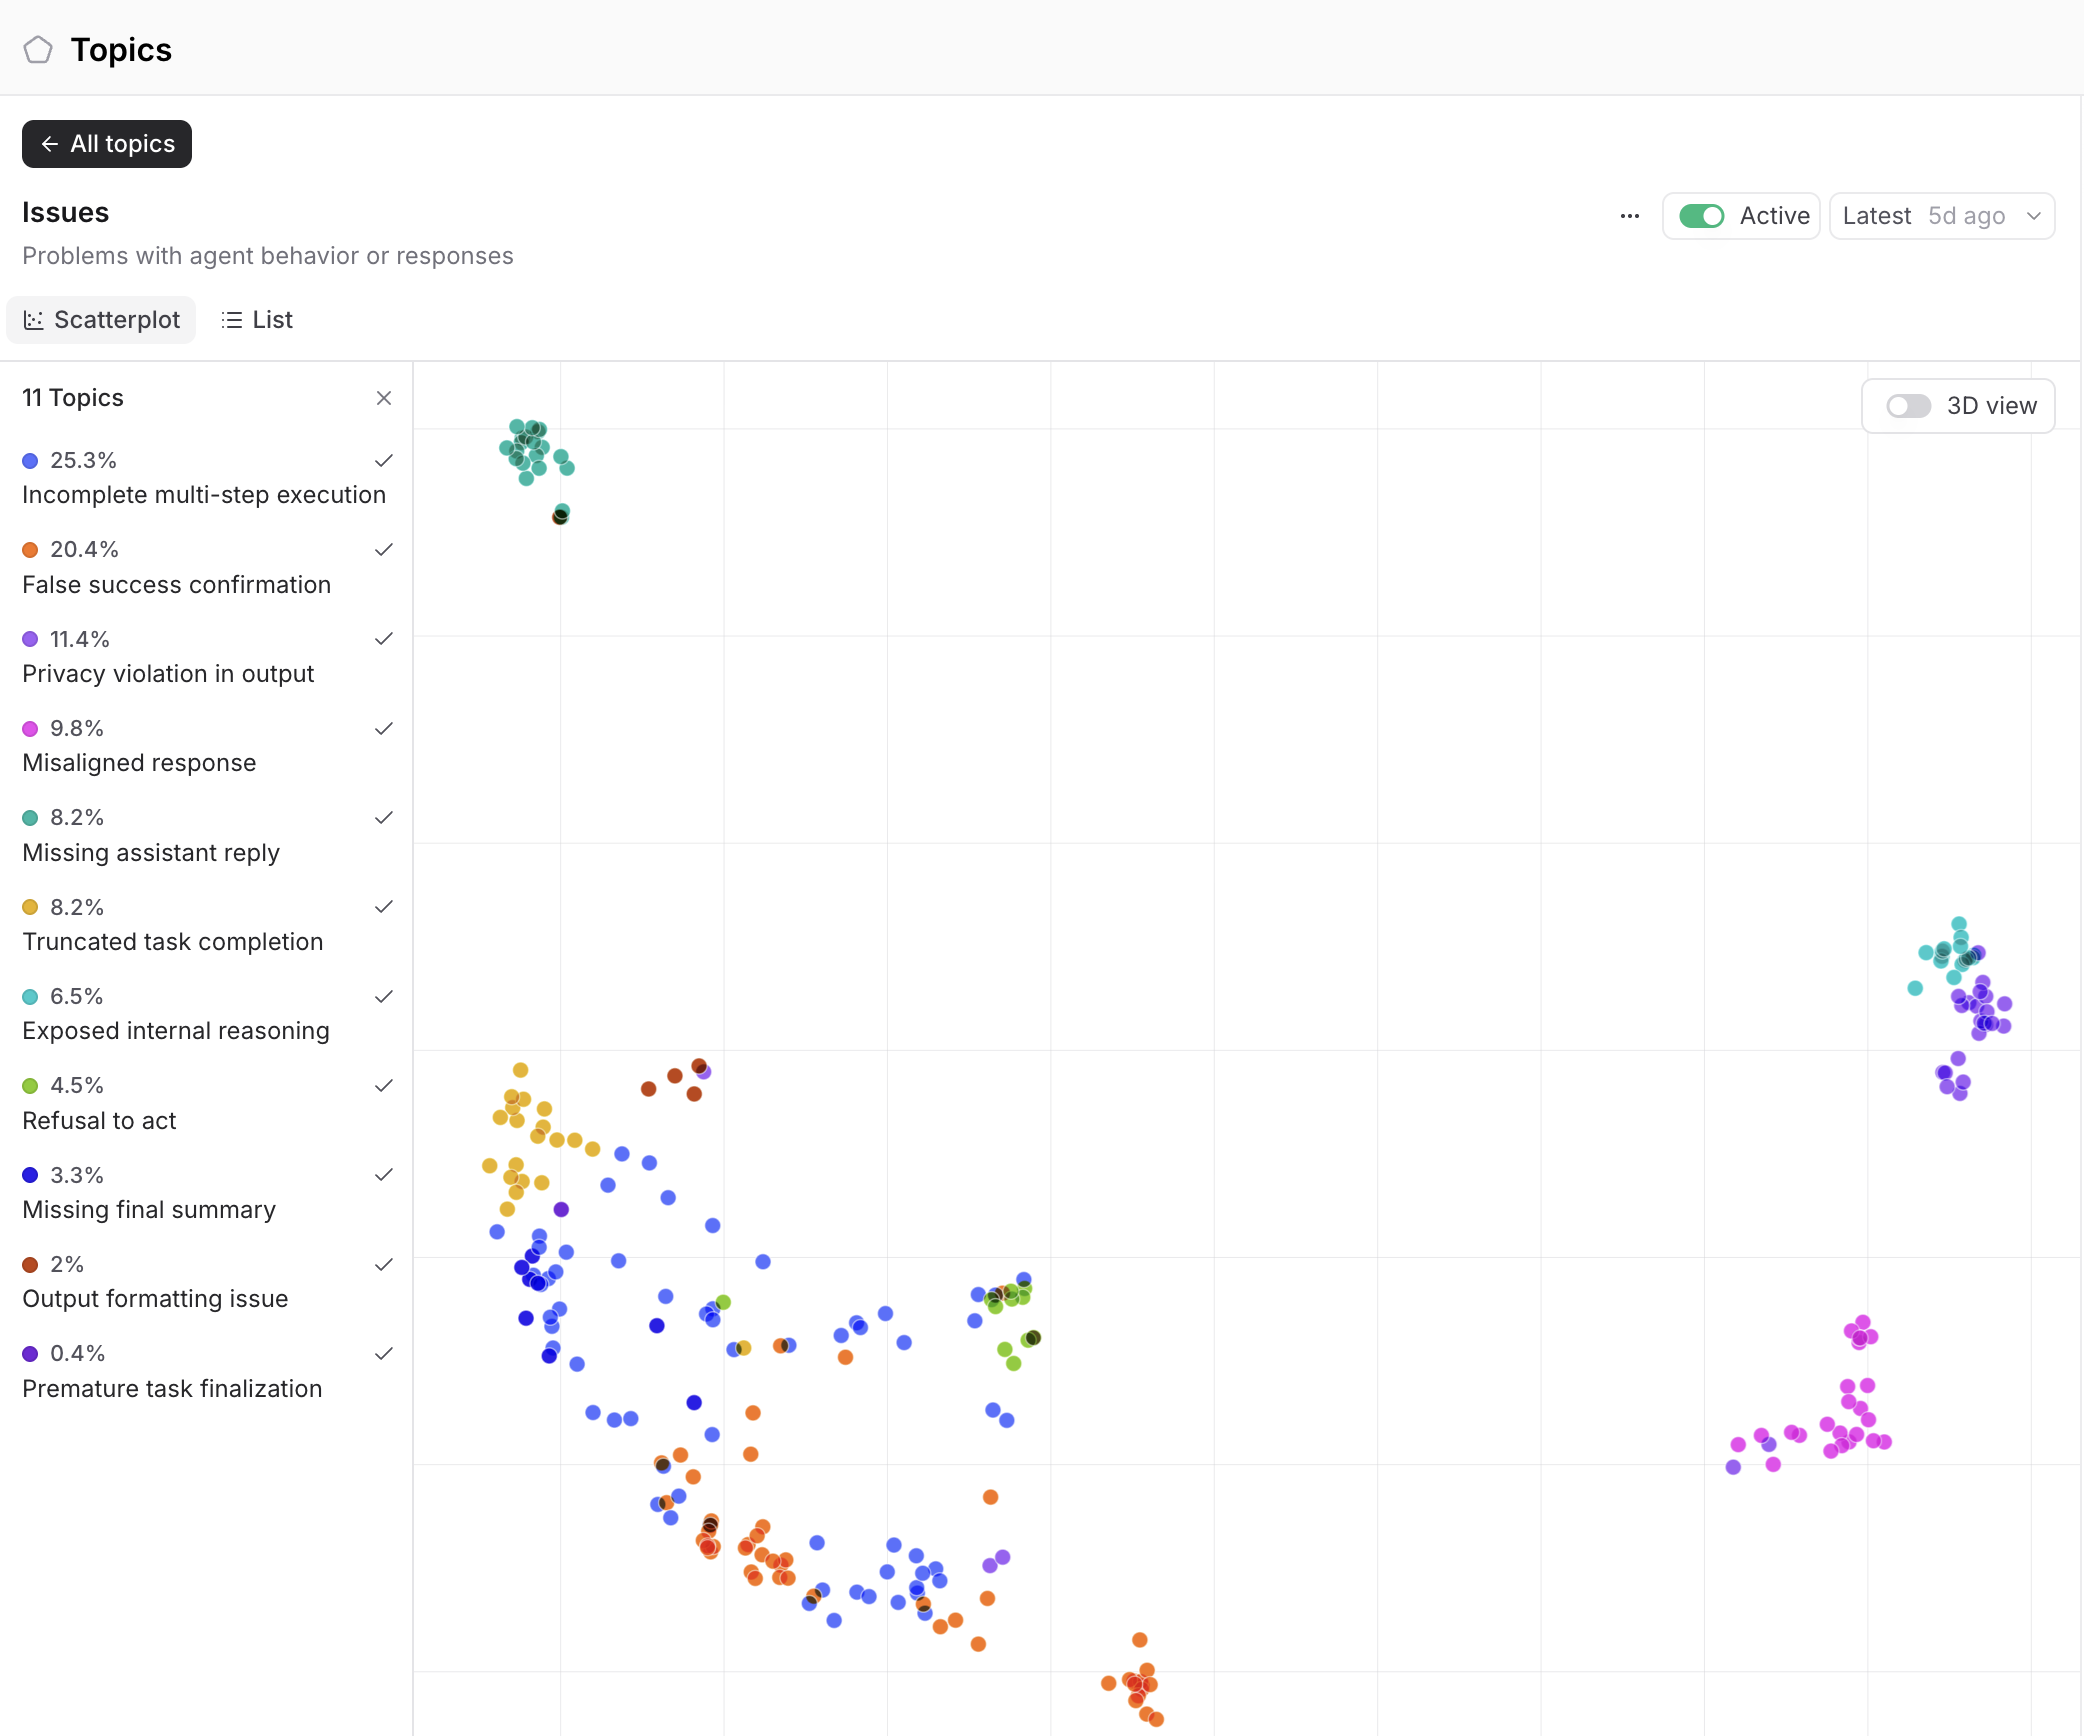
What's worth noting is that Braintrust Topics found this failure class on its own, without us pointing it out. The Issues facet clustered agent misbehaviors into 11 named groups, and False success confirmation (10.9%) is exactly the Venmo pattern above. Incomplete multi-step execution (32.2%) and Truncated task completion (13.7%) match the thrash and give-up modes we quantify later. The failure taxonomy we built by hand fell out of the clustering automatically.
Analyzing the data
How to read these graphs
Before diving in, a quick reference for what the visual elements in the charts below actually mean:
| Symbol | What it is |
|---|---|
Error bar / ± | Wilson 95% CI on a success rate; widens for small samples, stays in [0,1] |
| Bar height | Pooled (micro) success rate: k/n over all of a config's runs |
| ♦ diamond | Benchmark-balanced (macro) rate: average of per-suite rates, weighted equally |
| Box / whiskers | IQR (25th–75th percentile), median line, whiskers = 1.5×IQR |
Why you can't just pool averages
Not all models ran all benchmarks. Claude and Gemini ran on all six benchmarks. DeepSeek and Kimi ran only AppWorld and SWE-bench. gpt-4.1 ran only TAU2. Pooling averages across this uneven coverage is Simpson's paradox, where a model can look "better" just because it ran easier tasks.
| Model | appworld | browsecompplus | swebench | tau2_airline | tau2_retail | tau2_telecom |
|---|---|---|---|---|---|---|
| claude-opus-4-5 | 119 | 49 | 138 | 34 | 126 | 43 |
| gemini-3-pro | 170 | 77 | 30 | 38 | 34 | 12 |
| Kimi-K2.5 | 49 | 7 | 75 | — | — | — |
| DeepSeek-V3.2 | 62 | — | 55 | — | — | — |
| gpt-4.1 | — | — | — | 124 | 295/14 | 131 |
| gpt-5.2 | — | — | 37/15 | — | — | — |
The fix is to compare only within benchmarks. Instead of pooling all runs together, we average each config's success rate per benchmark equally. Balancing means giving every benchmark equal weight regardless of task count. That way a config can't inflate its overall score just by running more easy tasks. We also attached Wilson 95% CIs so small cells read as uncertain, not as confident extremes. So for example, a 10/10 success rate on 10 runs reads very differently than 138/138 on 138 runs.
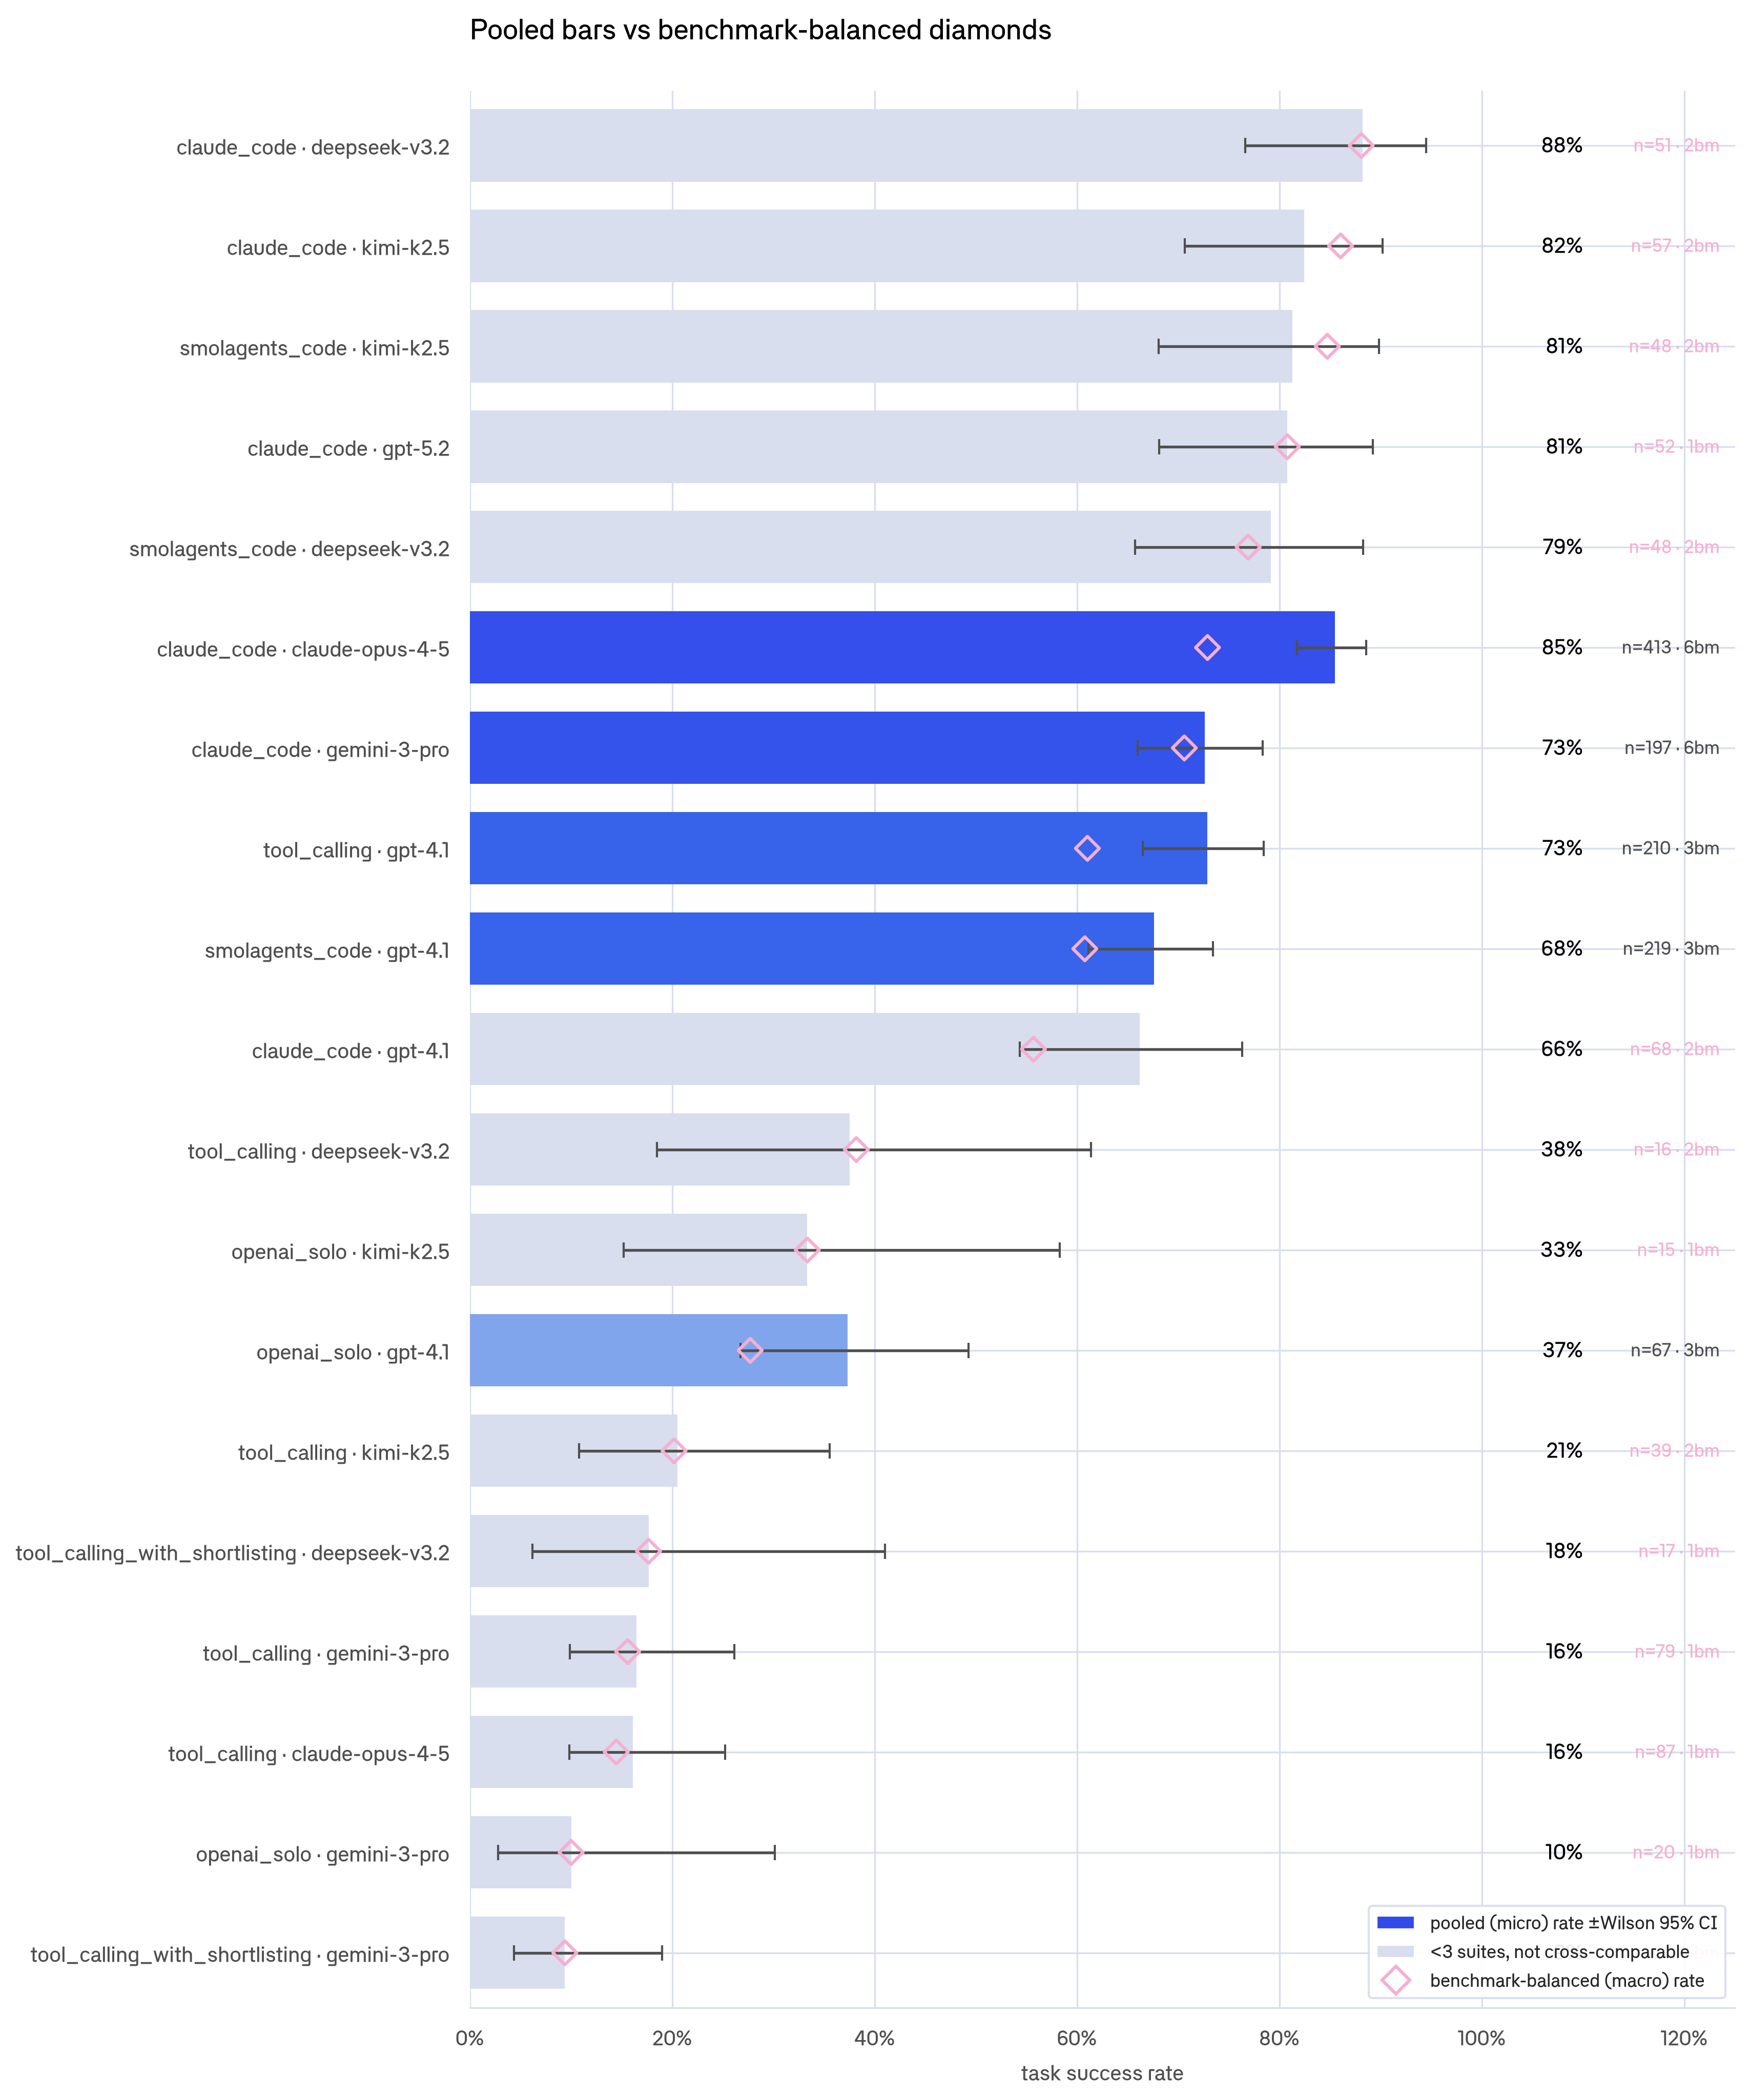
Bars show the pooled rate; diamonds show the benchmark-balanced rate. Where the diamond sits well to the left of its bar, that config's headline is flattered by an easy task mix.
In the graph, solid bars represent the harness x model combos that ran on at least three suites, which we therefore deemed the most statistically meaningful. Among those, claude_code is the strongest harness. With Claude it hits 73% and with Gemini 71%, both ahead of the three gpt-4.1 harness configurations (tool_calling at 61%, smolagents_code at 61%, and openai_solo at 28%).
The ultimate table
However, a single (harness × model) cell often mixes benchmarks. Claude's 119 AppWorld sessions split across tool_calling (83), claude_code (27), and openai_solo (9). So the truly fair comparison unit is benchmark × harness × model.
The table below combines token cost, duration, LLM call count, and judged success rate for every (benchmark × harness × model) combination that had at least 10 runs, which is the minimum we needed to treat a result as directionally meaningful.
APPWORLD                                n  calls   Mtok   dur  succ%
claude_code      DeepSeek-V3.2         25   19.9   2.25   387    80
claude_code      Kimi-K2.5             18   17.7   1.17   398    78
claude_code      claude-opus-4-5       27   31.7   4.19   316    26
smolagents_code  Kimi-K2.5             12   12.9   0.53   429    92
openai_solo      gemini-3-pro          20   19.2   1.10   339    10
tool_calling     DeepSeek-V3.2         11   17.7   1.64   891    36
tool_calling     gemini-3-pro          77   15.6   0.59   263    16
tool_calling     claude-opus-4-5       83   25.7   2.09   221    14
tool_calling     Kimi-K2.5             17   17.5   0.91   657    12
tcw_short        DeepSeek-V3.2         17   19.3   0.21   531    18
tcw_short        gemini-3-pro          64   28.8   0.27   370     9

BROWSECOMPPLUS                          n  calls   Mtok   dur  succ%
claude_code      claude-opus-4-5       49   30.1   2.41   168    69
claude_code      gemini-3-pro          77   20.5   1.29   231    55

SWEBENCH                                n  calls   Mtok   dur  succ%
claude_code      claude-opus-4-5      138   27.8   0.82   213   100
claude_code      DeepSeek-V3.2         26   58.8   2.07  1220    96
claude_code      Kimi-K2.5             35   46.0   1.08   477    94
claude_code      gpt-5.2               15   29.9   0.74   106    93
claude_code      gemini-3-pro          30   52.2   1.87   469    87
claude_code      Az/gpt-5.2            37   24.1   0.52   144    76
smolagents_code  DeepSeek-V3.2         24   63.8   1.62  1503    88
smolagents_code  o/Kimi-K2.5           28   87.9   2.58   700    75
smolagents_code  o/DeepSeek-V3.2       13   84.7   2.36   647    69
openai_solo      Kimi-K2.5             12   36.8   0.33   227    33
tool_calling     Kimi-K2.5             21   43.3   0.55   273    29

TAU2_AIRLINE                            n  calls   Mtok   dur  succ%
claude_code      gemini-3-pro          38   11.1   0.24   124   100
claude_code      claude-opus-4-5       34   12.1   0.32    74    65
tool_calling     gpt-4.1               59    5.8   0.01    24    47
smolagents_code  gpt-4.1               47    6.3   0.01    54    40
openai_solo      gpt-4.1               16    4.8   0.01    31    12

TAU2_RETAIL                             n  calls   Mtok   dur  succ%
claude_code      claude-opus-4-5      126   13.6   0.35    69    95
claude_code      gpt-4.1               30    7.4   0.01   144    93
claude_code      Az/gpt-4.1            14    7.4   0.01   204    93
smolagents_code  gpt-4.1              104    6.3   0.01    97    90
tool_calling     gpt-4.1              127    7.4   0.01    92    90
claude_code      gemini-3-pro          34   12.4   0.27   112    82
openai_solo      gpt-4.1               34    5.9   0.01    76    65

TAU2_TELECOM                            n  calls   Mtok   dur  succ%
claude_code      claude-opus-4-5       39   16.8   0.48   116    82
smolagents_code  gpt-4.1               68   20.3   0.07   170    51
tool_calling     gpt-4.1               24   17.0   0.07   151    46
claude_code      gemini-3-pro          10    9.0   0.21   145    33
claude_code      gpt-4.1               22   24.7   0.09   224    18
openai_solo      gpt-4.1               17    3.1   0.01    18     6
tcw_short = tool_calling_with_shortlisting. Az/ = Azure-hosted variant. o/ = open-weight model accessed via OpenAI-compatible Azure endpoint.
There are a few cells worth calling out. Kimi x smolagents_code x AppWorld is the standout open-weight result with 92% success at 0.53M tokens. gpt-5.2 x claude_code x SWE-bench is the overall cost/outcome winner, with 93% at 0.52M tokens and the fastest wall-clock time in the table. Claude x claude_code x AppWorld is the worst at 26% success at 4.19M tokens.
Specific findings
Finding 1: the harness matters ~7× more than the model
When we hold the model and benchmark fixed and change only the harness, we see success can swing up to 81 percentage points:
- Claude on SWE-bench: 100% (
claude_code) vs 14% (tool_calling) - Kimi on AppWorld: 92% (
smolagents_code) vs 12% (tool_calling) - gpt-4.1 on telecom: 51% (
smolagents_code) vs 18% (claude_code)
To confirm this isn't just coverage noise, we ran a regression on all 1,780 rows (1,781 sessions minus one that had no judge score). A linear-probability regression predicts the probability of success (0 or 1) for each run, isolating the effect of one variable (in this case, the harness) while holding model and benchmark constant. We used HC1 standard errors, a correction that accounts for the fact that variance isn't uniform across configs, so the confidence intervals stay reliable. Controlling for both model and benchmark, we found:
- Harness explains ~5.3% of the variation in success. This means that after controlling for model and benchmark, the harness still accounts for 5.3% of the remaining differences in outcomes.
- Model explains only ~0.7%. Swapping models barely moves success rates once you've accounted for which harness and benchmark you're using. Changing the harness explains 7× more.
claude_codeis +28 points abovetool_calling, which is the baseline because it is the most common harness in the dataset and therefore used as the reference point for comparison.
And harness choice barely changes token cost. Within the same benchmark, configurations that differ only in harness spend similar amounts per run. So it's the highest-leverage, cheapest dial you control.
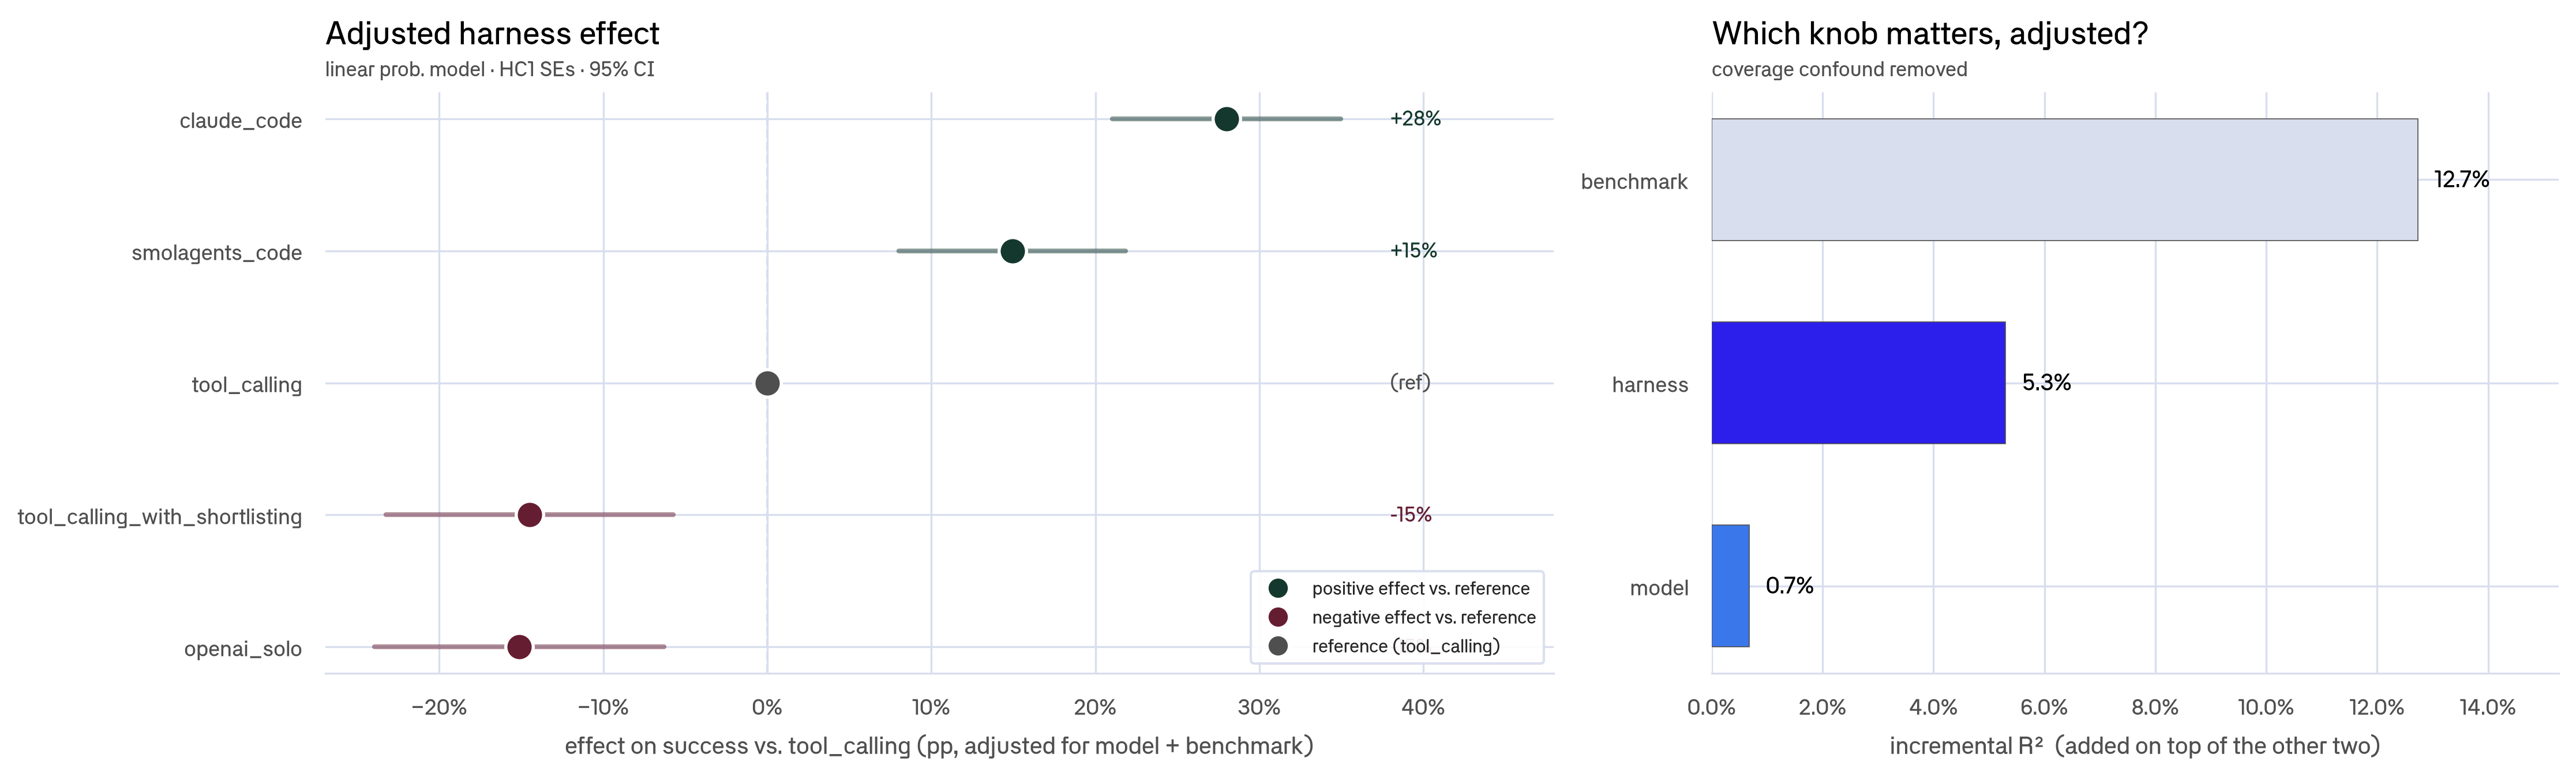
The left panel shows each harness's effect on success relative to tool_calling, with model and benchmark held fixed. The right panel shows how much of the variation in success each factor explains.
claude_code and smolagents_code harnesses both improve performance. claude_code uses Claude's native agent-style interaction, while smolagents_code lets the model write and execute code to call tools. tool_calling_with_shortlisting undercuts performance, suggesting that narrowing the available tool set can remove useful options or introduce routing mistakes.
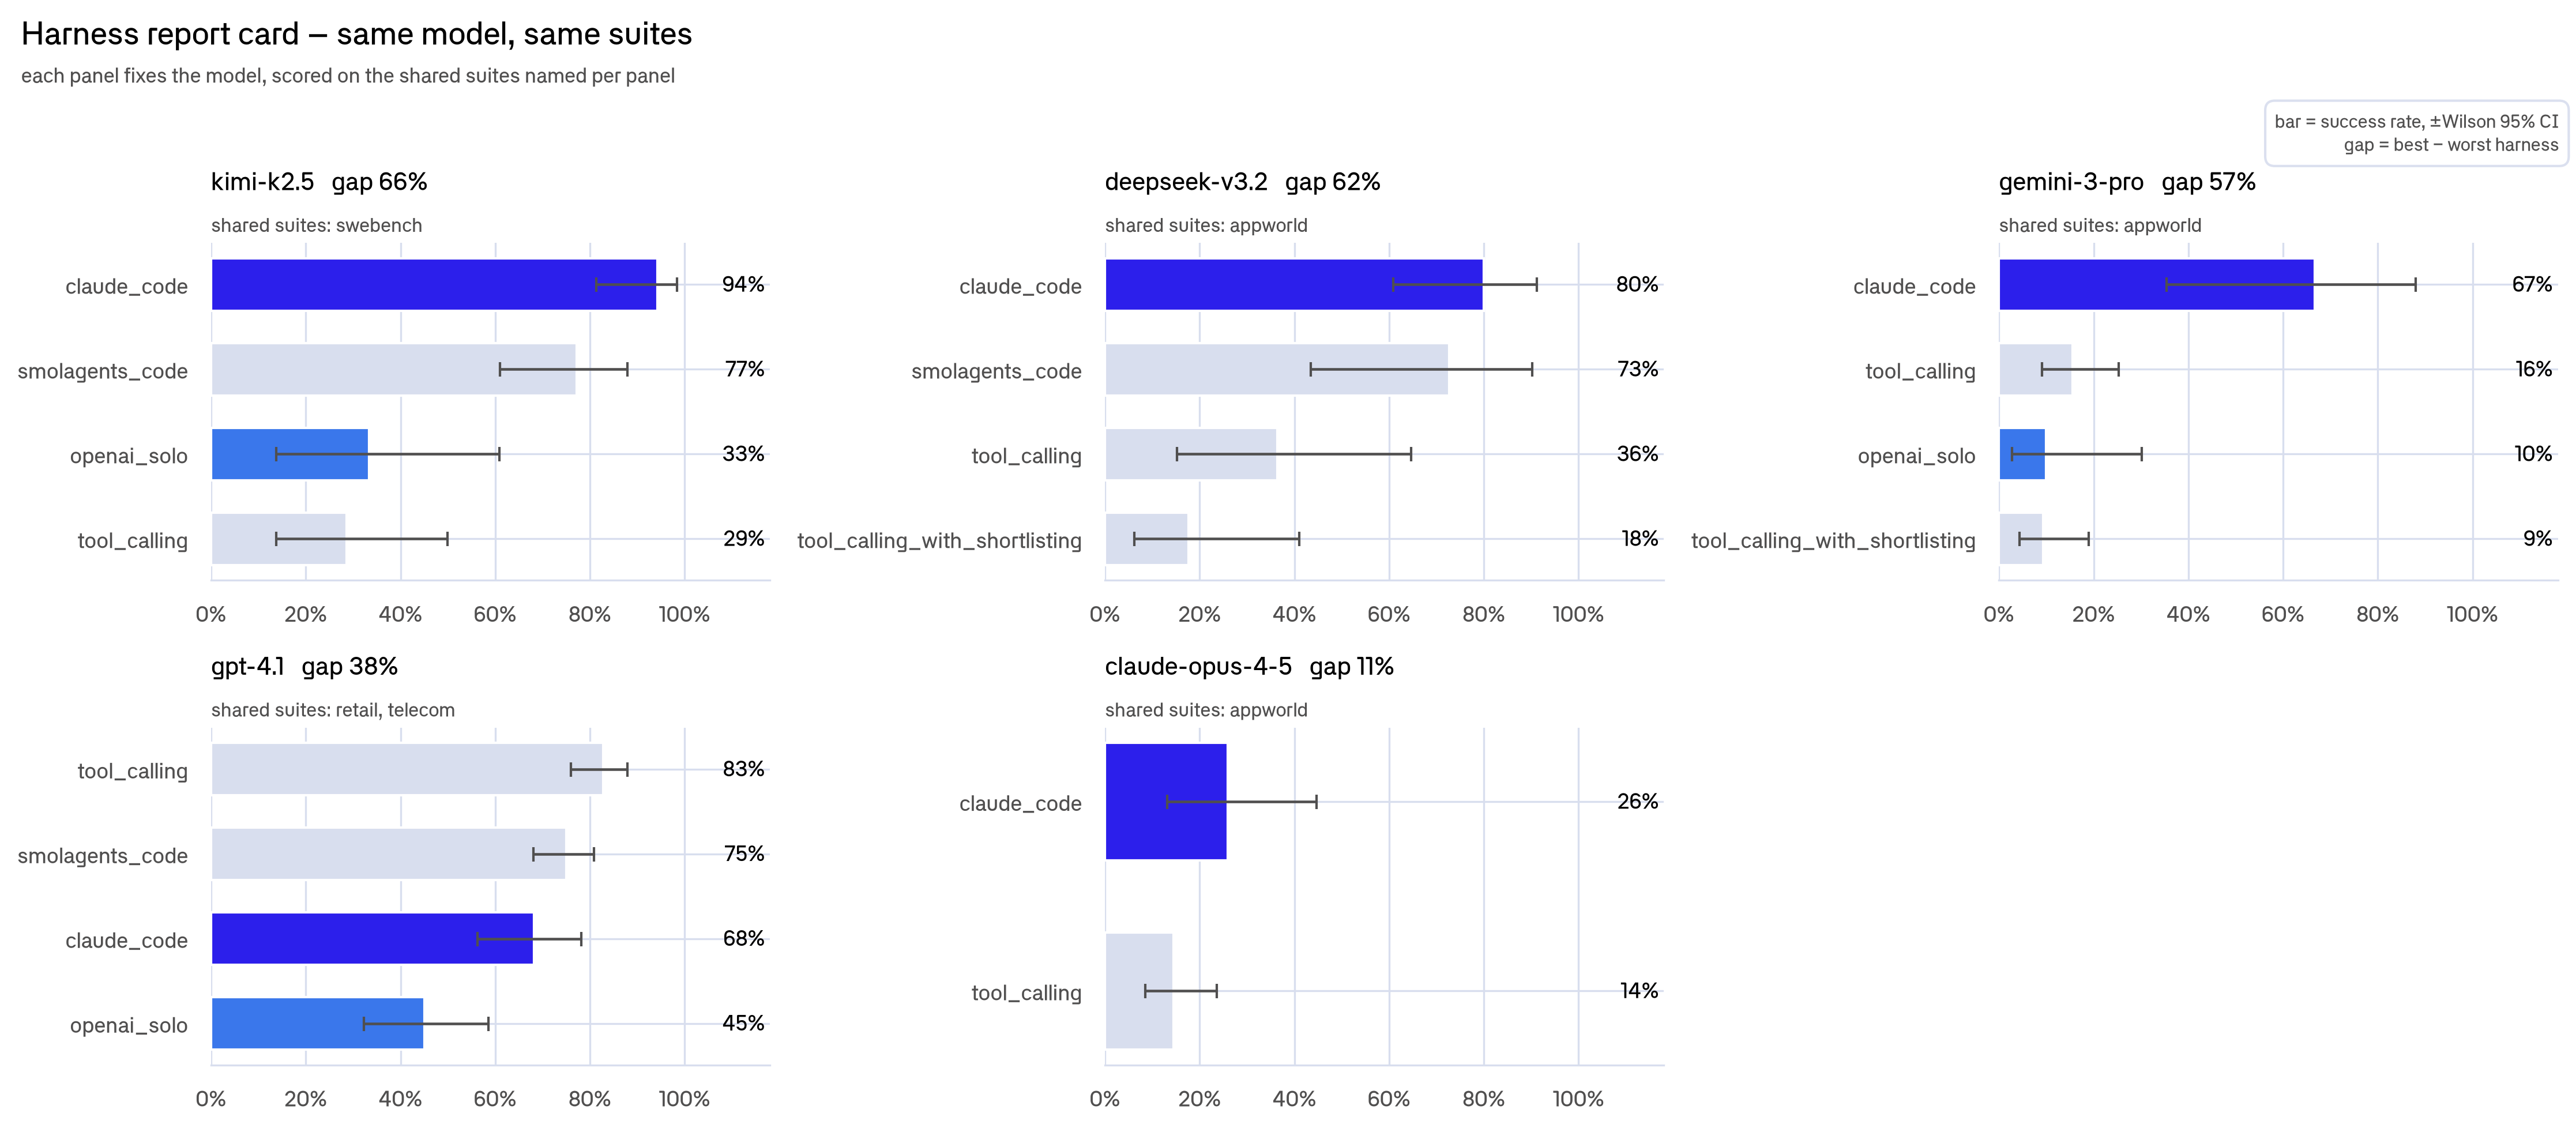
Each panel fixes the model; each bar is one harness's success rate on the suites that model ran. The shared suites are named under each panel title.
Finding 2: open-weight models are production-ready for coding
On SWE-bench with the claude_code harness:
| Model | Success rate |
|---|---|
| claude-opus-4-5 | 100% |
| DeepSeek-V3.2 | 96% |
| Kimi-K2.5 | 94% |
| gpt-5.2 | 93% |
| gemini-3-pro | 87% |
Above, we see that open-weight models tie or beat closed models at the frontier of coding tasks. The biggest benefit of open-weight models is that you can self-host them (which makes it a lot cheaper).
Finding 3: high average doesn't mean dependable
A config can score well on average but completely fall apart on a specific task type. Plotting each config's benchmark-balanced success rate against its cross-task spread separates the field into two groups: reliable configs (high success, consistent across suites) and high-variance configs (high average, but with at least one suite where they fail badly).
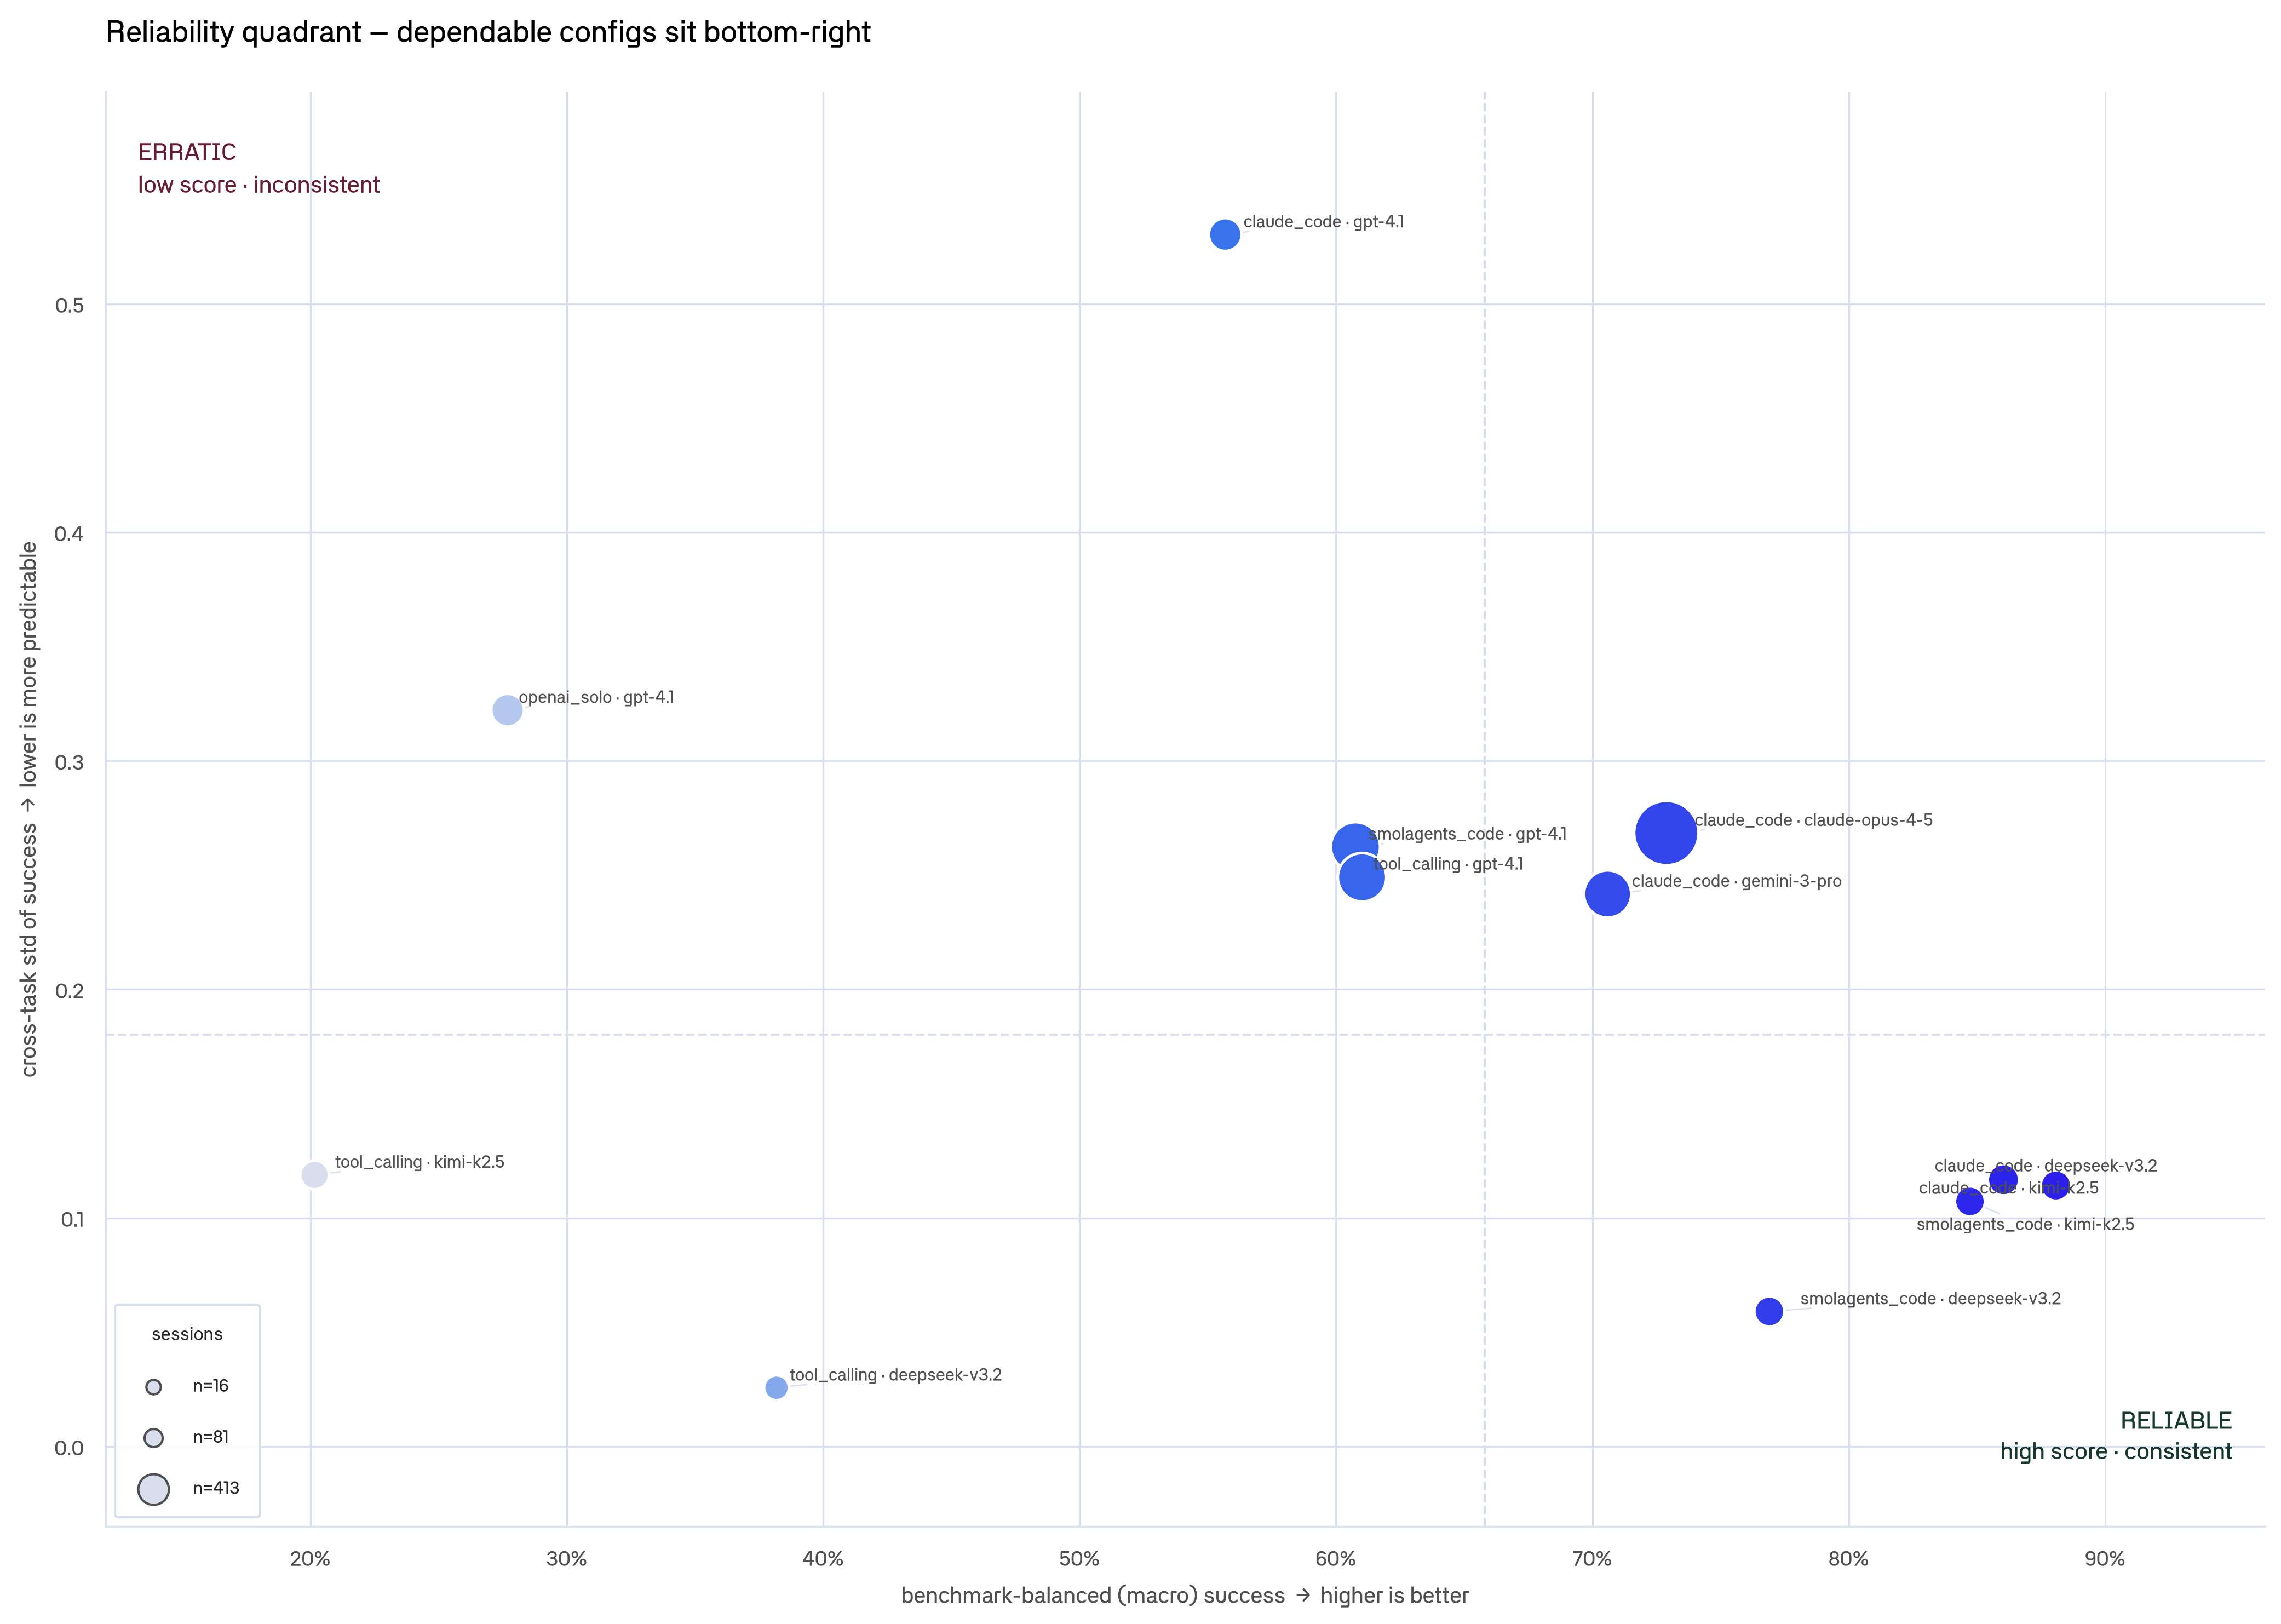
Bottom-right is dependable (high and consistent); further up is erratic. Open-weight claude_code configs (DeepSeek, Kimi) sit in the reliable corner alongside Claude Opus; the gpt-4.1 configs scatter high on the spread axis.
One caveat: the open-weight configs were only tested on two suites (AppWorld and SWE-bench), so their macro rate isn't directly comparable to full-six-suite configs. With that said, smolagents_code with DeepSeek-V3.2 and Kimi-K2.5 are both highly reliable and highly successful on those coding tasks. Among the full-six-suite configs, claude_code · claude-opus-4-5 (73%) edges out claude_code · gemini-3-pro (71%), but is slightly more erratic (cross-task std 0.27 vs 0.24).
Finding 4: there is no universal winner
Different models win different jobs:
- SWE-bench (coding): Claude, DeepSeek, Kimi
- AppWorld (multi-app orchestration): DeepSeek, Kimi
- BrowseComp+ (research/synthesis): Claude (69% success rate)
- TAU2 Airline: Gemini (100% success rate)
- TAU2 Retail: Claude (95% success rate)
- TAU2 Telecom: Claude (82% success rate)
One thing to note is that the reason DeepSeek and Kimi do better on AppWorld may be due to the harness. Closed models ran AppWorld almost entirely under tool_calling, which is the worst harness for it (the harness with the lowest success rate on AppWorld). However, same-harness, open weights still beat Claude specifically on AppWorld. Claude is weak on AppWorld, getting a 26% success rate even in its own harness.
The biggest takeaway is that there's no "best model." There's only "best for this job."
Finding 5: cost per task and cost per success are very different numbers
There are two ways to measure cost, and they tell completely different stories.
Cost per task is the average spend per attempt — including failed runs. Cost per success is what you actually pay to get a task completed, accounting for the fact that failed attempts cost money too. cost per success = cost per task ÷ success rate. A config that succeeds 1-in-6 pays for roughly 6 attempts per win.
We priced each run using LiteLLM's per-token rates, blended by each model's measured output share (agents are input-bound; output is only ~1–11% of billed tokens). So these dollar figures are real, not estimates.
First, the quality vs cost frontier: every config placed by benchmark-balanced success against average cost per task:
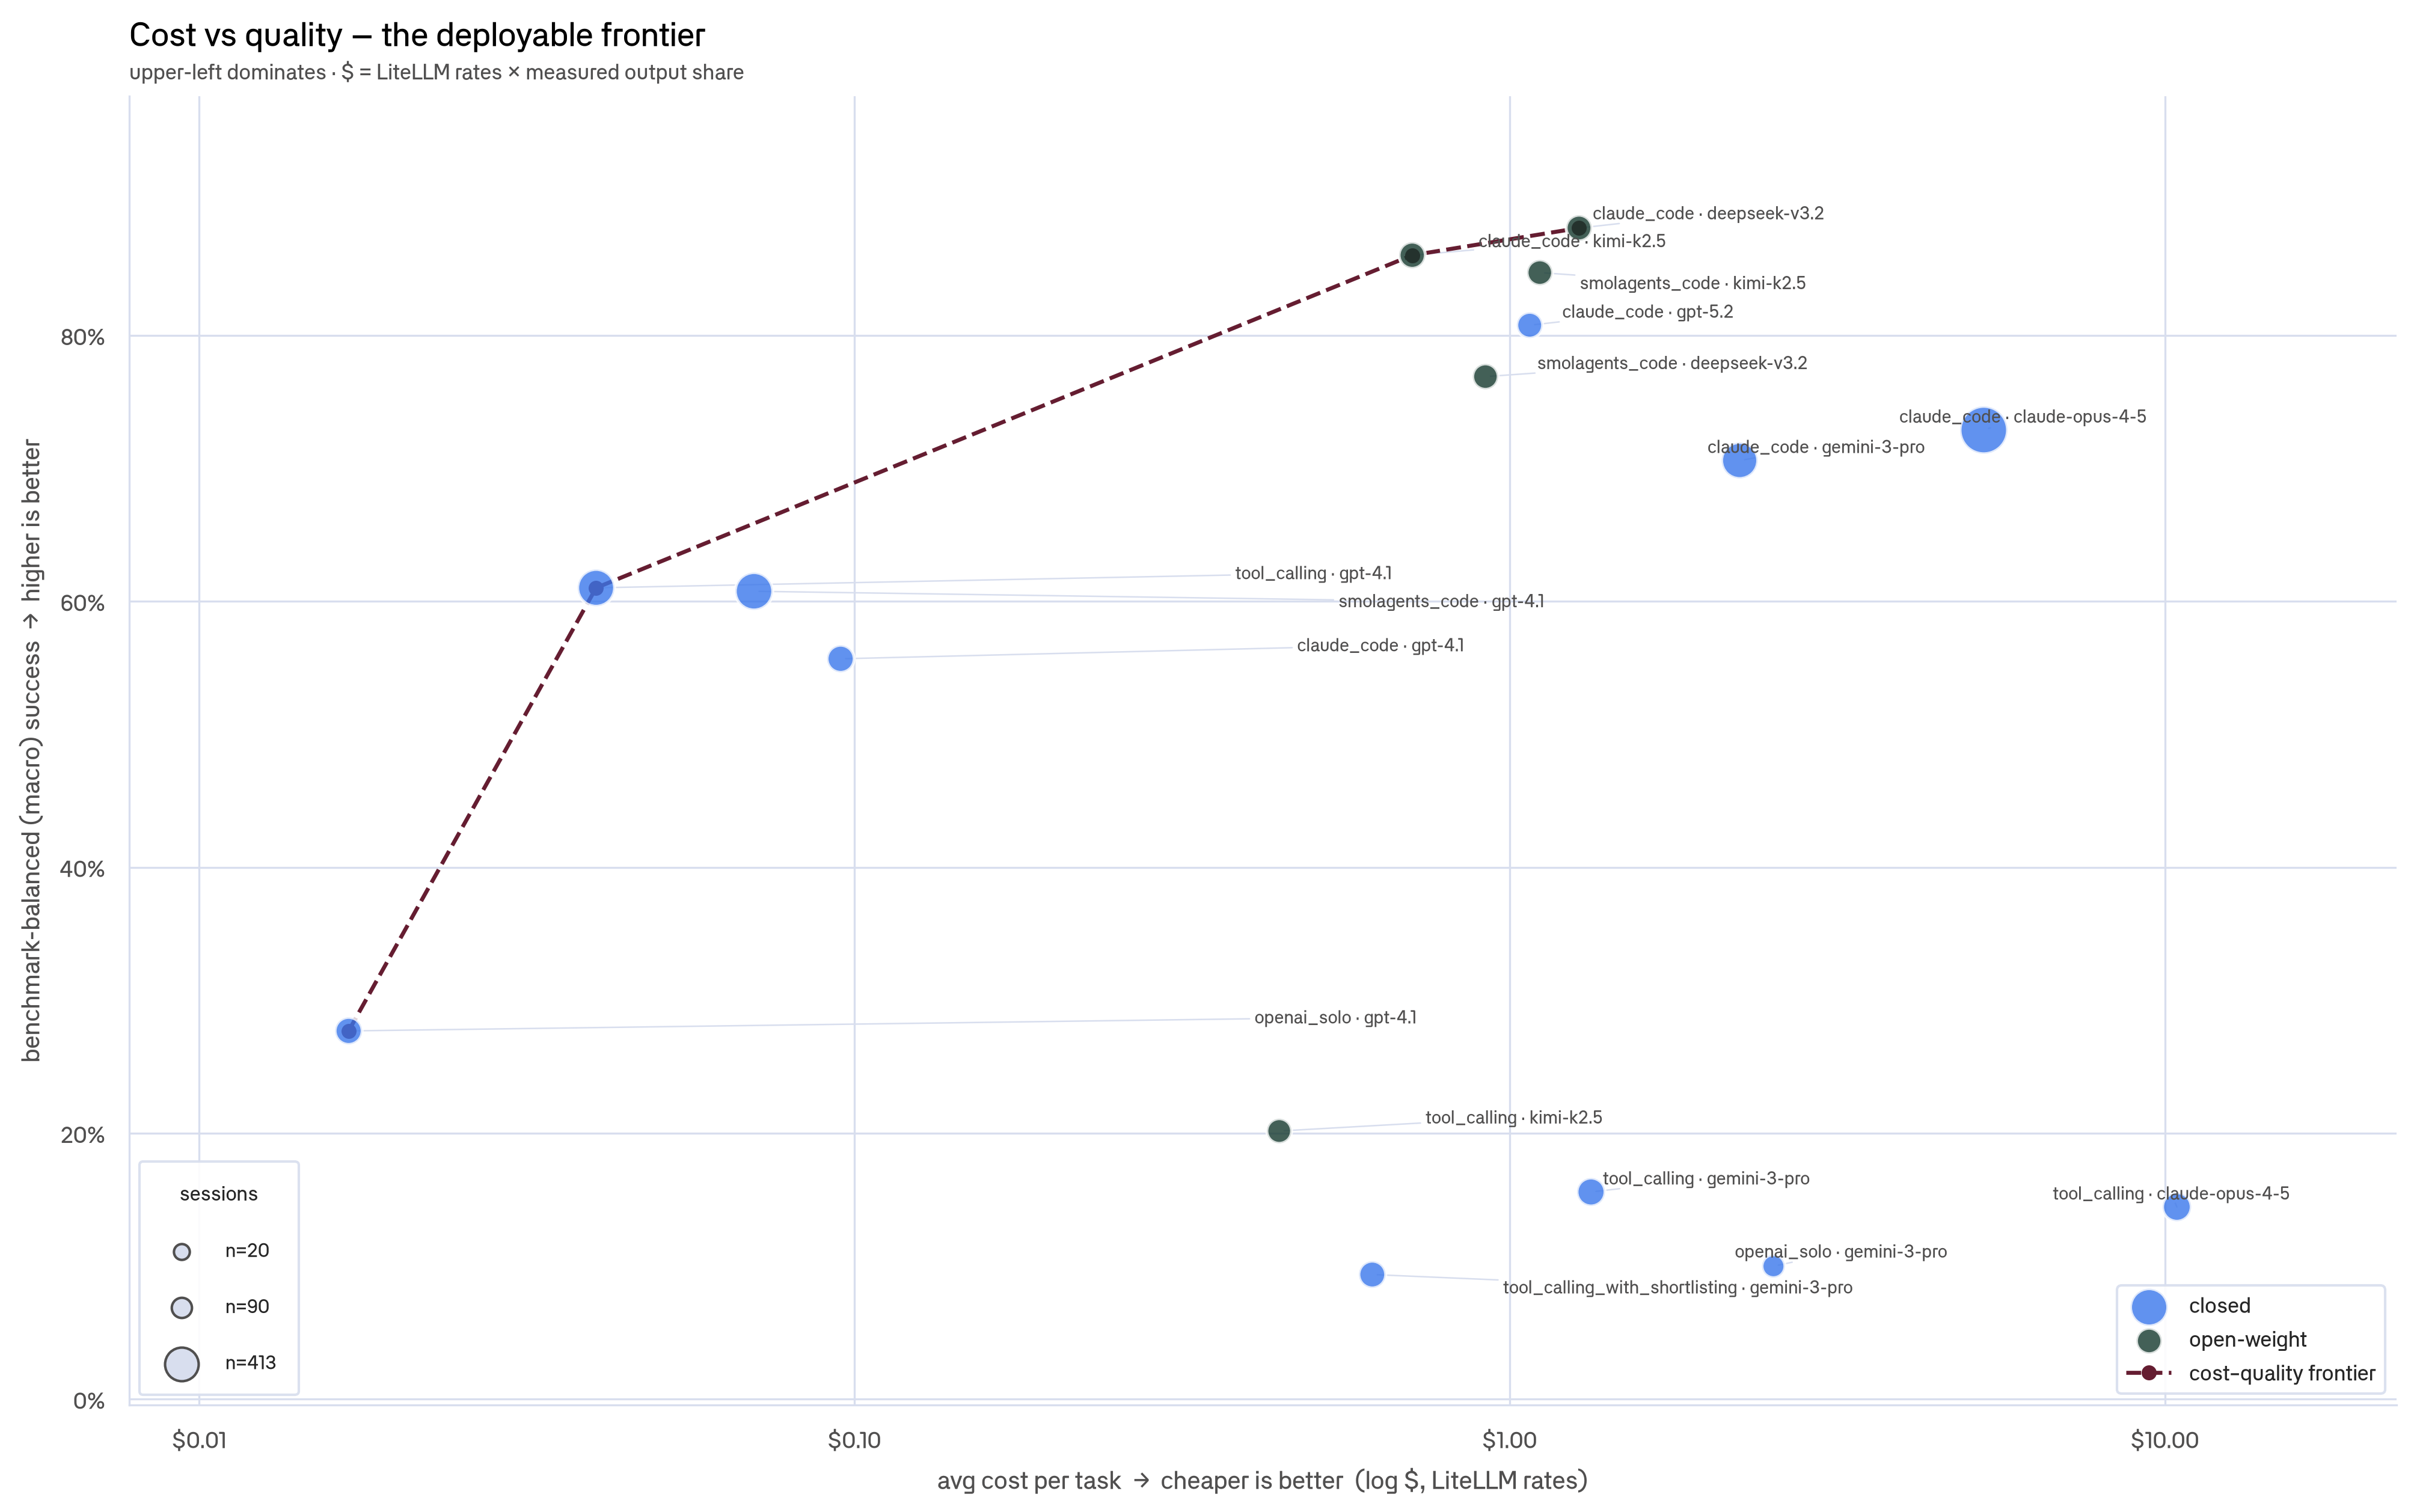
Upper-left dominates. Open-weight claude_code configs (DeepSeek, Kimi) sit on the frontier and push the closed configs off it. Token cost is partly benchmark-driven, so configs that ran token-heavy coding suites sit further right partly because of what they ran.
Now cost per successful task, where "cheap" stops being cheap:
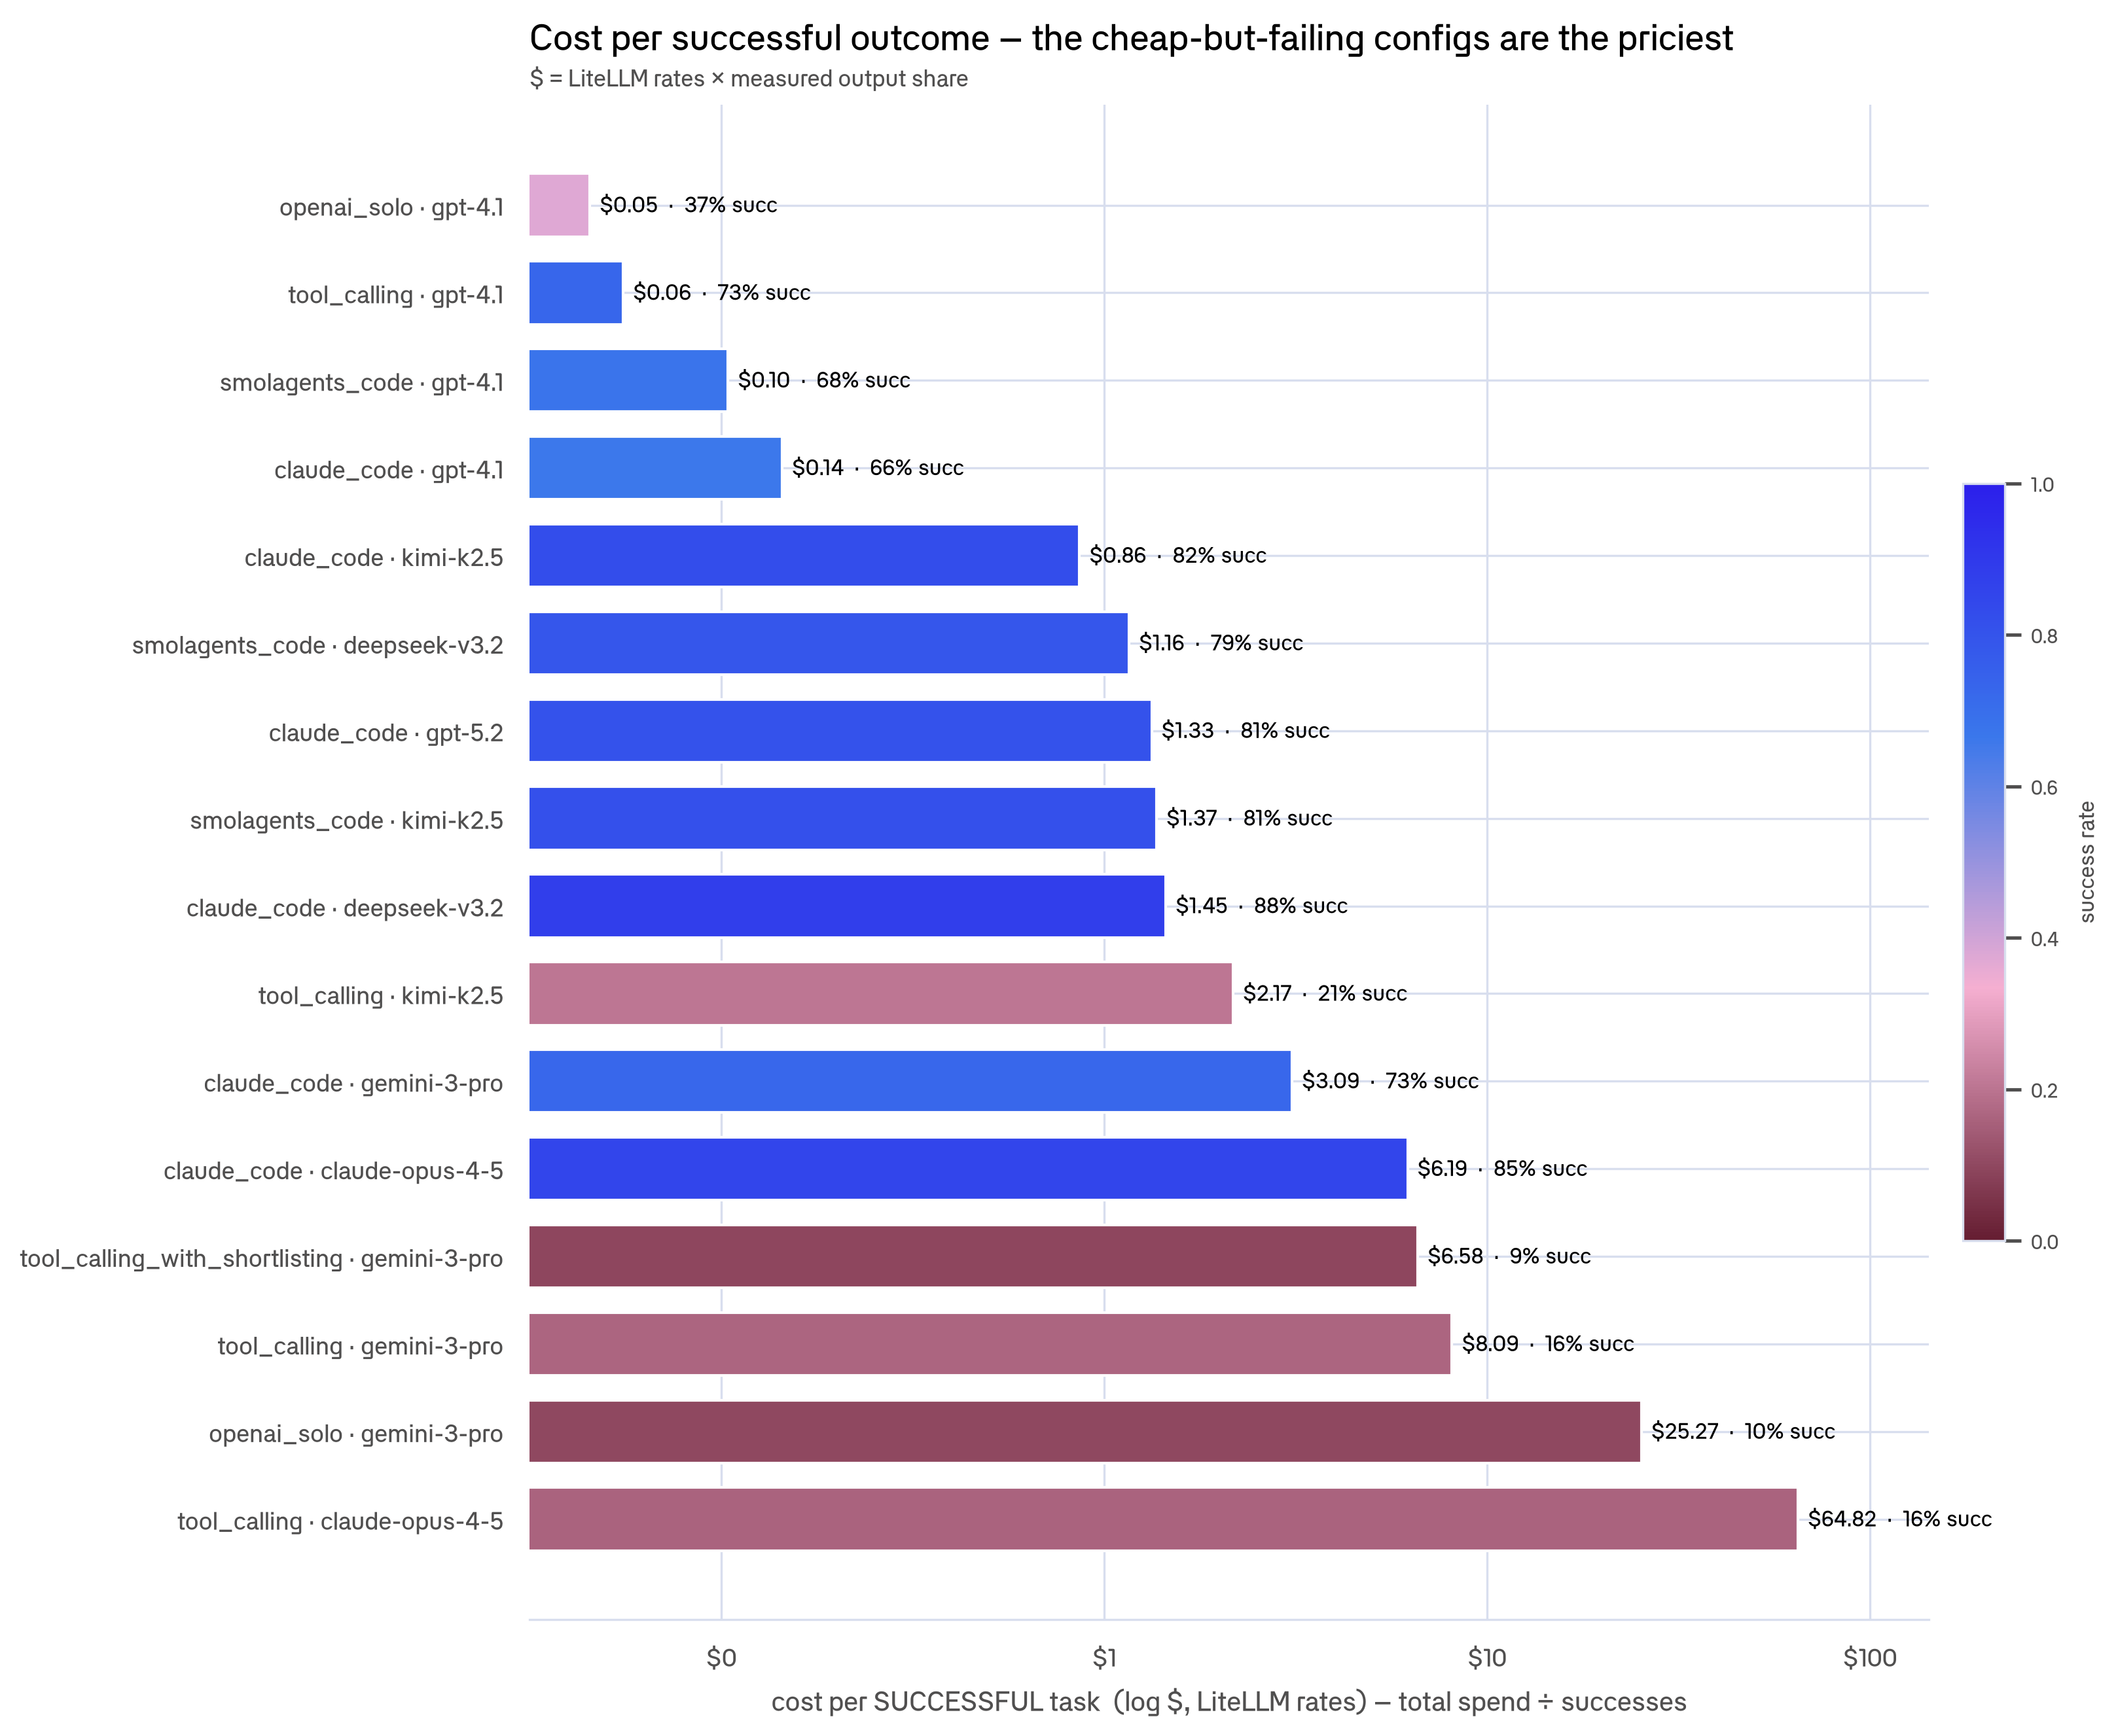
tool_calling x claude-opus-4-5 costs $64.82 per success (16% success rate). openai_solo x gemini-3-pro costs $25.27. Compare that to open-weight claude_code configs at $0.86 (Kimi) to $1.45 (DeepSeek) per success at 82–88% success, which beats closed claude_code x claude-opus at $6.19.
The answer to "which model is cheapest" depends entirely on whether you're asking about cost per task or cost per success. They rank configs in completely different orders.
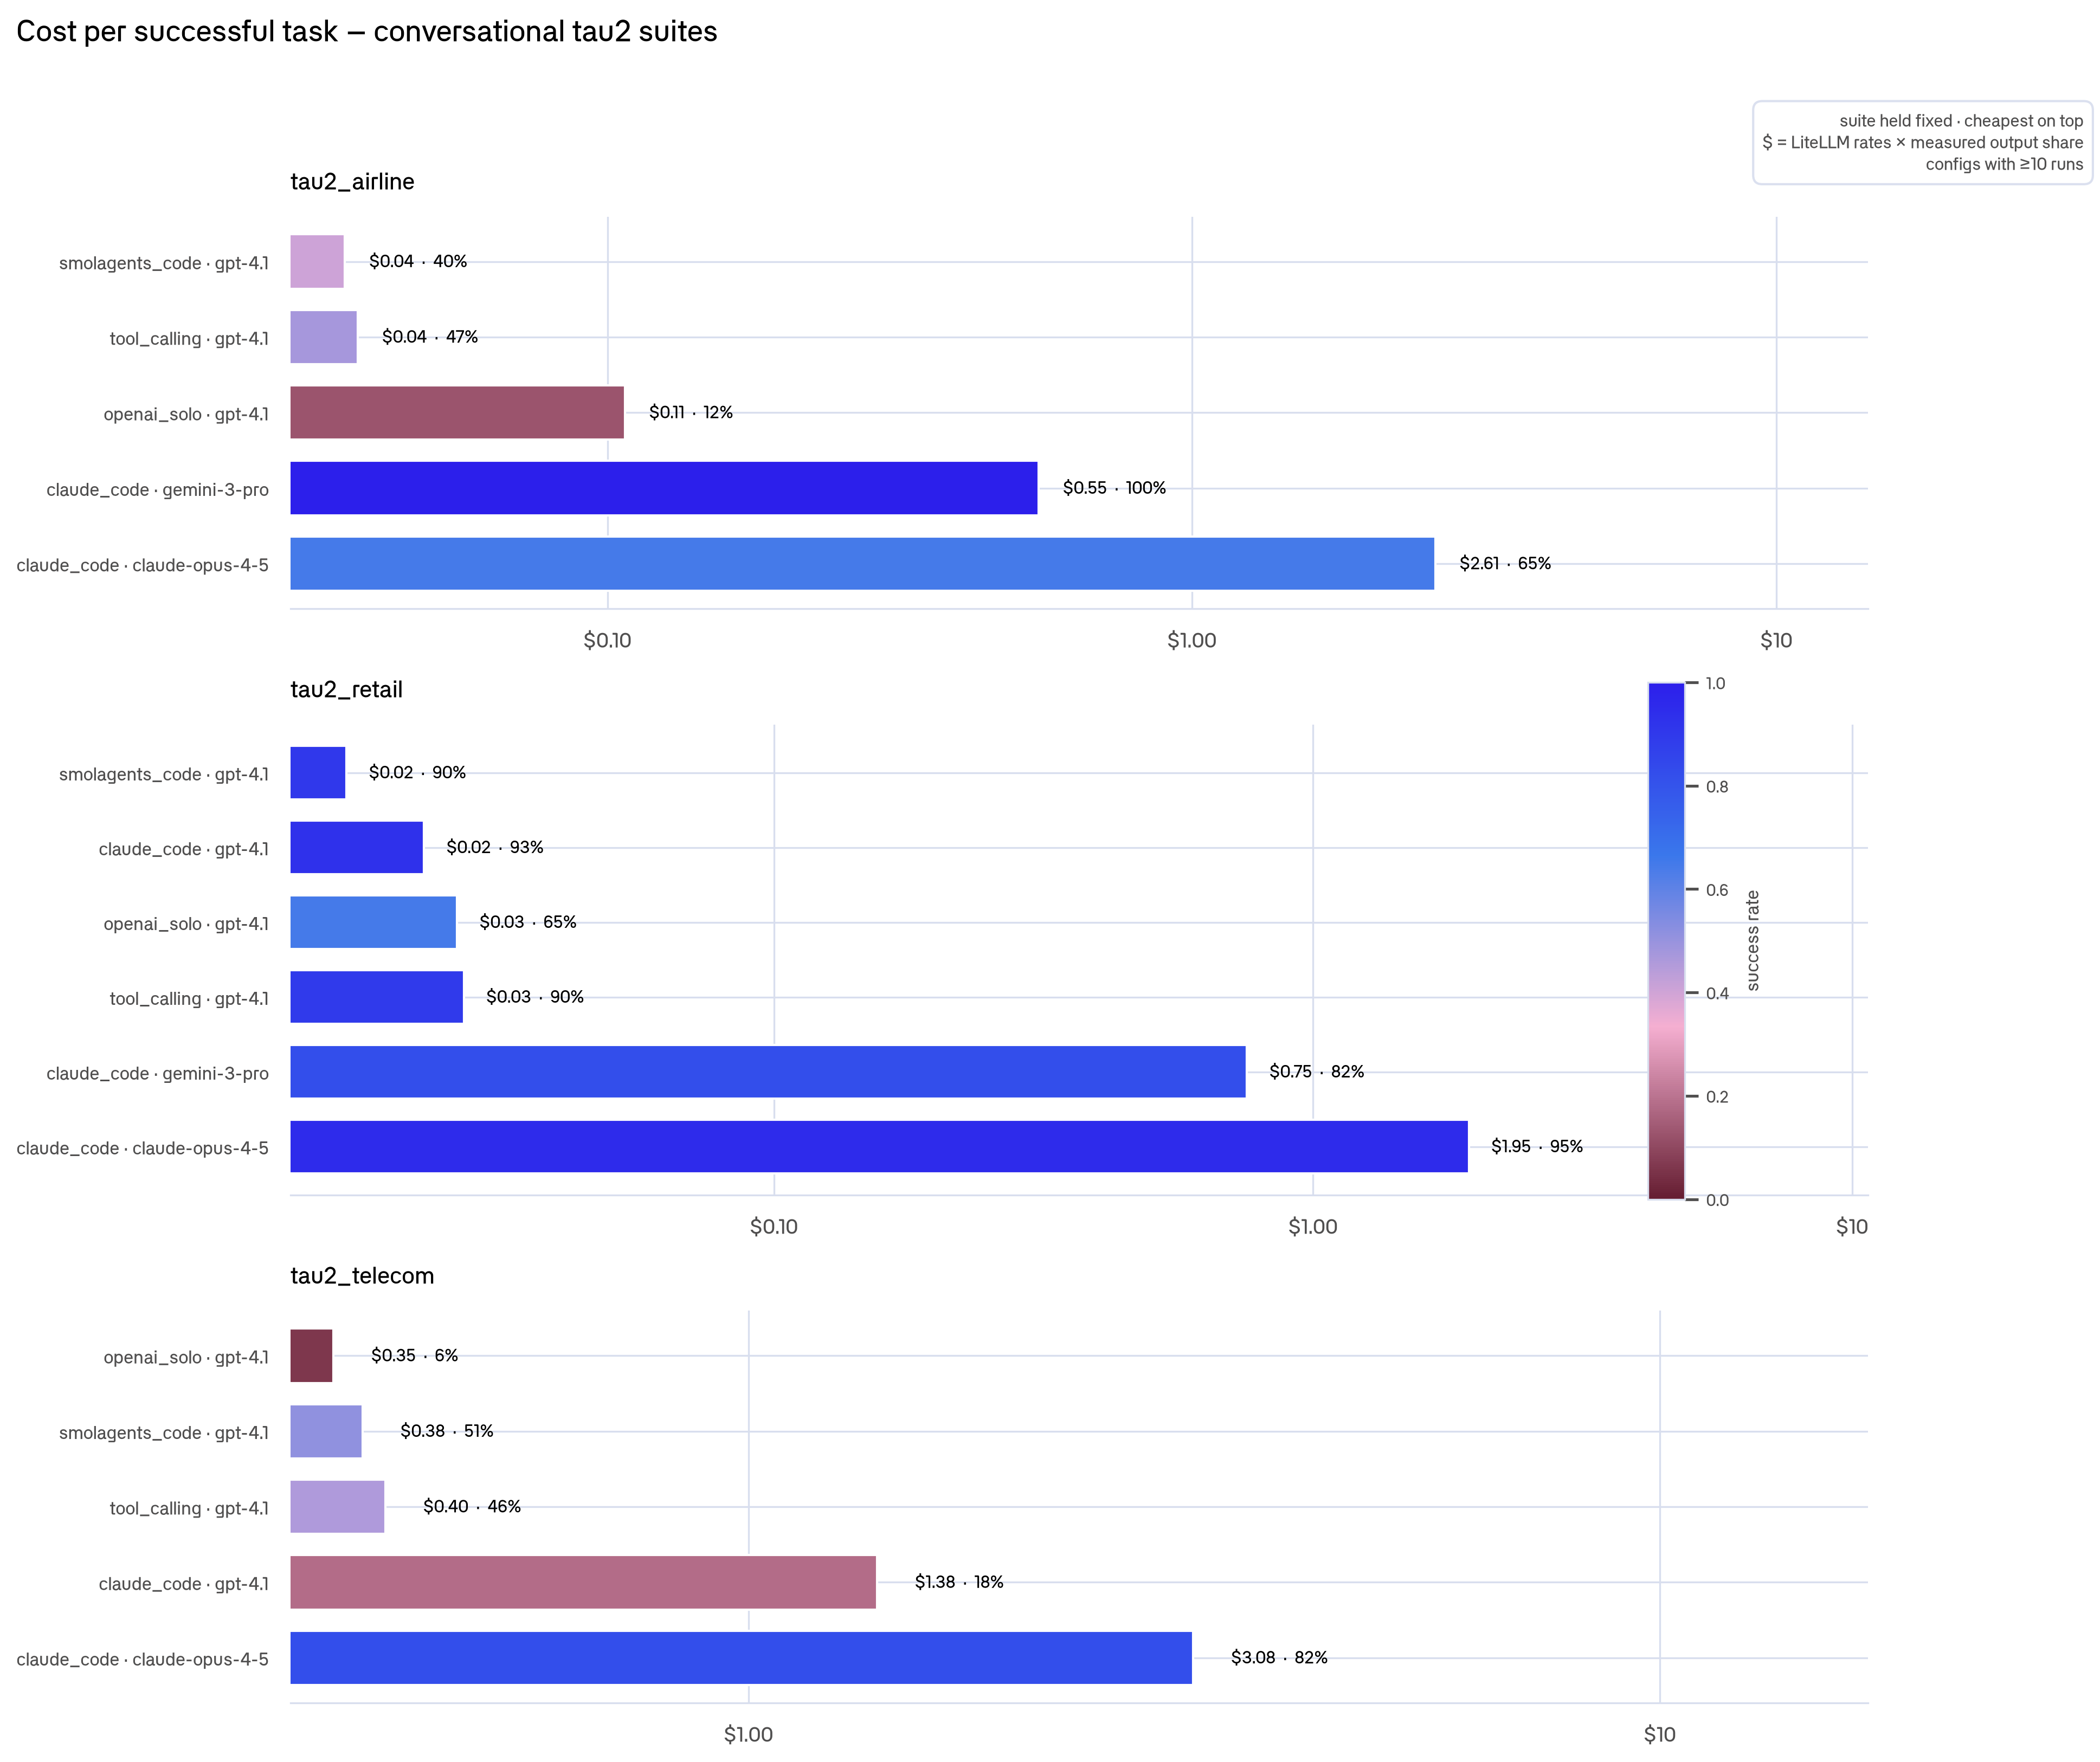
Per-benchmark cost per success is the apples-to-apples view. It splits cleanly by task family:
On coding and agentic suites, open-weight wins. On SWE-bench, claude_code · Kimi-K2.5 costs $0.73/success (94%) and · DeepSeek-V3.2 $1.27 (96%), versus closed · claude-opus at $4.28 (100%) and · gemini-3-pro at $4.97 (87%). On AppWorld the gap is larger: smolagents_code · Kimi-K2.5 costs $0.40/success (92%) versus claude_code · claude-opus at $84.33 (26%).
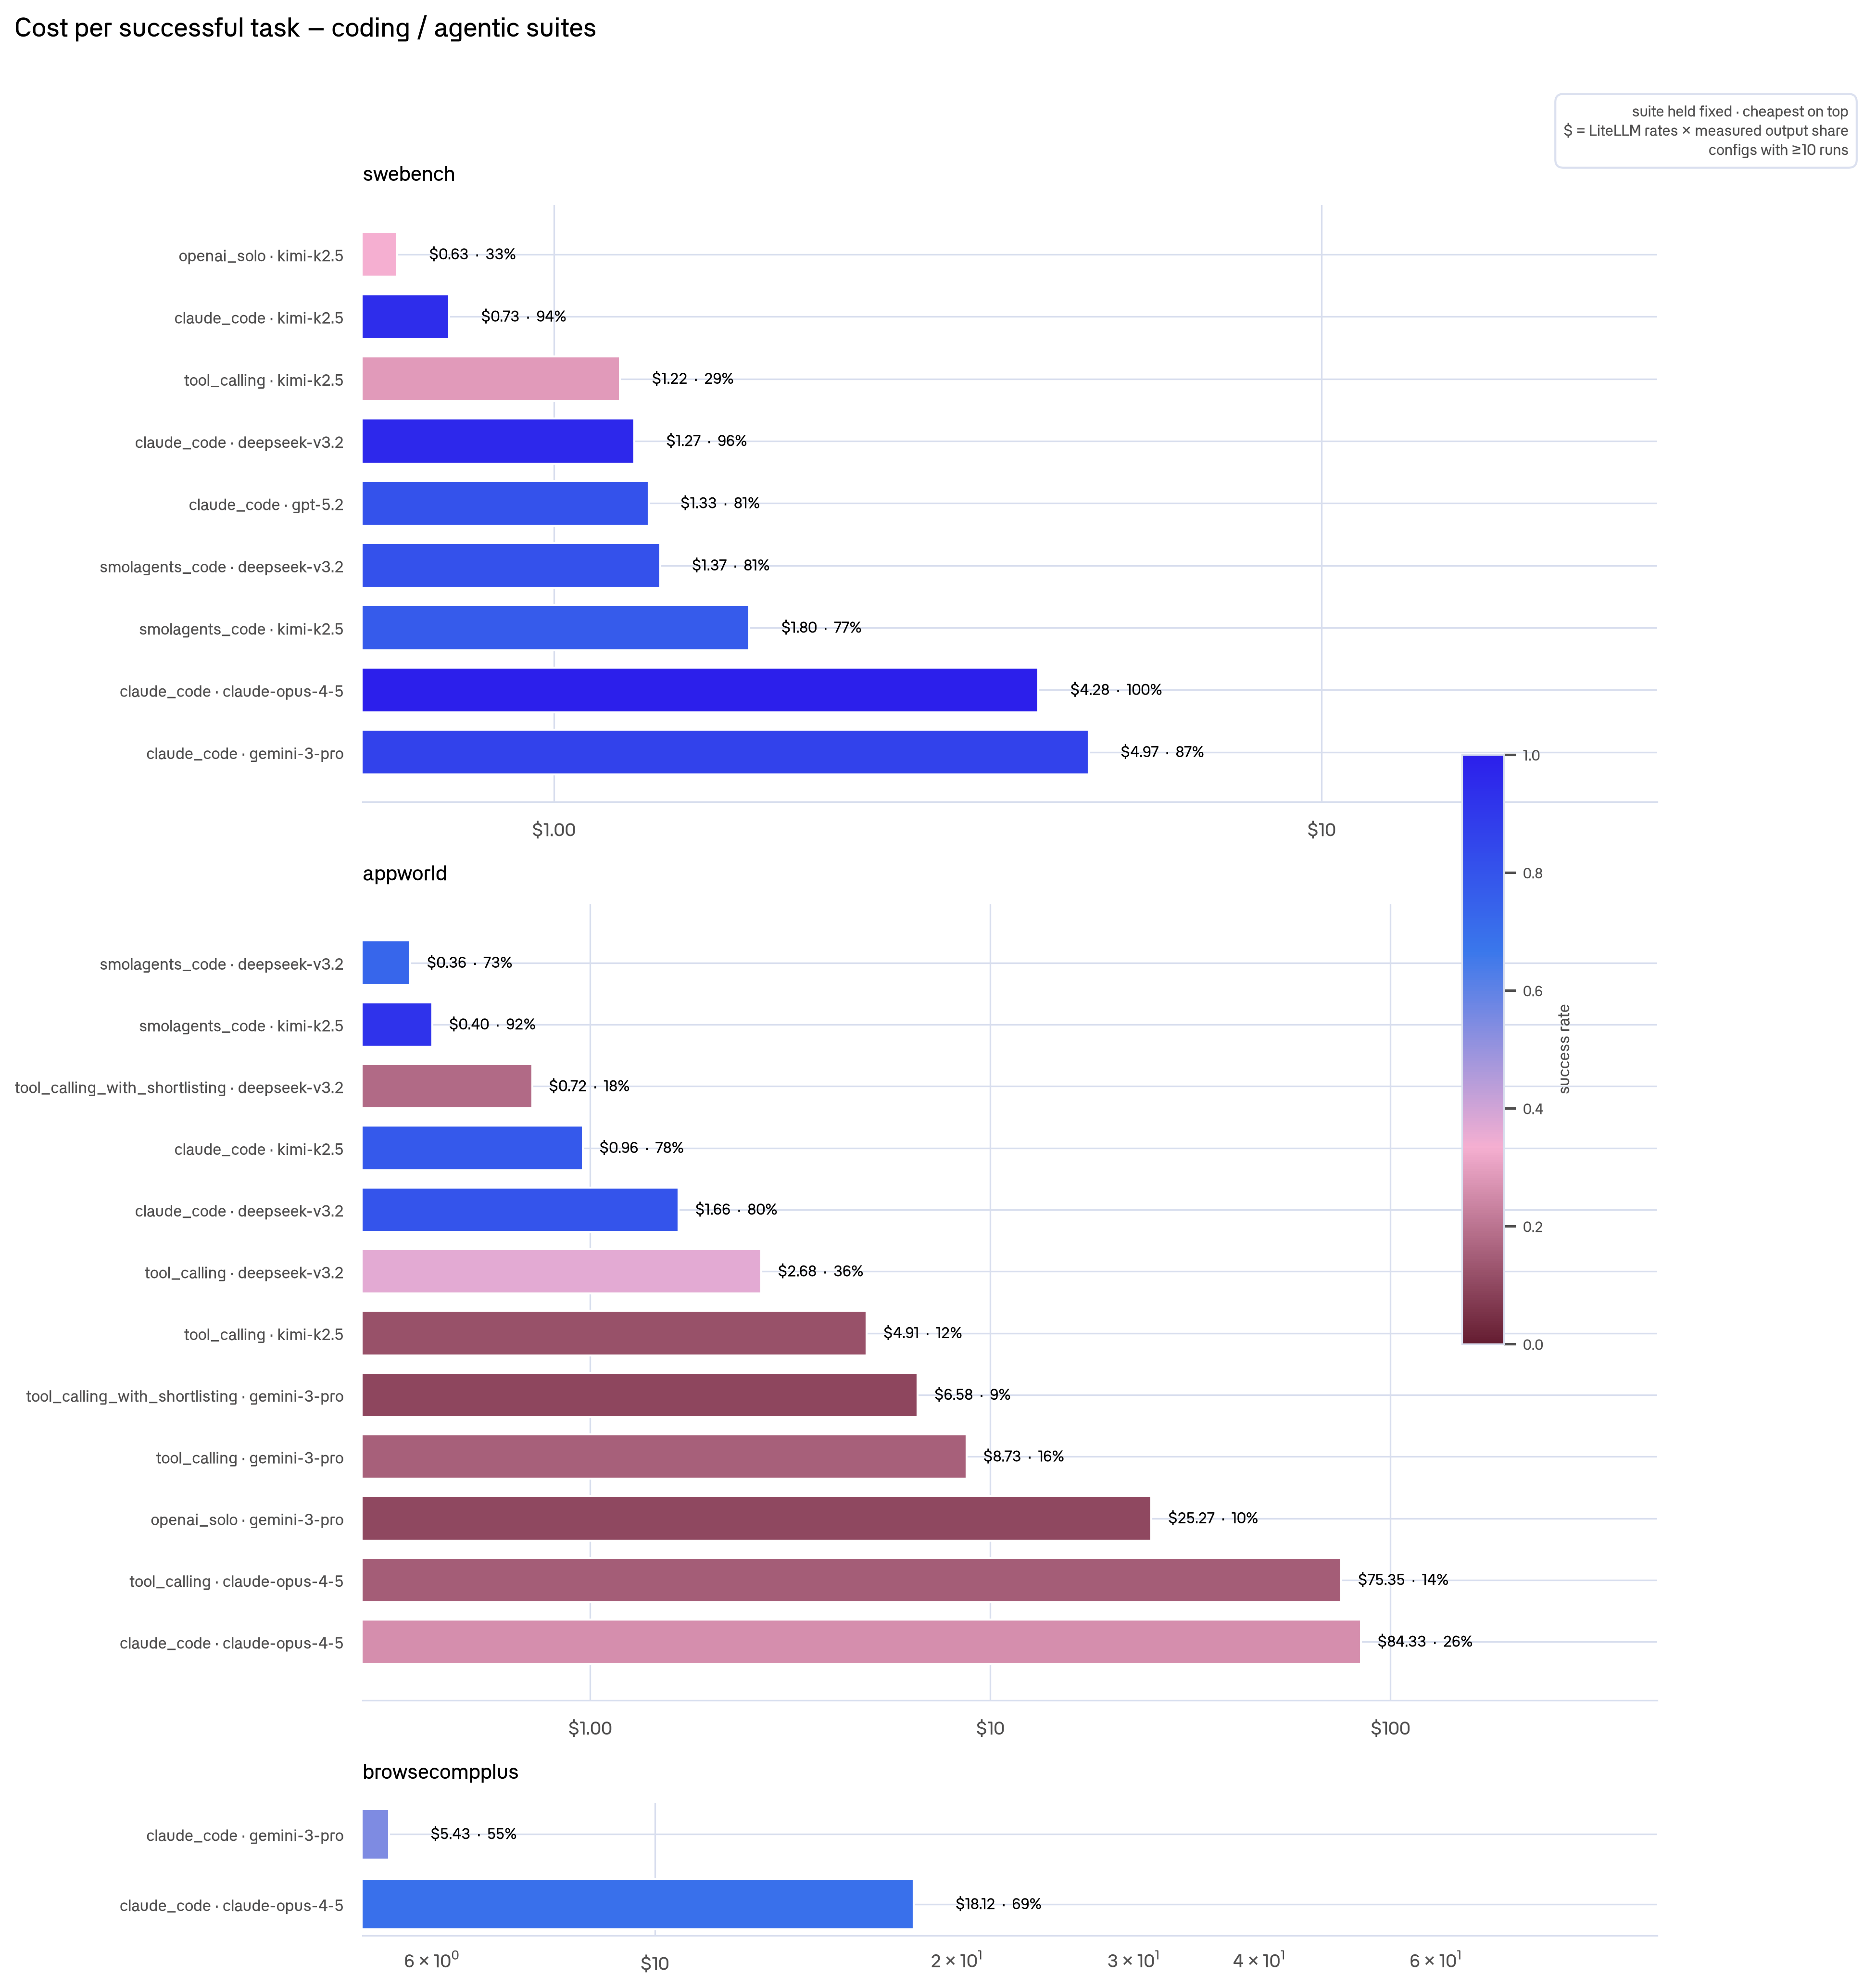
On conversational TAU2 suites, the story flips. Open-weight models never ran these, and cheap closed models win: on TAU2 Retail, gpt-4.1 configs hit $0.02–0.03/success at 90%+, versus claude_code · claude-opus at $1.95 (95%).
The practical takeaway: pick the cheapest config that clears your quality bar, but that config is different per task family. Open-weight for coding, gpt-4.1 for conversational support.
Finding 6: "efficient" can mean "gave up"
gpt-4.1 looked 10–100× cheaper on tokens than other models. But when we dug into the traces, we found that on hard tasks, it was cheap because it failed early, not because it was smarter. It failed 53–90% of the time on SWE-bench and AppWorld while spending almost nothing.
Cost without success is meaningless. The relevant metric is cost per successful outcome, which completely reorders the rankings. On SWE-bench, Claude and DeepSeek both hit ~100/96%, but Claude does it at 0.82M tokens and 213 seconds, while DeepSeek burns 2.07M tokens and 1,220 seconds (20 minutes) for the same outcome.
Finding 7: failure patterns are opposite on coding vs. conversational tasks
On hard coding and agentic tasks (SWE-bench, AppWorld, BrowseComp), failure means thrashing. Failed runs make more calls, burn more tokens, and run longer than successful ones. BrowseComp failures use 2.3× the tokens of successes.
On conversational TAU2 tasks, failure means giving up. Failed runs make fewer calls, burn fewer tokens, and finish faster.
The pooled view makes the thrashing pattern visible first. claude_code failures have a huge spread: the median failed run burns ~0.8M tokens and the tail stretches past 3.7M. smolagents_code failures stay lean.
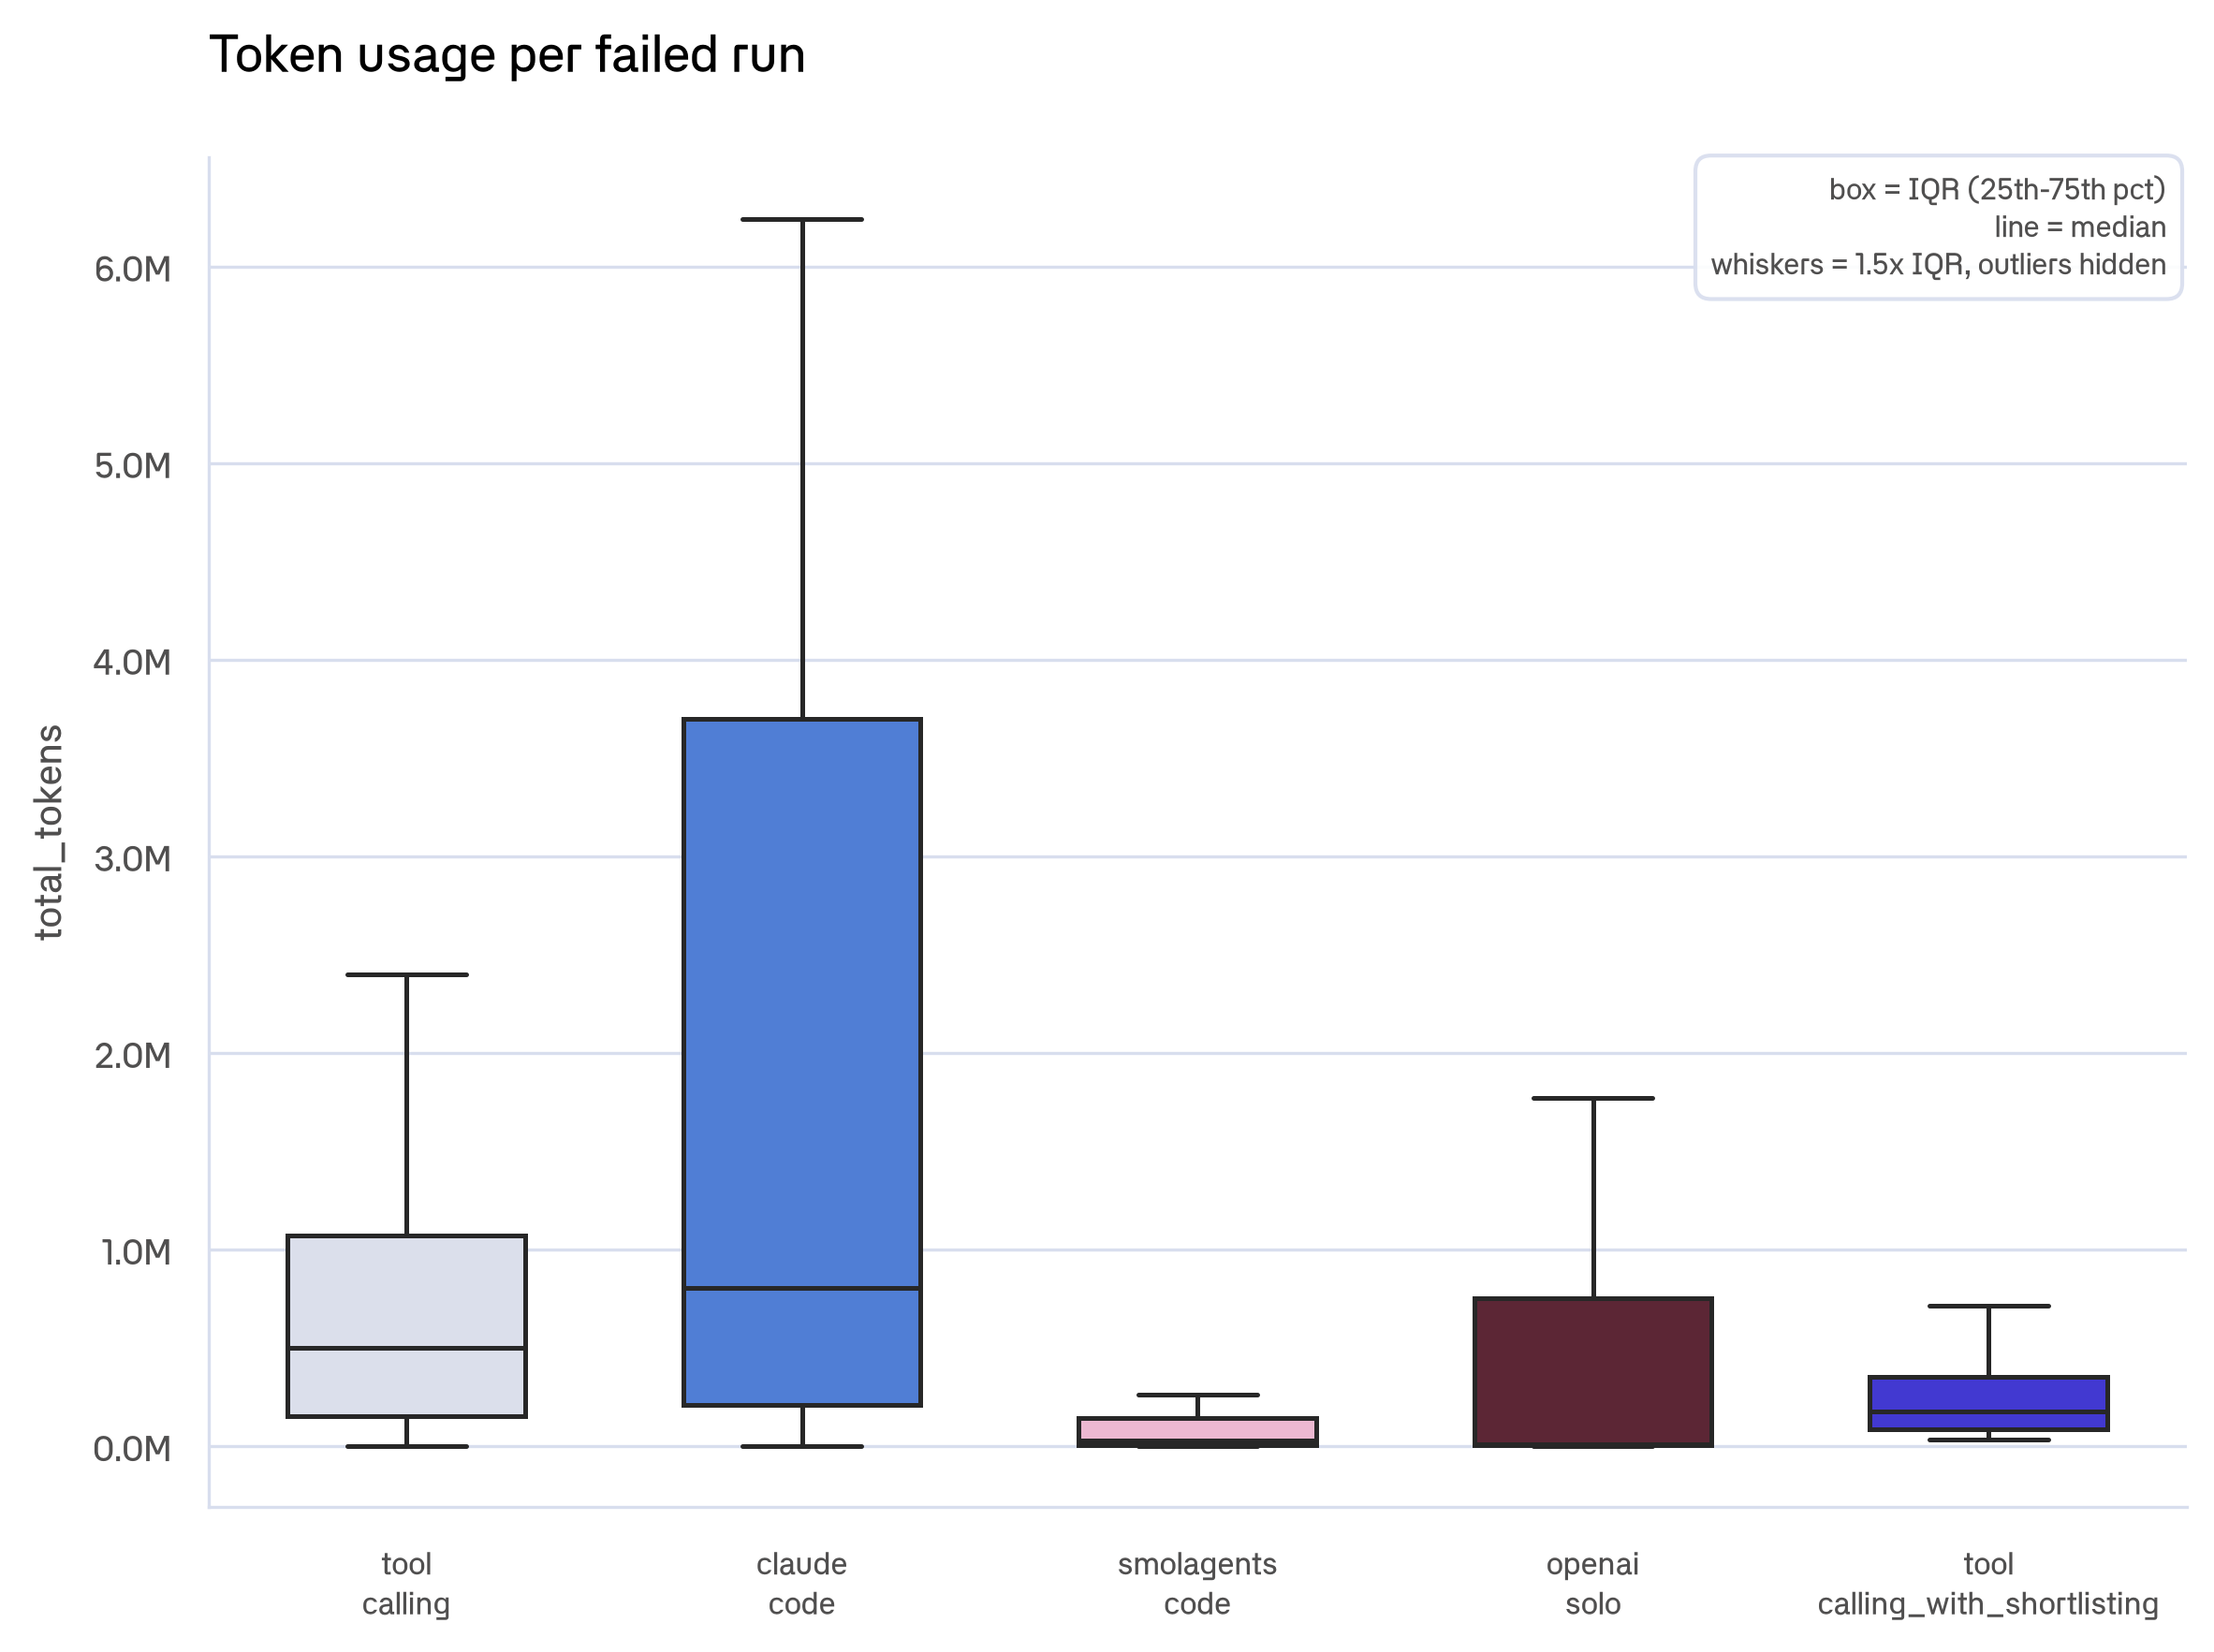
Token usage per failed run: claude_code failures have a huge upper tail from thrashing, while others stay lean. This is pooled across suites, so part of claude_code's tail reflects that it ran the token-heavy coding and browse suites.
But token usage is dominated by the benchmark: a SWE-bench run dwarfs a TAU2 one, so the pooled view partly ranks harnesses by which suites they ran. The per-benchmark view below isolates each harness's own burn profile, and the thrash/give-up split holds up.
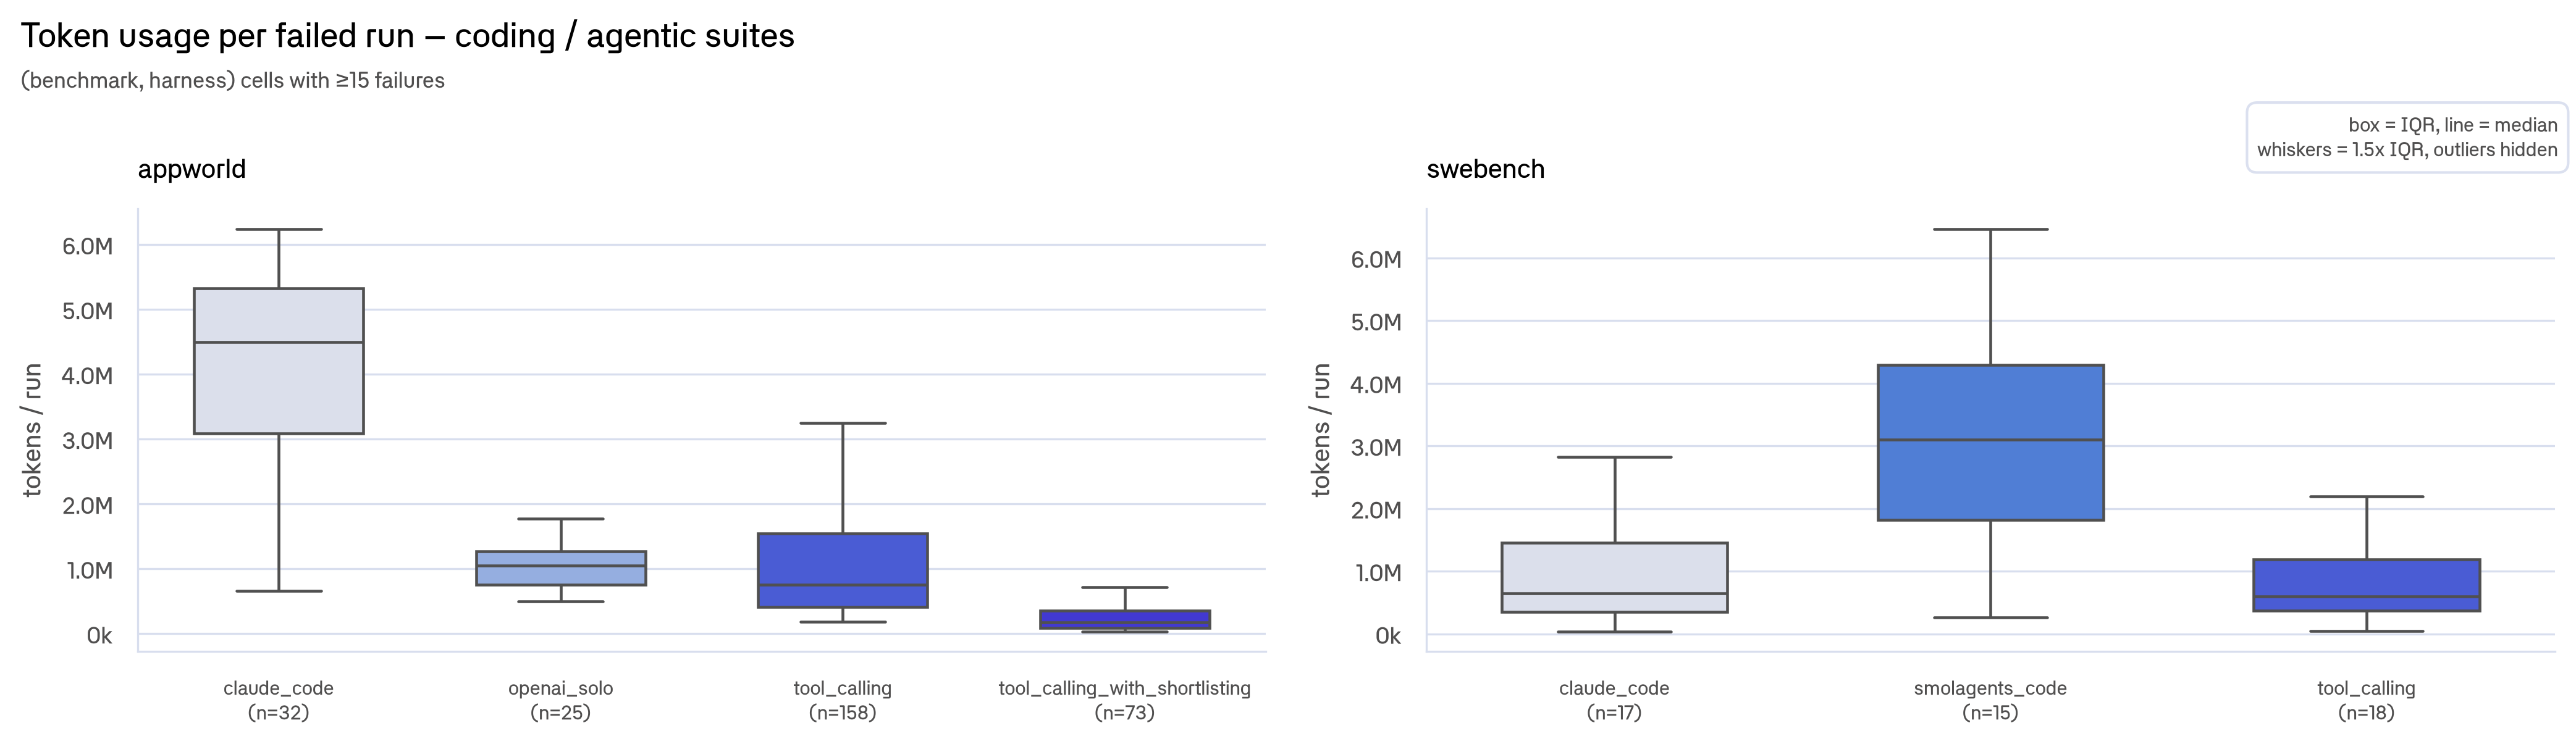
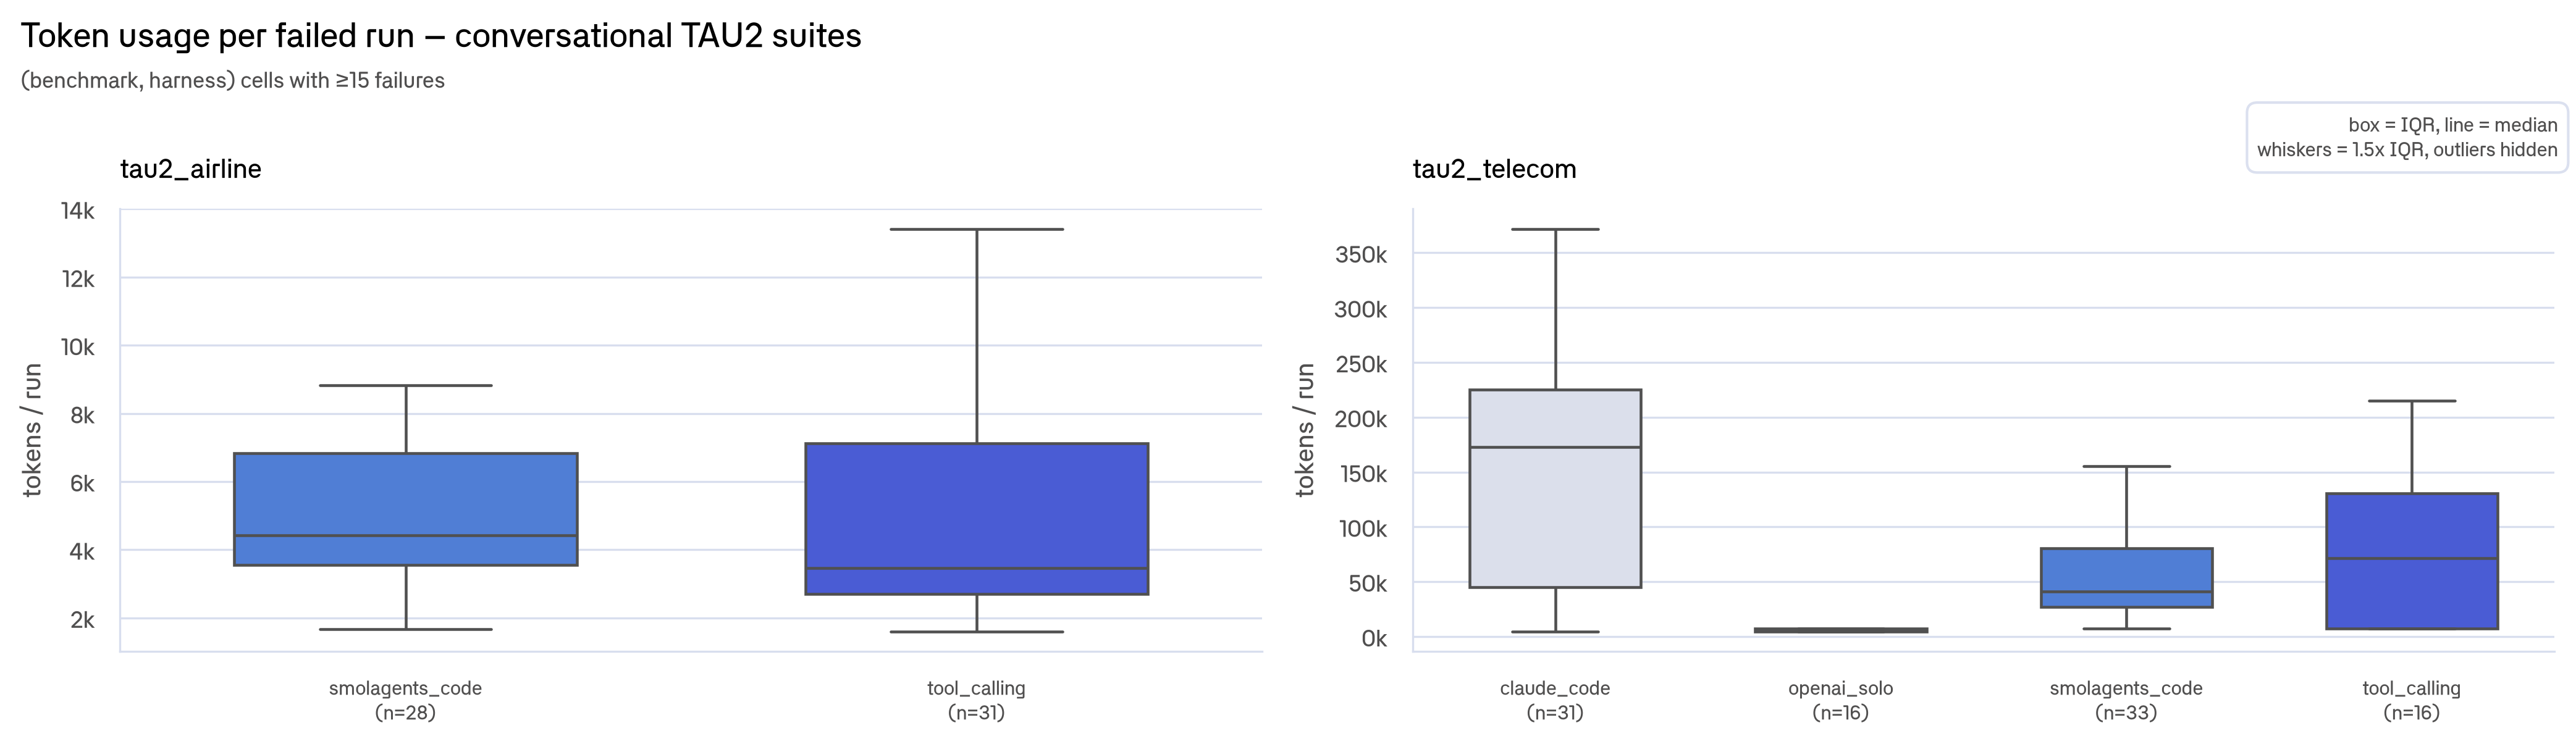
Each panel fixes the benchmark; token scales differ because coding and conversational tasks have fundamentally different token needs. Coding suites (M-scale) and conversational suites (k-scale) show opposite patterns: failure means thrashing in one and giving up in the other.
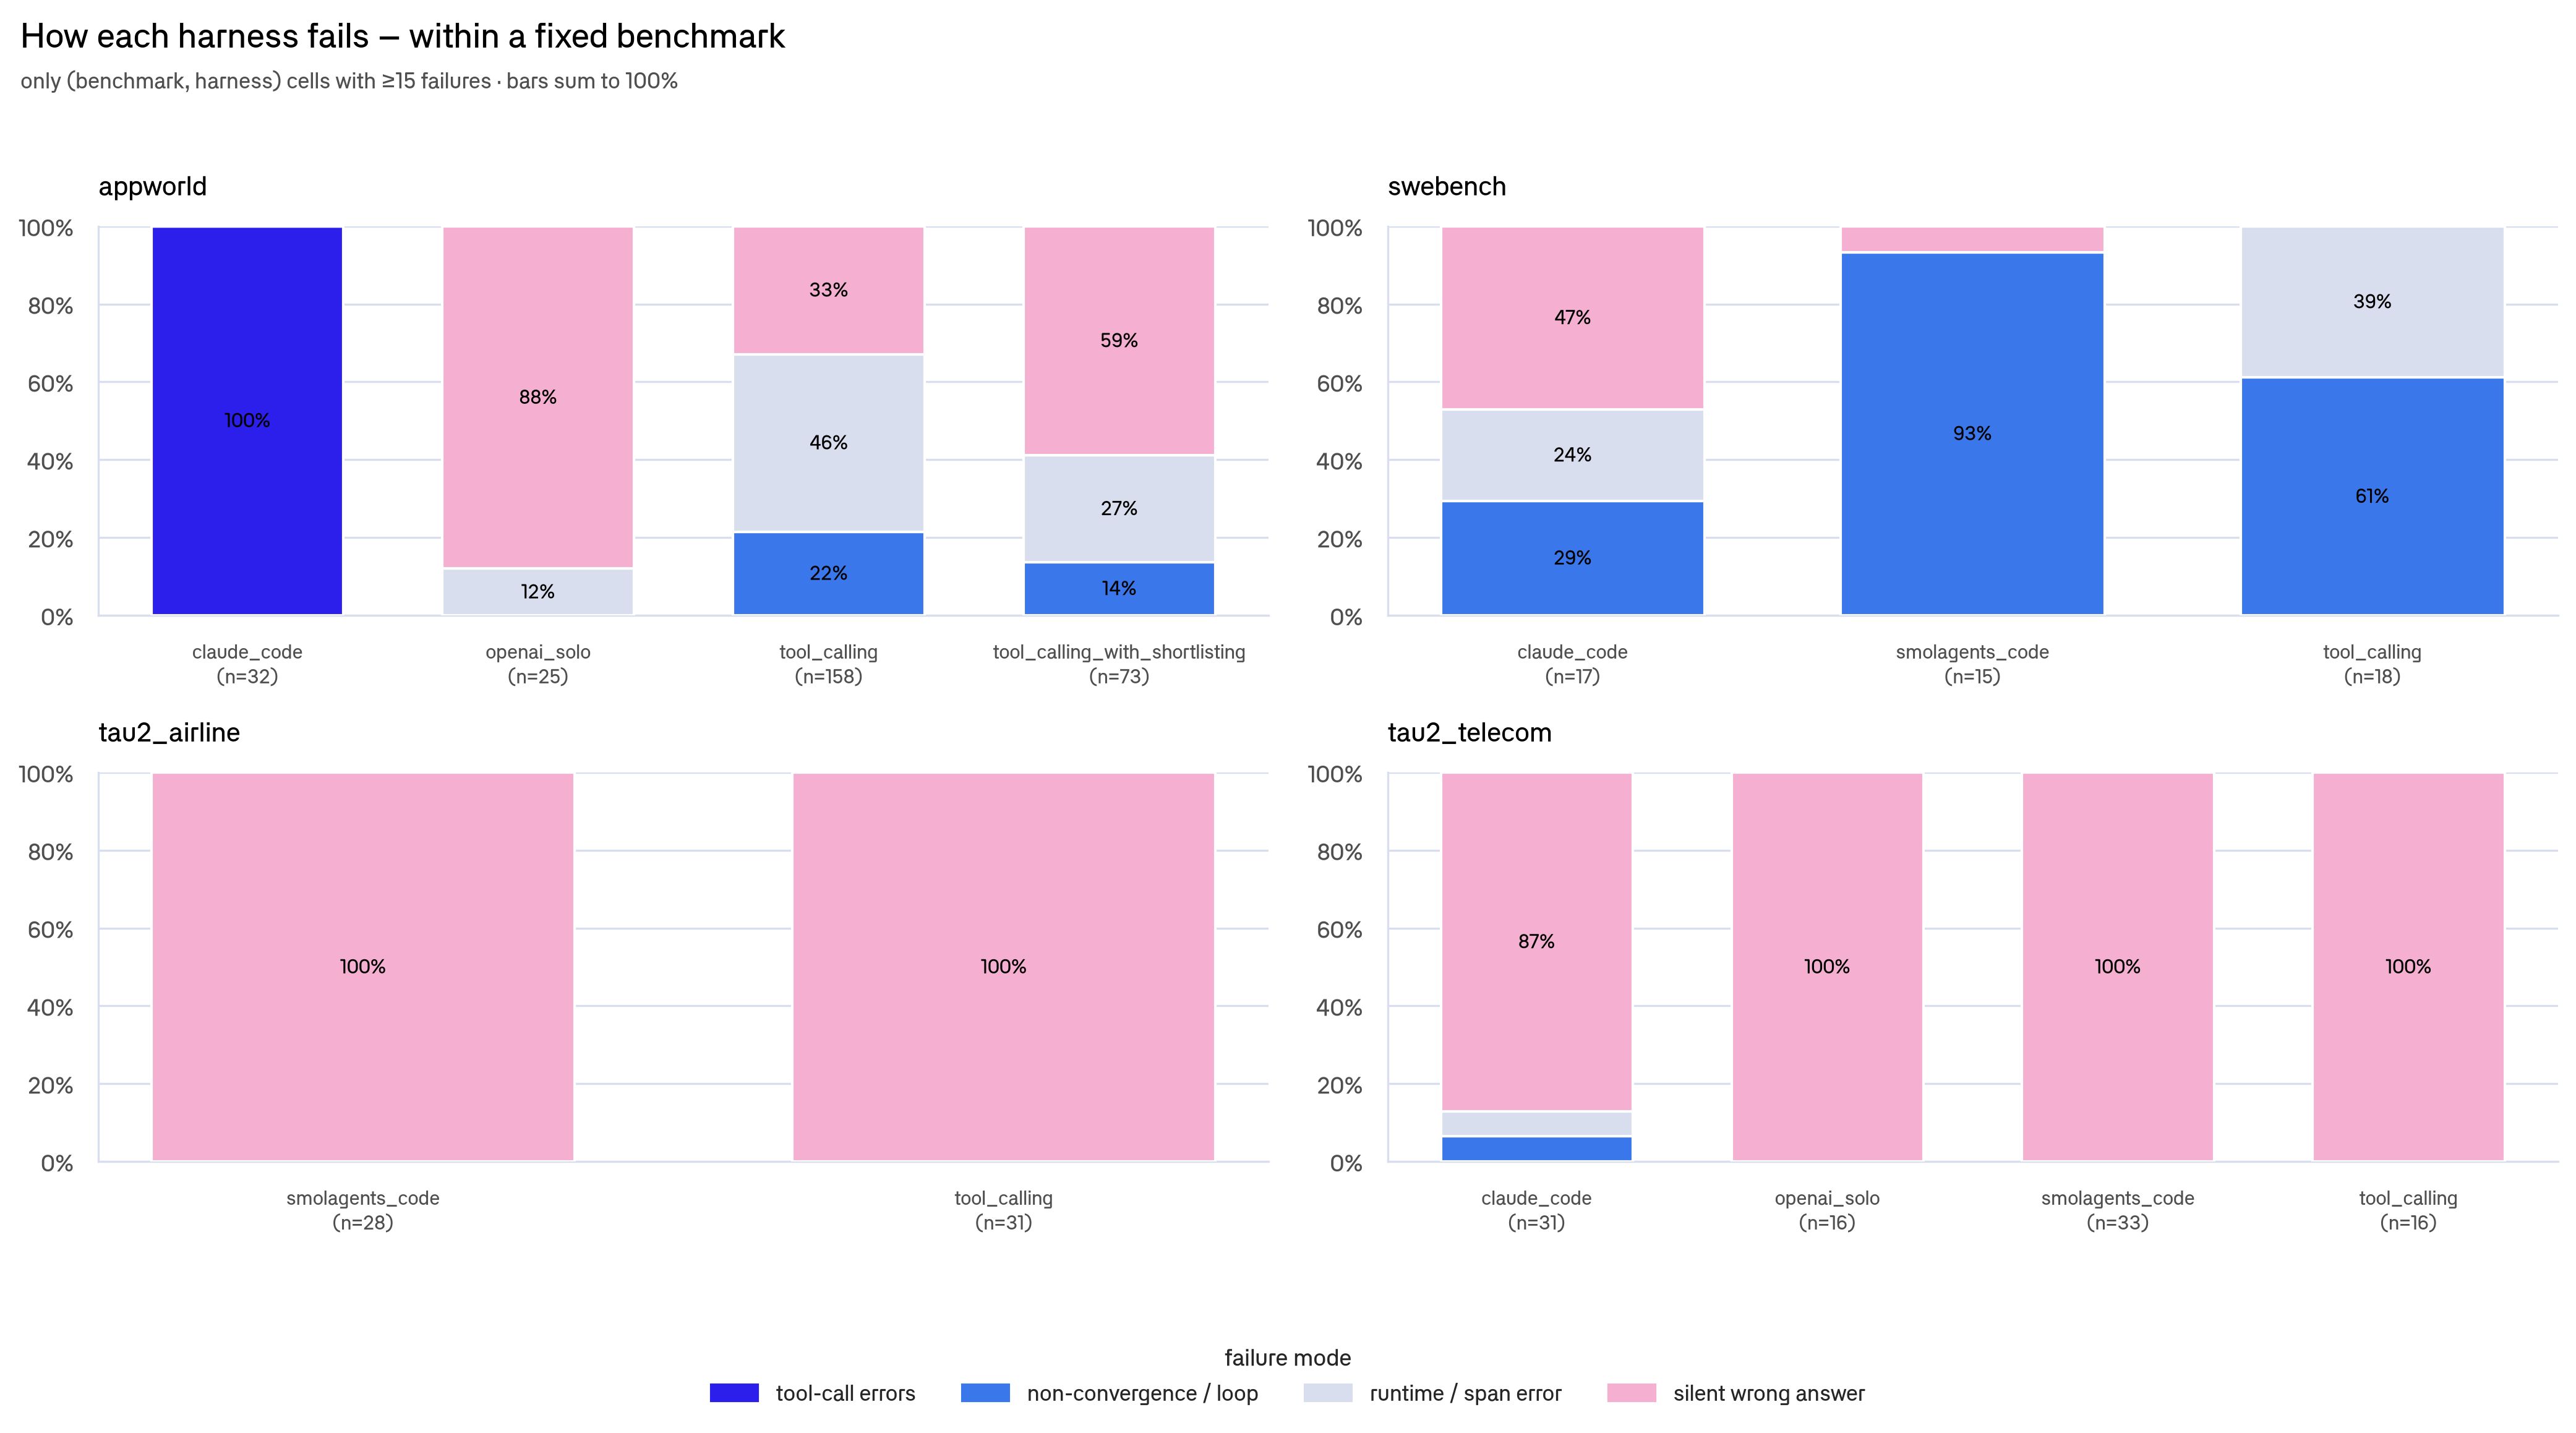
The kind of failure differs too. TAU2 failures are almost entirely silent wrong answers, where the agent confidently finishes the wrong thing. Coding failures skew toward non-convergence, loops, and runtime errors.
There's a pretty useful ops implication here. An "abnormal token usage" guardrail needs opposite thresholds per task type. Cap the thrashers on coding tasks. Flag suspiciously cheap or short runs on conversational tasks. Ironically, a single "cap tokens at 2M" rule would help one category and break the other.
Caveats
A few things to hold in mind when reading these results:
The success scores are estimates, not ground truth. The judge is strongest on SWE-bench because it can see the actual code diff and test results. AppWorld and TAU2 are medium reliability, since the judge sees the agent's tool calls and self-reported confirmation, but can't verify the actual database state or hidden rubric. BrowseComp+ is the weakest because there's no gold answer, so the judge has to infer correctness from the quality of the agent's reasoning.
Most clean comparisons run through claude_code. It's the most widely used harness across models and benchmarks, so most findings are implicitly about how models perform inside claude_code specifically, not across all harnesses equally.
Models ran different specific task instances. Within the same (benchmark × harness) cell, different models didn't necessarily tackle the same individual tasks. So if Claude hits 95% and Gemini hits 82% on TAU2 Retail, some of that gap might just be that Claude happened to get easier tasks. Small differences shouldn't be over-interpreted.
Several cells are only 10–15 runs. We set a minimum of 10 runs per cell to include it in the analysis, but 10–15 runs is still a small sample. The results in those cells point in a direction but shouldn't be treated as definitive.
Claude's 100% on SWE-bench is suspiciously perfect. Claude writes very detailed self-verification, meaning it explains every step it took and explicitly confirms its own solution. The judge may be reading that thoroughness as evidence of success even when the underlying fix is incomplete. We would suggest treating the 100% success rate as an upper bound, not a hard fact.
SWE-bench scores may partly reflect memorization. SWE-bench tasks are based on real GitHub issues, and their solutions are publicly available. Models trained on public GitHub data may have seen the answers during training. Both models that ran SWE-bench scored much higher on it than on BrowseComp+ (which uses a curated corpus less likely to appear in training data).
A large gap between SWE-bench and BrowseComp+ scores suggests the SWE-bench results may be inflated by training-data leakage. Treat SWE-bench numbers as an upper bound.
What Braintrust made possible
The raw Hugging Face dataset lets you see what happened in each trace. Braintrust made it queryable, scoreable, and auditable at scale.
Specifically:
-
Queryability across 50k spans. We wanted to group by (benchmark × harness × model) and find patterns. That's a 3D slice across 50k child spans. With Braintrust metadata fields, it's a single SQL query:
SELECT benchmark, harness, model, COUNT(*), AVG(tokens), AVG(scores.task_success) ... GROUP BY 1,2,3. -
Safe score write-back. Adding
scores.task_successto 1,780 existing rows without corrupting them required deterministic span IDs +bt sync pushwith complete rows. -
Topics without manual tagging. The failure taxonomy, the benchmark clustering, the intent groupings all came out of Topics automatically. That's a head start that would have taken days to build by hand.
-
Regression analysis on structured metadata. The harness-vs-model finding required
success ~ C(benchmark) + C(model) + C(harness)on all 1,780 rows. That regression is only possible when every span has queryable metadata fields. Raw traces don't have that structure built in.
And the work doesn't stop at analysis. Because every run is now structured data in Braintrust, this dataset is set up for two more things:
-
This scales well past 50k spans. This dataset is small, but production agent traces are not. Braintrust runs on Brainstore, a storage engine built for AI logs that returns median queries in under a second across terabytes, roughly 80× faster than general-purpose stores, with full-text search in about 240ms. The
GROUP BY benchmark, harness, modelslice we ran here works the same way against millions of spans. -
Turn a failure cluster into a targeted experiment. Topics already grouped the failures into named classes like
False success confirmationandIncomplete multi-step execution. You can filter to one cluster, save those rows as a dataset, and run an experiment against your chosen config to check whether a prompt or harness change actually fixes that specific failure mode, instead of hoping an aggregate score moved for the right reason.