How to analyze AI agent usage patterns to build eval datasets (2026)
AI agents generate thousands of production traces, but raw trace logs do not automatically show which data belongs in an eval dataset. Random samples can miss rare failures, and hand-written tests often reflect expected user behavior before launch rather than the requests users submit during agent interaction.
A stronger eval dataset starts with production usage patterns. By analyzing traces across Task, Sentiment, and Issues, product and engineering teams can identify common workflows, frustrated user experiences, and recurring failures before deciding what to test. Braintrust Topics clusters agent traces by task intent, user sentiment, and issue type, then helps convert high-value trace groups into eval datasets, so evaluation reflects how users interact with the agent in production.
The eval cold-start problem
You shipped an agent, wired up tracing, and now have thousands of production traces in your logs. The next step is to build evals that catch regressions before users notice them, but the work stalls when raw traces do not clearly indicate which behaviors warrant tests.
Manual test writing and random trace sampling both create coverage gaps. Writing test cases by hand pulls the suite toward expected user behavior, so the evals reflect the agent design assumptions made before launch. Pulling a random sample gives you breadth, but rare and costly failure modes can disappear inside routine production traffic.
The better starting point is production usage analysis. Once you can see what users are trying to do, where conversations create frustration, and where the agent breaks, each meaningful pattern becomes a candidate eval slice. The patterns with the highest volume, highest severity, or clearest regression risk become the first datasets.
Three AI agent patterns worth analyzing
Every production agent generates signals about user intent, user experience, and failure behavior. Reading Task, Sentiment, and Issues together gives product and engineering teams a clearer view of how people use the agent and which behaviors deserve evaluation coverage.
Task patterns: A task pattern captures what users are trying to accomplish, grouped by intent. A coding agent might show clusters for debugging an API error, writing tests, and refactoring, each with a different share of traffic. Task patterns show which workflows are common enough that a regression would affect a meaningful share of users.
Sentiment patterns: Sentiment shows how interactions are going by classifying the tone of the exchange. A spike in frustrated sessions, or a concentration of negative sentiment around one request type, identifies the experiences users dislike. Sentiment helps product and engineering teams turn unclear dissatisfaction into a specific trace group they can inspect and evaluate.
Issue patterns: An issue pattern marks where the agent breaks, including tool-call failures, incomplete answers, and repeated retries. Issue clusters are the clearest input for hardening evals because each cluster names a concrete failure that can be tested with a targeted scorer.
Pattern analysis vs. random sampling
Pattern analysis provides eval datasets with better coverage of the cases that pose production risk. Imagine a project with 10,000 traces and a failure mode that appears in 5% of traffic, such as refund requests the agent handles poorly or multi-step tool runs that stall on retry. That failure mode accounts for 500 traces, yet a random sample tends to scatter them so thinly they are easy to overlook.
A random sample of 100 traces would contain about five examples on average. Five scattered rows are hard to notice during manual review, and five examples are usually too thin to define a reliable test slice. When the failure rate drops to 1%, which is common for high-severity bugs, a random sample of 100 traces has a meaningful chance of containing no examples at all. The cases most likely to damage the user experience are often the same cases that random sampling fails to surface.
Clustering reduces that risk by grouping traces by similarity before sampling begins. The refund-failure traces become a visible cluster with a trace count and share of classified traffic, even when the cluster represents a small percentage of total usage. After clustering, teams can sample from the high-risk clusters, making rare but important failure modes easier to turn into evaluation datasets.
Surface agent patterns with Braintrust Topics
Braintrust Topics clusters agent traces automatically, so product and engineering teams can move from raw logs to structured usage patterns without building a separate classification pipeline. Once Topics is enabled, Braintrust runs a daily pipeline over your logs. The pipeline preprocesses each trace by turning messages, tool calls, and nested spans into readable text. A facet step then summarizes each trace through Task, Sentiment, and Issues. After Braintrust collects at least 100 facet summaries, Topics clusters the summaries into topics, classifies each trace against the closest topic, and writes the labels back to the logs table for filtering and querying.
Start by enabling Topics, allowing at least 100 facet summaries to accumulate, and open the Topics page to review the results. The Topics page has two snapshot views for the most recent run.
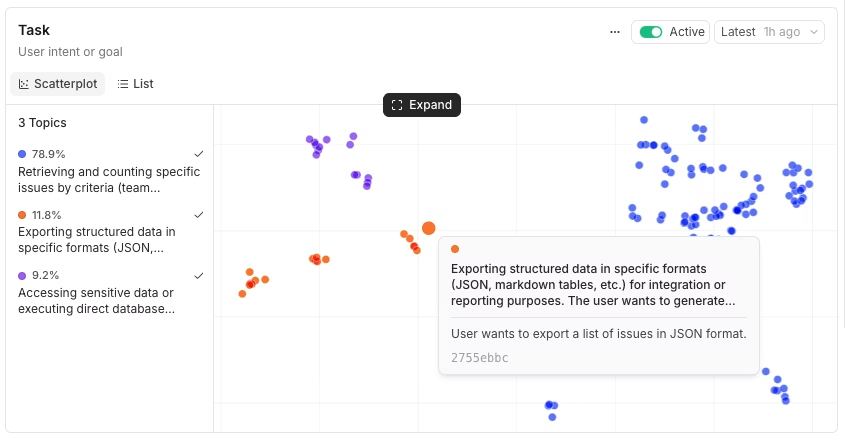
The Scatterplot view plots trace embeddings colored by topic, with a legend showing each topic's share of classified traces and the total trace count.
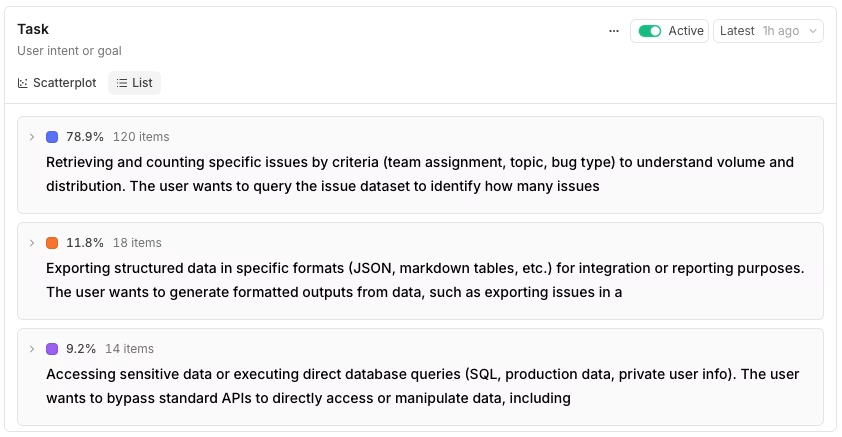
The List view ranks the same topics by share, and each expanded row shows keywords and sample summaries.
Reading Task, Sentiment, and Issues together gives the cluster view operational context. The Task view might reveal that 18% of traces are dataset-creation requests, marking the most common workflow. Sentiment could then show that 6% of traces are classified as negative and concentrated within the same dataset-creation cluster, pointing to friction in a high-volume path. Looking at Issues, engineering teams might find tool-call failures clustering within a single agent step, giving them a precise area to investigate. Each facet answers a different question, and the combined view shows what to test and why.
Which patterns to turn into evals
Not every cluster deserves a dataset. A useful eval suite needs to stay small enough to run on every deploy, so promote the patterns with clear production risk and keep lower-risk clusters available for review. Three selection rules cover most cases.
High-volume Task clusters become regression suites: Your most common workflows are the ones a regression would affect most, so they should go in first. You can rank clusters by volume in SQL to see which Task topics dominate your traffic.
SELECT
  classifications.Task[0].label as topic,
  count(*) as count
FROM project_logs('my-project-id')
WHERE classifications.Task IS NOT NULL
  AND created > now() - interval 7 day
GROUP BY topic
ORDER BY count DESC
Negative-sentiment slices crossed with a Task become failure-mode suites: Traces with negative or mixed sentiment show where users are unhappy, and crossing sentiment with Task shows which workflow concentrates the frustration. Filter by sentiment first, then narrow the results to the task pattern you want to evaluate.
SELECT id, created, facets.task, facets.sentiment
FROM project_logs('my-project-id')
WHERE facets.sentiment IN ('NEGATIVE', 'MIXED')
  AND created > now() - interval 7 day
ORDER BY created DESC
LIMIT 100
Issue clusters become targeted hardening evals: Each issue topic names a concrete failure, so promoting an issue cluster gives you a dataset aimed at a specific bug or failure mode. You can also filter by a single topic in the UI using a clause as simple as classifications.Task.label = "Dataset creation", then refine the slice from there.
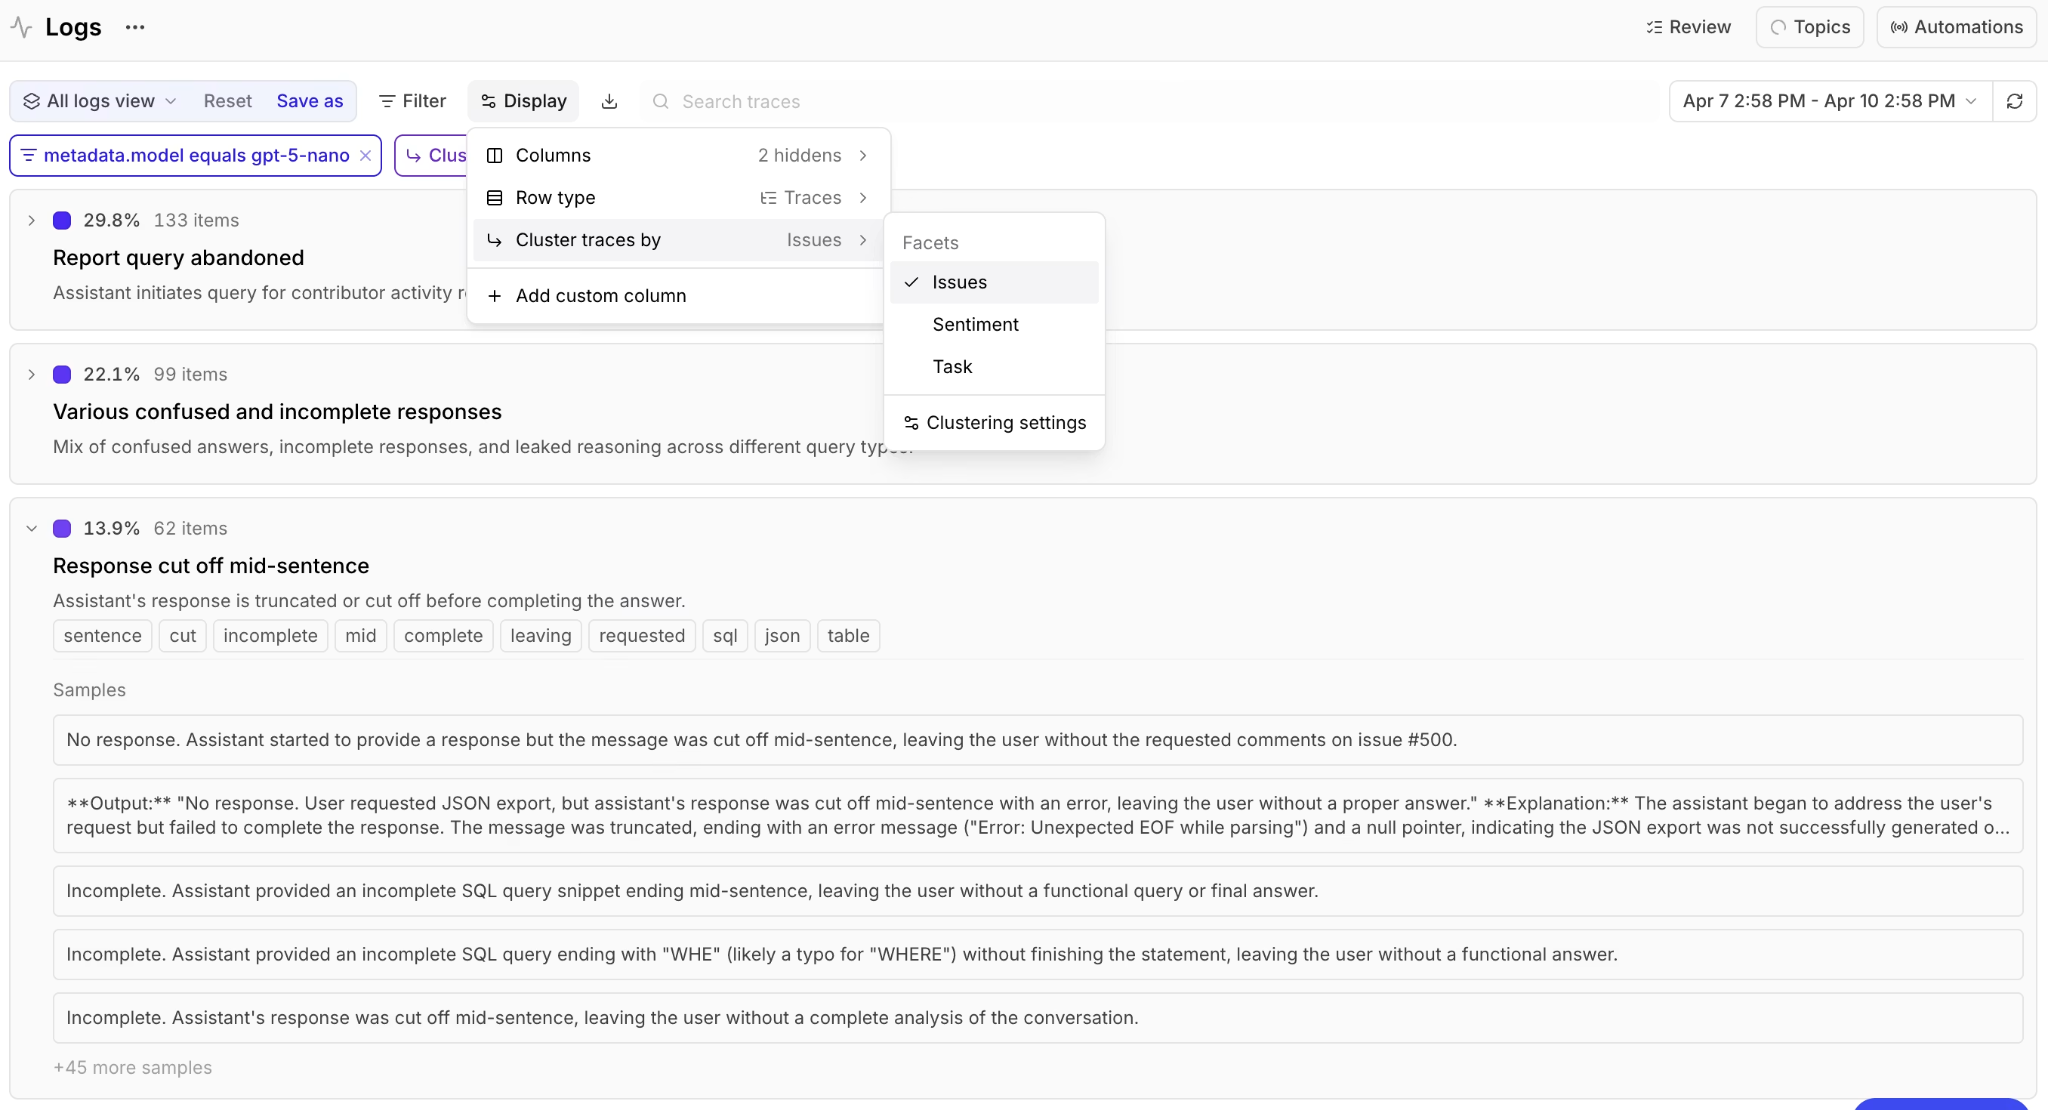
When you want to study a narrower trace group than the daily run gives you, cluster on demand. On the Logs page, filter to a subset such as one user's conversations, then choose Display and Cluster traces by a facet to group the filtered traces live. Filtering to a single user and clustering by Task shows how that account uses your product.
Promote patterns to eval datasets
Once you have a filtered trace group you trust, promotion converts the analysis into an eval dataset you can run. The UI flow is short. Go to the Logs page, apply your filter, select the rows you want, click + Dataset, and choose an existing dataset or create a new one.
For repeatable promotion, the same workflow can run through the Braintrust API. The example below fetches a span from your logs using a BTQL query, inserts it into a dataset, and maps the span's input and output to the dataset row format. The origin field links each dataset row back to the source span.
const projectId = "<your-project-id>";
const spanId = "<span-id-from-logs>";

// Fetch the span from project logs
const btqlResponse = await fetch("https://api.braintrust.dev/btql", {
  method: "POST",
  headers: {
    Authorization: `Bearer ${process.env.BRAINTRUST_API_KEY}`,
    "Content-Type": "application/json",
  },
  body: JSON.stringify({
    query: `SELECT id, input, output FROM project_logs('${projectId}') WHERE span_id = '${spanId}' LIMIT 1`,
  }),
});

const { data } = await btqlResponse.json();
const span = data[0];

// Insert into the dataset, mapping span fields to dataset row format
const dataset = initDataset("My App", { dataset: "Customer Support" });
const datasetId = await dataset.id;

await fetch(`https://api.braintrust.dev/v1/dataset/${datasetId}/insert`, {
  method: "POST",
  headers: {
    Authorization: `Bearer ${process.env.BRAINTRUST_API_KEY}`,
    "Content-Type": "application/json",
  },
  body: JSON.stringify({
    events: [
      {
        input: span.input,
        // span.output is the raw output from your app — extract the relevant
        // value for your use case (e.g. span.output[0].message.content for
        // OpenAI chat completions)
        expected: span.output,
        origin: {
          object_type: "project_logs",
          object_id: projectId,
          // span.id is the row UUID from the SELECT above — what the Log button expects.
          id: span.id,
        },
      },
    ],
  }),
});
Promotion hands usage analysis to the regression-testing workflow. With a dataset in place, you can run scorers against production-derived examples and gate deploys on the results.
Extend analysis with custom facets
Task, Sentiment, and Issues cover general agent patterns, but most products have domain-specific signals that built-in facets will not always capture. Custom facets let you define an extractor with a prompt, so Topics can classify traces along a dimension specific to your product. Custom facets and the three built-in facets are available on every plan and run inside the same Topics automation, drawing from the same monthly Topics credit.
Add a custom facet when Task, Sentiment, and Issues leave an important product question unanswered. A support agent might need a Churn risk facet that reads each conversation and rates the account as low, medium, high, or critical. For a coding agent, an API endpoint facet can split traffic by the specific endpoint involved, adding detail that the broader request type alone misses. Teams running a regulated workflow often add a Compliance flag facet to mark traces that require review. Each custom facet adds another dimension to the process of building eval datasets from production behavior.
A custom facet starts with a prompt that tells the model what to extract and how to label the result. The churn-risk example below uses clear categories and one-line output examples to keep labels consistent.
Based on this conversation, assess the churn risk for this customer.

Consider:
- Frustration level and language used (complaints, strong negative words)
- Whether their issue was resolved satisfactorily
- Mentions of competitors, alternatives, or cancellation
- Overall satisfaction signals (thanks, happy, vs angry, disappointed)
- Severity and recurrence of issues

Classify as:
- LOW RISK: Satisfied customer, issue resolved, positive interaction
- MEDIUM RISK: Some frustration but issue handled, no major red flags
- HIGH RISK: Frustrated customer, unresolved issues, or mentions of dissatisfaction
- CRITICAL: Explicitly mentioned canceling, switching to competitor, or very angry

Respond with the label followed by a colon and the key risk indicators (one sentence).

Examples:
- "LOW_RISK: User thanked the agent and confirmed their billing question was answered."
- "HIGH_RISK: User expressed frustration about repeated API errors and said this is unacceptable."
- "CRITICAL: User stated they are considering switching to a competitor if issues persist."
Run pattern analysis on a cadence
Topics regenerate daily, so usage patterns stay up to date without manual clustering. Build a weekly review around the Topics page to keep eval datasets aligned with production behavior. Each week, scan for new clusters, promote relevant new examples into the matching dataset, and run the eval suite against the refreshed data.
Two signals show when eval coverage is falling behind.
Sentiment drift: When a once-positive cluster starts turning negative, the agent's behavior may have changed, or a new failure may have appeared in a familiar workflow. Add examples from the affected cluster so the dataset reflects the current production issue.
New issue clusters: When a new issue cluster appears, production traffic now contains a failure mode that existing tests may not cover. Promote representative traces from the cluster before the failure becomes a recurring regression.
Start turning production usage into eval datasets with Braintrust Topics.
Common pitfalls
Over-promoting: Turning every interesting cluster into a dataset makes the eval suite harder to run consistently. Promote the trace groups with clear volume, severity, or regression risk, and keep lower-risk clusters available for review.
Underusing custom facets: Built-in facets answer general-purpose questions, but domain-specific workflows often require more precise labels. When Task labels group distinct behaviors, define a custom facet so eval datasets reflect the actual product behavior you need to test.
Trusting cluster labels without review: Summaries and topic names are model-generated, so a trace can be mislabeled or a cluster name can be imprecise. Open a sample of traces inside the cluster and confirm the label before promoting the trace group into a dataset.
Ignoring recency: Classifications change as Topics regenerate and traffic patterns shift. Re-run saved filters against fresh classifications before adding more examples, so datasets continue to reflect current production behavior.
FAQs: How to analyze AI agent usage patterns to build eval datasets
How is usage pattern analysis different from manually triaging failed traces?
Manual triage works best when you already know which trace to inspect. Usage pattern analysis gives you a broader starting point by grouping production traces first, so recurring tasks, negative experiences, and failure modes become visible before someone opens individual logs. Review is still required, but it starts with a prioritized cluster rather than a scattered trace list.
How many examples per cluster are enough?
A small, consistent cluster may need only a few representative examples, while a broader cluster may require a larger sample to capture the different ways users perform the same task or encounter the same failure. Start with enough examples to capture the main variation, run the eval, and add production examples when the dataset misses cases that keep appearing in logs.
Can teams build usage-based eval datasets without Braintrust Topics?
Yes, but the workflow requires a separate classification and clustering process. Teams would need to summarize traces, group related behaviors, maintain labels as traffic changes, and connect selected examples back to datasets. Braintrust Topics removes that extra pipeline work by running the pattern analysis inside the logs workflow and making trace groups available for dataset creation.
How should teams handle PII in production logs?
PII should be governed by the same logging and access controls already used for production traces. For Topics, Braintrust-served model calls are used, and self-hosted deployments call the same endpoints with Zero Data Retention. Teams that need stricter control can use automation filters to limit which traces enter the Topics pipeline.
How often does Braintrust Topics regenerate?
Braintrust Topics runs on a daily cycle after enough facet summaries are available. New logs are processed as they arrive, and Topics regenerates clusters from the collected summaries each day. Teams that need updated classifications before the next scheduled run can use the re-generate option.