Browse traces or spans
By default, logs display as a table of traces where each row represents a complete trace with its root span. Select Display > Row type > Spans view to see all logged spans individually. View individual spans when you want to:- Analyze specific operations within traces
- Find particular function calls or API requests
- Examine timing for individual operations
Filter traces
Each project provides default table views with common filters, including:- Default view: Shows all records
- Non-errors: Shows only records without errors
- Errors: Shows only records with errors
- Unreviewed: Hides items that have been human-reviewed
- Assigned to me: Shows only records assigned to the current user for human review
Group related traces
Group related traces by shared metadata or tags to understand multi-step operations.- Select Display > Group trace by and choose a tag or metadata path.
- Select a trace with the grouped attribute to see it alongside all related traces
- Switch to Timeline view to see operation timing or Thread view for the entire session.
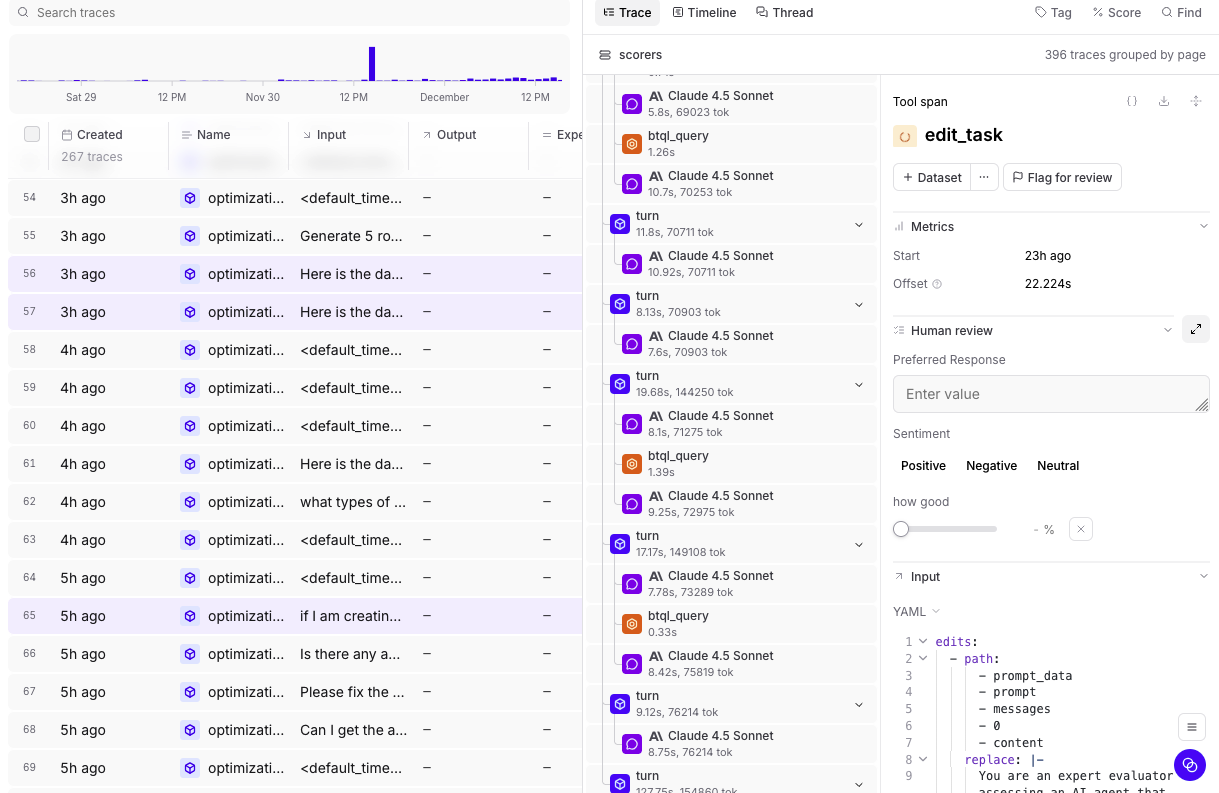
Examine a trace
Select any trace from the logs table to open it in a panel on the right side of your screen. The trace shows all spans that make up the request, with detailed information about inputs, outputs, timing, and metadata. Use the button to expand the trace to fullscreen or the button to open it in a separate page.View as a hierarchy
While viewing a trace, select Trace to view the trace as a nested hierarchy. Each span is indented under its parent, making it useful for understanding the logical structure of your application: which function called which, how tool calls nest under LLM calls, and how sub-tasks relate to the root task. Expand and collapse branches to navigate the call graph. Each span row shows inline metrics. By default, these are duration, total tokens, and estimated LLM cost. Cost is propagated from child spans to parent spans, making it easy to see which parts of a multi-step workflow are consuming the most of your cost budget. Use > Display metric types to toggle which metrics appear:- Duration (on by default)
- Total tokens (on by default)
- Time to first token
- Estimated LLM cost (on by default)
View as a timeline
While viewing a trace, select Timeline to visualize the trace as a horizontal bar chart. Each bar represents a span, and bar width represents a metric of your choice. Bars are color-coded by span type, making it easy to identify performance bottlenecks and understand the execution flow. Select and then Scale by to change the metric used to scale the bars. Available options:- Duration (default) — bar width represents wall-clock time
- Total tokens — bar width represents total token usage, useful for identifying spans that consume the most context
- Prompt tokens — bar width represents input token usage
- Completion tokens — bar width represents output token usage
- Estimated cost — bar width represents the estimated cost of each span
- Enable Maintain hierarchy to preserve parent-child relationships: Parent spans are kept even if they don’t match the filter, as long as they have matching descendants.
View as a conversation
While viewing a trace, select Thread to view the trace as a conversation thread. This view displays messages, tool calls, and scores in chronological order, stripping away the hierarchy to show what was said and in what order. Use it for reading agent conversations and understanding the narrative flow of multi-turn interactions. By default, the thread view renders raw span data. Select to apply a preprocessor — choose the built-in Thread preprocessor to format the trace as a readable conversation, or select a custom preprocessor to control exactly how messages are rendered. When topics are enabled, topic tags and facet outputs appear at the top of the thread view as well. Use Find or pressCmd/Ctrl+F to search within the thread view and quickly locate specific content such as message text and score rationale. Matches are highlighted in-place using your browser’s native highlighting. This search is scoped to the thread view content — use the trace view’s search feature to search across spans.
Test and apply signals
While viewing a trace, select Signals to test topic facets and scorers on the current trace.- Topic facets: Test how preprocessors transform the trace data, test what summaries prompts extract, or apply the complete facet (preprocessor + prompt) to see the end-to-end result.
- Scorers: Test scorers, apply them to the trace, or configure an automation rule for online scoring.
Create custom trace views
While viewing a trace, select Views to create custom visualizations using natural language. Describe how you want to view your trace data and Loop will generate the code. For example:- “Create a view that renders a list of all tools available in this trace and their outputs”
- “Render the video url from the trace’s metadata field and show simple thumbs up/down buttons”
Self-hosted deployments: If you restrict outbound access, allowlist
https://www.braintrustsandbox.dev to enable custom views. This domain hosts the sandboxed iframe that securely renders custom view code.Search within a trace
While viewing a trace, use Find or pressCmd/Ctrl+F to search for content within the trace. A scope dropdown lets you choose where to search:
- This span — Search only within the currently selected span.
- Full trace — Search across all spans in the trace.
Trace search finds content within the currently open trace. To search across all traces in your project, use filters or deep search.
Change span data format
When viewing a trace, each span field (input, output, metadata, etc.) displays data in a specific format. Change how a field displays by selecting the view mode dropdown in the field’s header. Available views:- Pretty - Parses objects deeply and renders values as Markdown (optimized for readability)
- JSON - JSON highlighting and folding
- YAML - YAML highlighting and folding
- Tree - Hierarchical tree view for nested data structures
- LLM - Formatted AI messages and tool calls with Markdown
- LLM Raw - Unformatted AI messages and tool calls
- HTML - Rendered HTML content
View raw trace data
When viewing a trace, select a span and then select the button in the span’s header to view the complete JSON representation. The raw data view shows all fields including metadata, inputs, outputs, and internal properties that may not be visible in other views. The raw data view has two tabs:- This span - Shows the complete JSON for the selected span only
- Full trace - Shows the complete JSON for the entire trace
- Inspect the complete span structure for debugging
- Find specific fields in large or deeply nested spans
- Verify exact values and data types
- Export or copy the full span for reproduction
Navigate to trace origins
To trace the origin of a trace that comes from a prompt or dataset:- Click in the trace header.
- Choose Go to origin prompt or Go to origin dataset.
- Trace issues back to the original prompt or dataset
- See which dataset example led to a result
- Move efficiently between trace analysis and refining prompts or datasets
Share traces
When viewing a trace:- Select Share.
- Choose whether to make the trace Private or Public. Making a trace public grants access only to that trace.
- Click Copy link and share it with others.
Re-run a prompt
When viewing a prompt span in a trace:- Select Run.
- In the Run prompt dialog, make changes as necessary.
- Select Test to see the output.
Analyze with Loop
Use Loop to query and analyze your logs through natural language. Loop is available on both the main Logs page and when viewing individual traces. See Analyze logs and Analyze individual traces for more details.Iterate in playgrounds
Extract prompts and inputs from logs to quickly test variations in playgrounds.- Select the rows you want to extract.
- Select Iterate in playground.
- Customize settings and optionally append to existing resources.
- Select Create playground.
Assign for review
You can assign traces to team members for review, analysis, or follow-up action. Assignments are particularly useful for human review workflows, where you can assign specific rows that need human evaluation and distribute review work across multiple team members. See Assign rows for review for details.Organize with tags
Tags help you categorize and track specific types of data across logs, datasets, and experiments. See Apply tags for how to configure tags and apply them via the UI or SDK.Customize the logs table
Show and hide columns
Select Display > Columns and then:- Show or hide columns to focus on relevant data
- Reorder columns by dragging them
- Pin important columns to the left
TaskName to see all logs related to a specific user goal, or sort by Sentiment to identify negative interactions.
Create custom columns
Surface important metadata, scores, or nested values directly in the logs table by creating custom columns:- Select Display > + Add custom column.
- Name your column.
- Choose from inferred fields or write a SQL expression.
User ID with the expression metadata.user_id to display the user ID for each trace.
Custom columns work the same way in both logs and experiments. For more details, see Create custom columns.
Change the table density
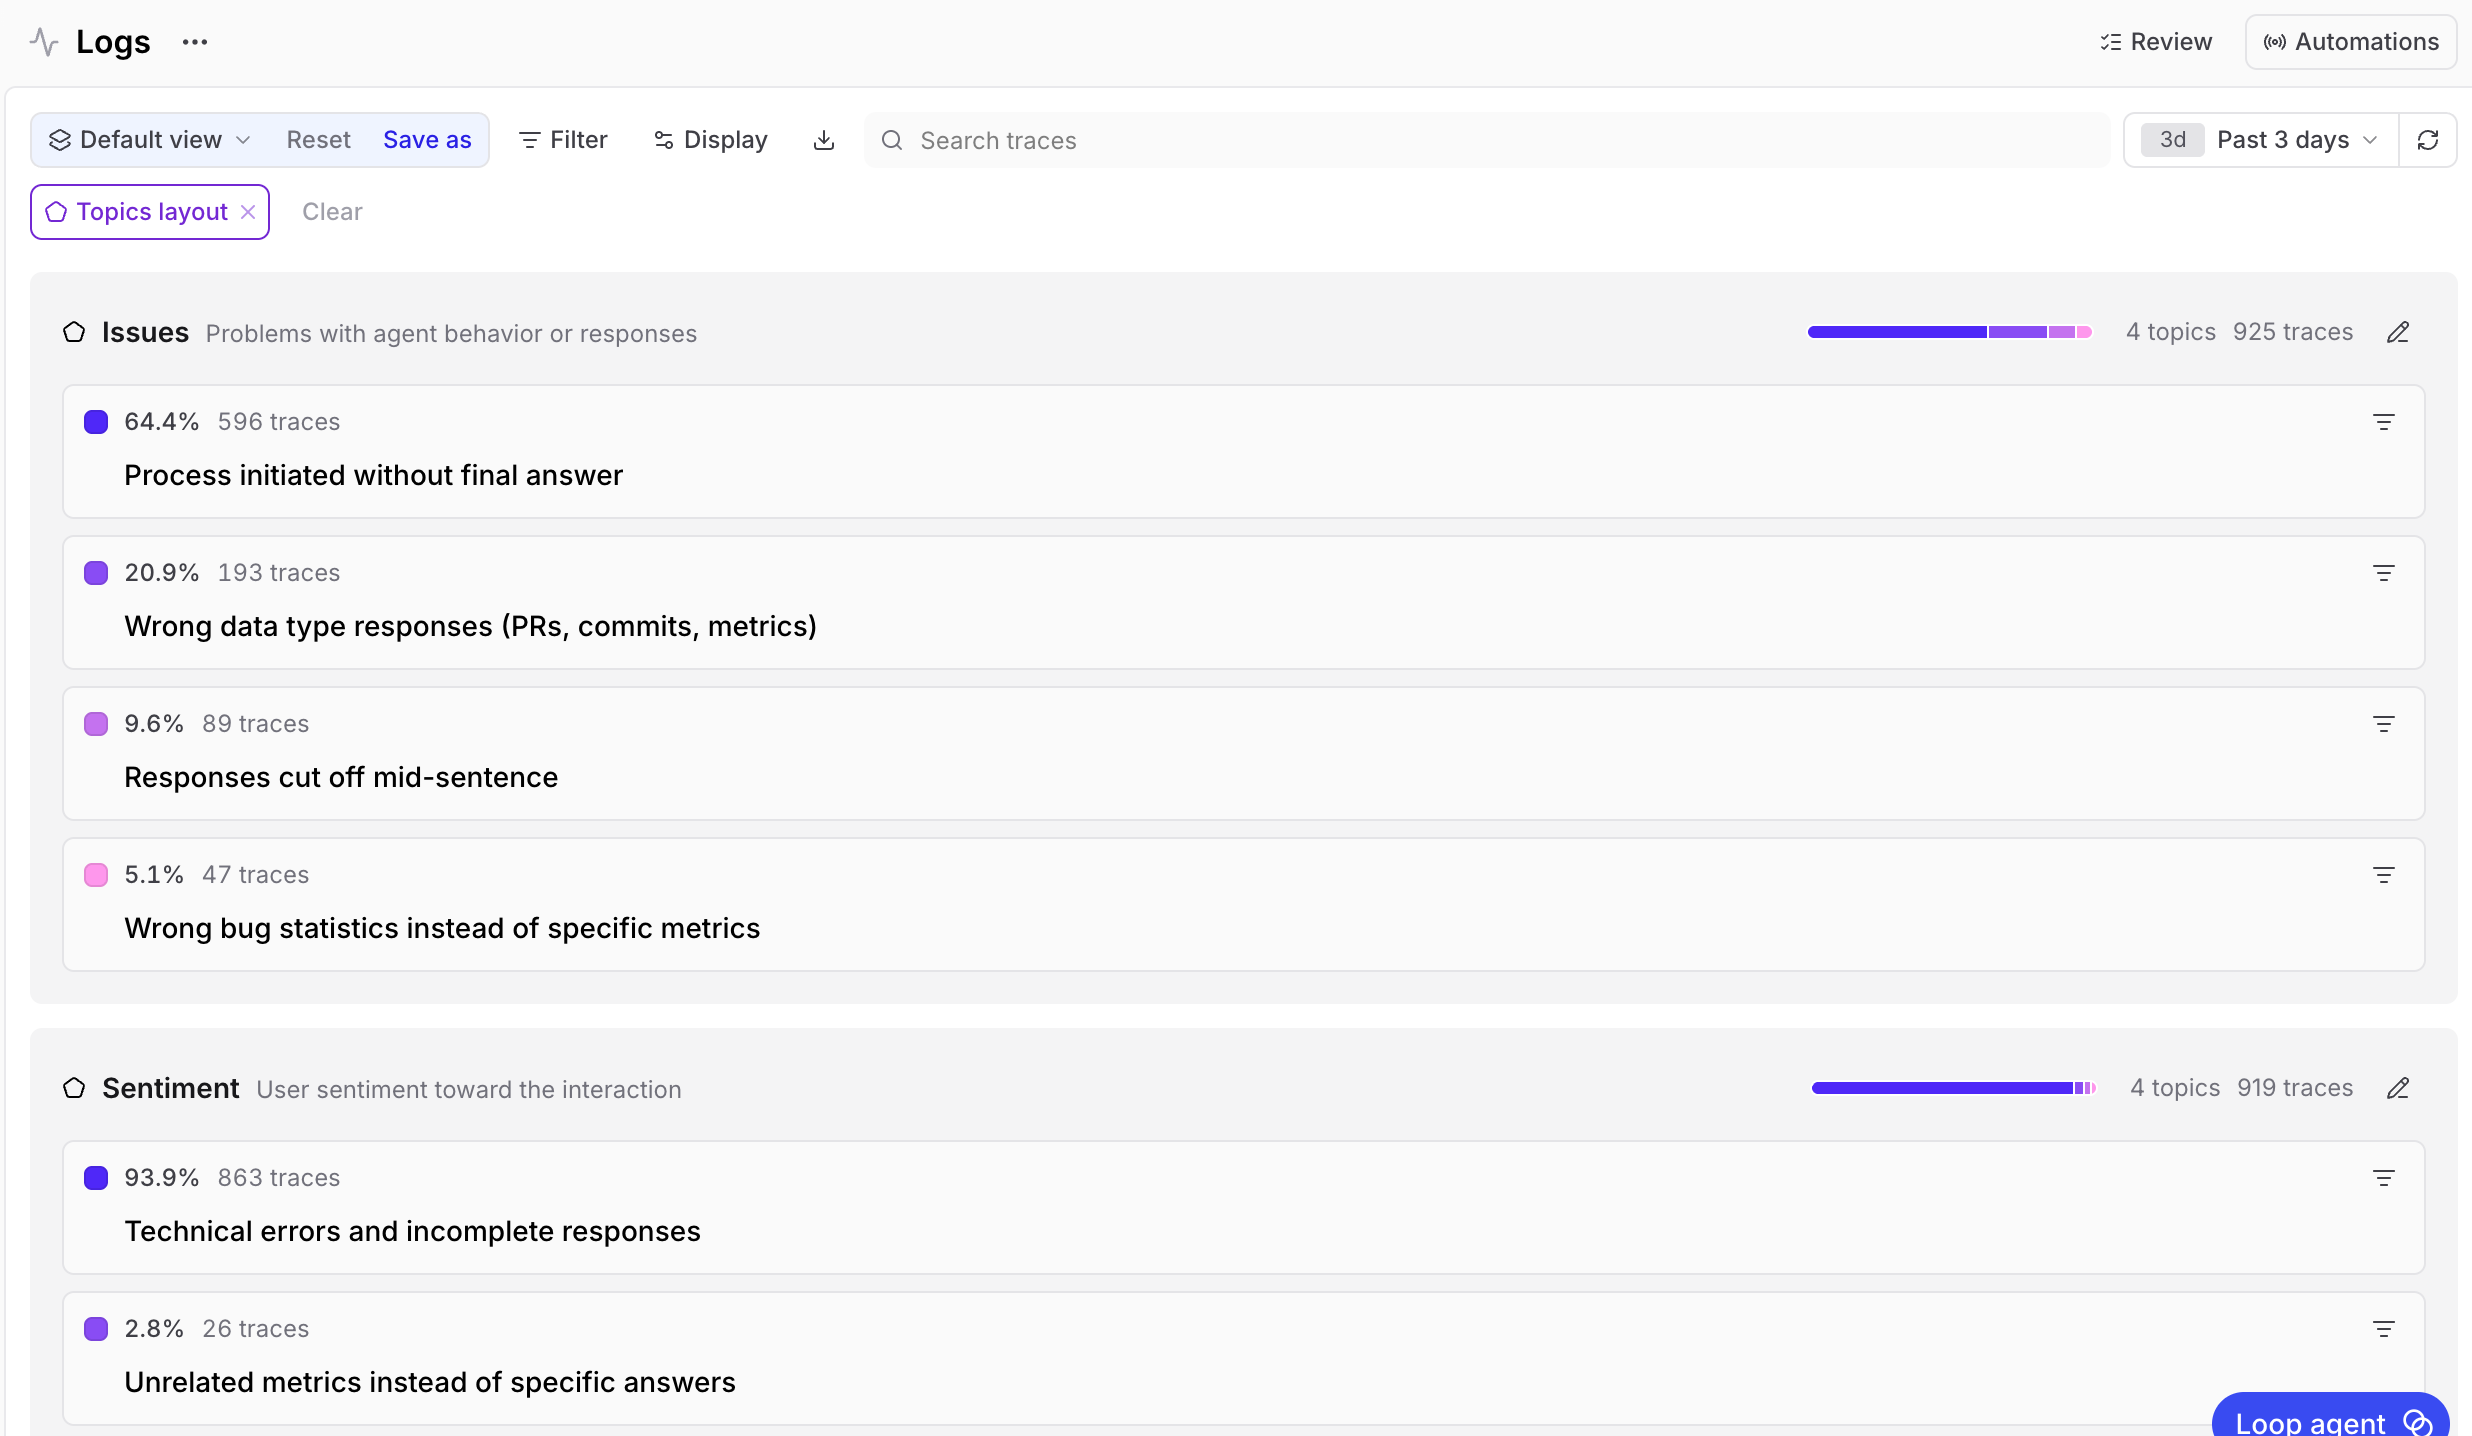
To change the table density to see more or less detail per row, select Display > Row height > Compact or Tall.Visualize topic distributions
View all your topic maps and their distributions in one place.- Go to Logs.
- Select Display > Layout > Topics.
Create custom table views
To create or update a custom table view:- Apply the filters and display settings you want.
- Open the menu and select Save view… or Save view as….
Custom table views are visible to all project members. Creating or editing a table view requires the Update project permission.
Set default table views
You can set default views at two levels:- Organization default: Visible to all members when they open the page. This applies per page — for example, you can set separate organization defaults for Logs, Experiments, and Review. To set an organization default, you need the Manage settings organization permission (included by default in the Owner role). See Access control for details.
- Personal default: Overrides the organization default for you only. Personal defaults are stored in your browser, so they do not carry over across devices or browsers.
- Switch to the view you want by selecting it from the menu.
- Open the menu again and hover over the currently selected view to reveal its submenu.
- Choose Set as personal default view or Set as organization default view.
- Open the menu and hover over the currently selected view to reveal its submenu.
- Choose Clear personal default view or Clear organization default view.
Next steps
- Analyze with Loop using natural language queries
- Filter and search to find specific traces
- Use deep search for semantic queries
- Score online to evaluate production data
- Create dashboards to monitor metrics