Browse logs
- UI
- CLI
To view logs from your application in real-time, go to Logs in your project.Use the time range selector in the toolbar to control which logs are displayed. Select Live tail to stream new rows as they arrive. New rows are highlighted with a flash animation, and streaming pauses automatically when the browser tab is hidden. For a fixed window, choose a range such as 1 hour or 7 days instead.By default, logs display as a table of traces where each row represents a complete trace with its root span. Select Display > Row type > Spans view to see all logged spans individually.View individual spans when you want to:
- Analyze specific operations within traces.
- Find particular function calls or API requests.
- Examine timing for individual operations.
Built-in views
Each project provides default table views with common filters:- Default view: Shows all records.
- Non-errors: Shows only records without errors.
- Errors: Shows only records with errors, excluding scorer and Topics spans.
- LLM span errors: Shows LLM spans with errors, excluding scorer and Topics spans, so the view reflects errors from your application traffic rather than Braintrust’s internal scoring and Topics processes.
- Unreviewed: Hides items that have been human-reviewed.
- Assigned to me: Shows only records assigned to the current user for human review.
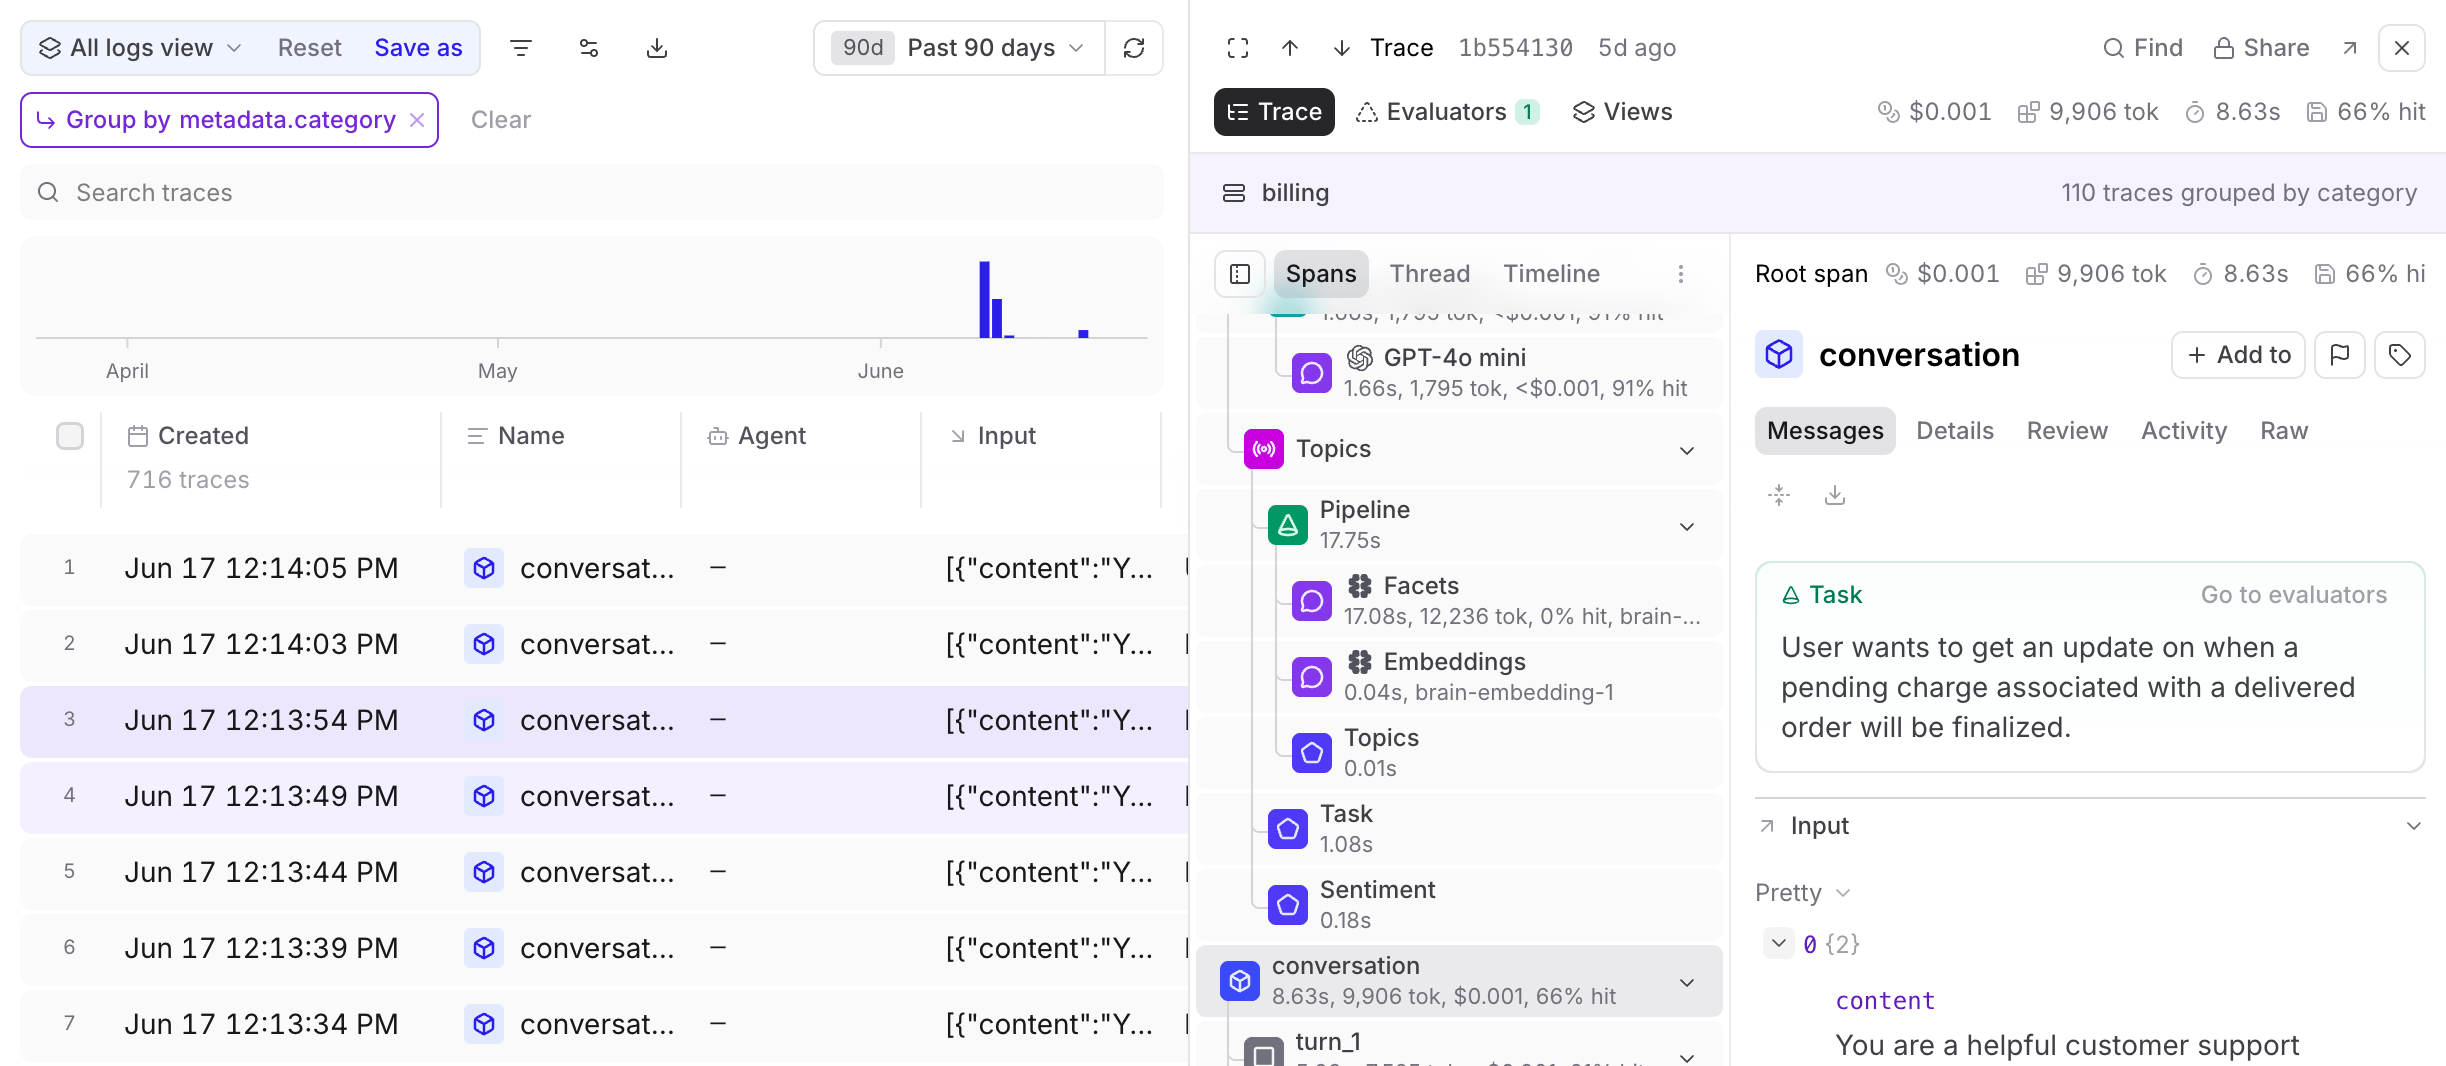
Group related traces
Group related traces by shared metadata or tags to understand multi-step operations.- Select Display > Group trace by and choose a tag or metadata path.
- Select a trace with the grouped attribute to see it alongside all related traces
- Switch to Timeline () view to see operation timing or Thread () view for the entire session.
Examine a trace
Select any trace from the logs table to open it in the trace viewer. See Examine traces for details on navigating trace views, layouts, and actions.Delete traces
- UI
- API
Delete traces from the log table using the Braintrust UI:
- Select the traces you want to delete.
- Click Delete selected rows from current project logs.
- Confirm the deletion.
Analyze with Loop
Use Loop to query and analyze your logs through natural language. Loop is available on both the main Logs page and when viewing individual traces. See Analyze logs and Analyze individual traces for more details.Iterate in playgrounds
Extract prompts and inputs from logs to quickly test variations in playgrounds.- Select the rows you want to extract.
- Select Iterate in playground.
- Customize settings and optionally append to existing resources.
- Select Create playground.
Assign for review
You can assign traces to team members for review, analysis, or follow-up action. Assignments are particularly useful for human review workflows, where you can assign specific rows that need human evaluation and distribute review work across multiple team members. See Assign rows for review for details.Organize with tags
Tags help you categorize and track specific types of data across logs, datasets, and experiments. See Apply tags for how to configure tags and apply them via the UI or SDK.Download logs
- UI
- CLI
On the Logs page, select and then Download as CSV or Download as JSON.
Customize the logs table
Show and hide columns
Select Display > Columns and then:- Show or hide columns to focus on relevant data
- Reorder columns by dragging them
- Pin important columns to the left
password_reset label. Topics add facet summary columns that work the same way.
Create custom columns
Surface important metadata, scores, or nested values directly in the logs table by creating custom columns:- Select Display > + Add custom column.
- Name your column.
- Choose from inferred fields or write a SQL expression.
metadata.user_id for a simple field reference, or write a more complex expression like concat(metadata.plan, ' / ', metadata.region) or metadata.latency_ms / 1000.0. You can use functions (concat, coalesce, lower), CASE expressions, arithmetic, and string patterns (LIKE, ILIKE). Aggregate functions such as avg() are not supported, and expressions cannot reference other custom columns.
Custom columns evaluate against each table row. In the default Traces row type, each row is the root span, so fields that exist only on child spans appear empty. To show those fields, select Display > Row type > Spans, or log the field on the root span.Filters can still match child-span fields in the Traces row type, so a filter can succeed even when the custom column is empty.
Change the table density
To change the table density to see more or less detail per row, select Display > Row height > Compact or Tall.Visualize topic distributions
When topics are enabled, you can switch the Logs table to a topic distribution view that shows each topic as a card with its percentage of the total and trace count. See Real-time analysis for details and other real-time options.Create custom table views
To create or update a custom table view:- Apply the filters and display settings you want.
- Open the menu and select Save view… or Save view as….
Custom table views are visible to all project members. Creating or editing a table view requires the Update project permission.
Duplicate table views across projects
If you’ve built a useful custom table view in one project, you can duplicate it to another project via the API rather than recreating it from scratch.-
Use the list views API endpoint to fetch the “logs” views in your source project. Pass the following query parameters:
object_type=projectobject_id=<source-project-id>view_type=logs
-
In the response, find the view you want to duplicate and copy its
view_dataandoptionspayloads. -
Use the create view API endpoint to create the view in the destination project. Set
object_idto the destination project ID.
Set default table views
You can set default views at three levels:- Organization default: Visible to all members when they open the page. This applies per page. For example, you can set separate organization defaults for Logs, Experiments, and Review. To set an organization default, you need the Manage settings organization permission (included by default in the Owner role). See Access control for details.
- Project default: Overrides the organization default for everyone viewing this project. To set a project default, you need the project-level Update permission. Project admins can set project defaults even without organization-level permissions. See Access control for details.
- Personal default: Overrides the project and organization defaults for you only. Personal defaults are stored in your browser, so they do not carry over across devices or browsers.
- Switch to the view you want by selecting it from the menu.
- Open the menu again and hover over the currently selected view to reveal its submenu.
- Choose Set as personal default view, Set as project default view, or Set as organization default view.
- Open the menu and hover over the currently selected view to reveal its submenu.
- Choose Clear personal default view, Clear project default view, or Clear organization default view.
Next steps
- Analyze with Loop using natural language queries
- Filter and search to find specific traces
- Score online to evaluate production data
- Create dashboards to monitor metrics