Best RAG observability tools (2026): monitor retrieval and generation in production
TL;DR
RAG failures in production are difficult to catch with generic logs. The retriever can return plausible chunks, the generated answer can read clearly, and application metrics can remain healthy while the system quotes outdated product specs, misses policy details, or grounds an answer in the wrong context.
RAG observability provides engineering teams with trace-level visibility into retrieval, reranking, context assembly, and generation. The strongest RAG observability tools also score live traffic for groundedness, faithfulness, answer relevance, and retrieval quality, so regressions surface before customers report bad answers.
This guide compares Braintrust, Arize Phoenix, Langfuse, Comet (Opik), and Galileo against the criteria that decide whether a tool can actually support production RAG systems: retrieval-span depth, live quality scoring, drift detection, framework coverage, debugging UX, and self-host options. Braintrust is the best option for teams that want RAG observability integrated with evals, traces, prompt iteration, and release-quality feedback in a single workflow.
Teams focused on pre-deployment quality testing can also check out the best RAG evaluation tools.
What is RAG observability?
Production RAG fails in ways traditional logging cannot show. A retriever can return the expected number of chunks, an LLM can generate a confident answer, and application health metrics can remain normal. The real failure often sits deeper in retrieval, reranking, or context assembly. Retrieved chunks may be semantically close but topically wrong, the LLM may fill missing context with a hallucinated answer, or the reranker may remove the one chunk required for a correct response.
RAG observability provides engineering teams with visibility into the four trace types where production RAG failures most often occur.
- Retrieval traces record which chunks were retrieved, with what scores, and in what order.
- Reranker traces record how the ranking changed between the initial retrieval and the final context.
- Context-assembly traces record how chunks were stitched into the final prompt.
- Generation traces record the LLM call, including inputs, outputs, latency, and cost.
RAG observability is often grouped with RAG evaluation, LLM monitoring, and APM observability, but each discipline answers a different operational question.
| Discipline | Primary question | Limitation for production RAG |
|---|---|---|
| RAG evaluation | Does the system meet a quality bar before deployment? | Pre-deployment evals do not show how retrieval and generation quality change on live traffic. |
| Generic LLM monitoring | How are LLM calls performing on cost, latency, token usage, and errors? | Generation-level metrics do not show whether the retriever returned irrelevant context or the reranker demoted the right chunk. |
| APM observability | Are services healthy from an infrastructure perspective? | Infrastructure metrics do not measure answer quality, retrieval accuracy, or grounding. |
RAG observability runs on live production traffic, scores both retrieval and generation quality, and gives engineers a single trace view for debugging a specific failed query.
Core technical components of RAG observability
Strong RAG observability tools capture the full request path from the user query to the final answer, and attach quality signals to each step. The exact implementation differs by platform, but the core workflow usually includes pipeline tracing, retrieval scoring, generation scoring, drift detection, and per-trace debugging.
Pipeline tracing
Every request creates a span hierarchy that starts with the user query and continues through embedding, retrieval, reranking, context assembly, and generation. Each span records inputs, outputs, latency, and application metadata.
Tools differ in how they capture trace data. Phoenix and Langfuse use OpenTelemetry and OpenInference as native ingestion paths, enabling teams to export the same instrumentation to multiple backends. Braintrust and Comet (Opik) use vendor SDKs as the primary setup path, with OpenTelemetry support available for teams that already use OTEL across backend services. For a broader comparison of tracing, the LLM tracing tools guide covers instrumentation choices in greater depth.
Retrieval-quality scoring
RAG observability tools apply retrieval metrics such as precision@k, recall@k, mean reciprocal rank, and context relevance to sampled production traces. Scoring can use an LLM judge, a smaller evaluator model, or custom code, depending on how much control the team needs.
RAG evaluation metrics indicate whether the retriever found the correct context, whether the correct chunk ranked highly enough, and whether the final prompt had sufficient evidence for the answer.
Generation-quality scoring
Live generation scoring measures whether the answer remained grounded in the retrieved context and correctly answered the user's question.
- Groundedness checks whether the answer is supported by the context.
- Faithfulness checks whether the answer contradicts the context.
- Answer relevance checks whether the response addresses the original query.
LLM-as-a-judge scoring turns these quality signals into production metrics, so engineering teams can monitor answer quality across real traffic without waiting for user reports.
Drift detection
RAG quality often degrades gradually. Retrieval precision may fall for a specific query group, generation quality may drop after a prompt update, or embedding behavior may shift after a model change.
Drift dashboards surface these slower regressions across time windows, query cohorts, and embedding distributions. A reranker update may improve median quality while hurting long-tail queries, and cohort-level drift detection makes those regressions easier to isolate.
Per-trace debugging
When a user reports a bad answer, the engineer needs a view that connects the retrieved chunks, similarity scores, reranker order, assembled prompt, and final output. Strong per-trace debugging makes the failed request explainable without jumping across separate logs, dashboards, and prompt files.
Side-by-side comparisons across trace IDs, model versions, and prompt revisions help engineering teams identify which change caused the regression and whether the fix restored retrieval and generation quality.
What to look for in a RAG observability tool
Six criteria separate platforms that can debug RAG behavior in production from monitoring tools that only capture the final LLM call after context has already been selected.
Pipeline-level tracing: A RAG observability tool should preserve the full span hierarchy across retrieval, reranking, context assembly, and generation. Generation-only traces leave engineers without visibility into the retrieval and ranking decisions that usually explain bad answers.
Live quality scoring: The tool should score groundedness, faithfulness, answer relevance, and retrieval precision continuously on production traffic, not only against pre-built eval sets. When live scoring uses the same definitions as pre-deployment evals, production regressions map back to known quality baselines faster.
Drift detection: RAG quality often degrades over hours or days, especially after prompt changes, embedding model updates, or reranker adjustments. Tools that track drift across query cohorts, time windows, and embedding distributions catch slow regressions that single-trace alerting often misses.
Per-trace debugging UX: Engineers should be able to inspect retrieval results, reranker order, assembled context, generated output, and quality scores in a single trace view. Fewer disconnected tabs during an incident means faster diagnosis and cleaner regression fixes.
Framework support: The strongest tools support LangChain, LangGraph, LlamaIndex, Haystack, Mastra, custom pipelines, and OpenTelemetry-instrumented stacks. Framework-agnostic tools fit custom RAG systems, while framework-native tools work best when the pipeline already standardizes on one orchestration library.
OSS or self-host options: Compliance teams with data-residency requirements often need open-source, self-hosted, VPC, or hybrid deployment options. Phoenix, Langfuse, and Comet (Opik) handle self-hosting directly, while Braintrust and Galileo cover stricter deployment requirements through enterprise options.
The 5 best RAG observability tools in 2026
1. Braintrust
Best for: AI teams that want RAG observability connected to evals, traces, prompt iteration, and production-quality feedback on a single platform.
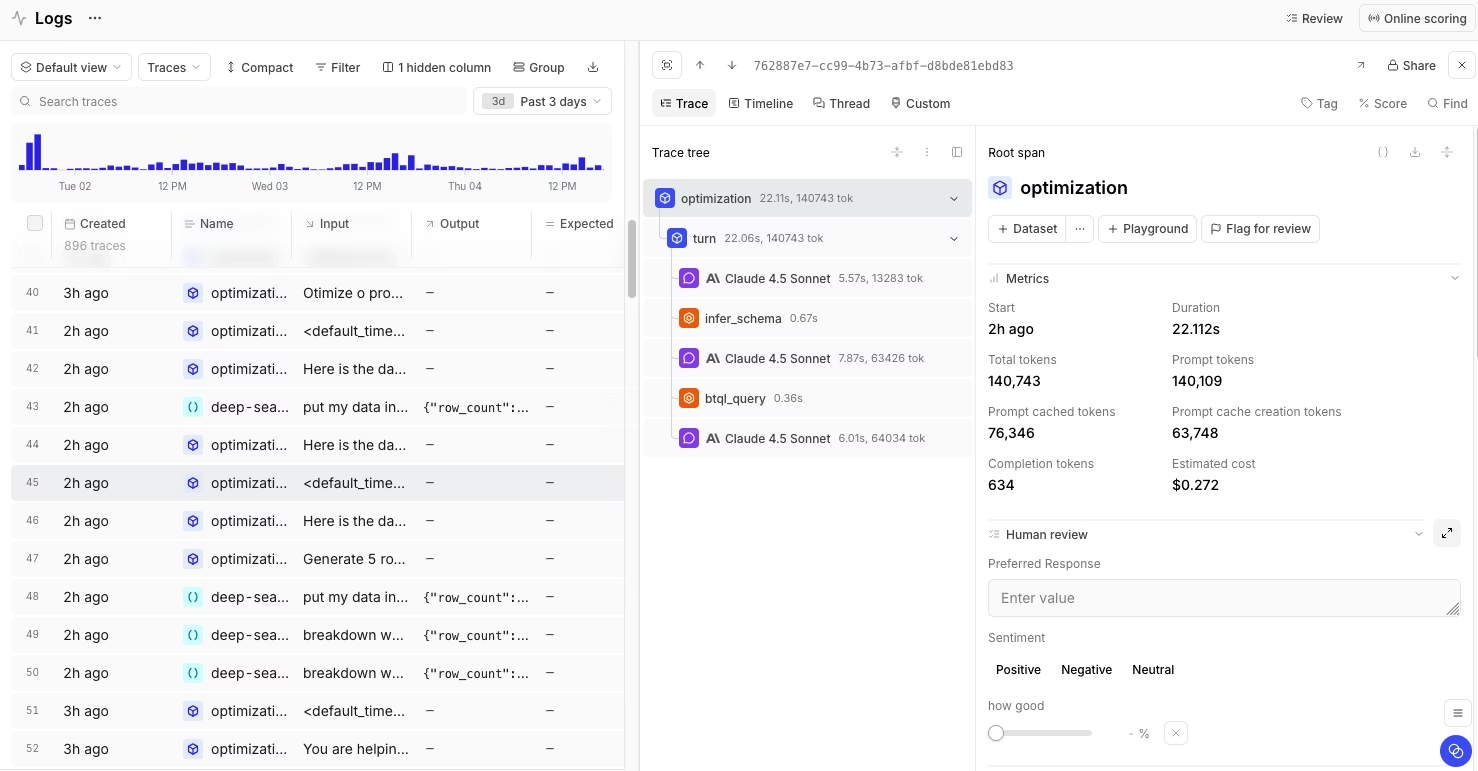
Braintrust provides engineering teams with trace-level visibility across the entire RAG pipeline, including retrieval, reranking, context assembly, and generation. Each span can capture inputs, outputs, latency, metadata, token usage, cost, and quality scores, enabling teams to identify whether a bad answer resulted from weak retrieval, poor ranking, missing context, prompt changes, or generation drift.
Braintrust's main strength is how production observability connects back to evaluation. The same scorers used during pre-deployment evals can run on live traffic, so regressions in groundedness, faithfulness, answer relevance, context precision, or context recall can be collected as regression datasets before the fix ships. Braintrust supports built-in scorers from autoevals, Ragas-style RAG metrics, and custom scorers in Python or TypeScript, helping teams start with standard quality checks and add domain-specific scoring as needed.
Debugging and iteration also remain within a single workflow. Engineers can inspect retrieved chunks, retrieval scores, reranker order, assembled prompts, model responses, and evaluation scores in one trace view, then use side-by-side comparisons across traces, prompts, models, or experiments to isolate the source of a regression. The Playground gives teams a place to compare prompt and retrieval changes before release.
Braintrust supports SDK-based tracing, auto-instrumentation, and OpenTelemetry, which helps teams instrument custom and framework-based RAG pipelines without building a custom logging layer. The bt setup CLI and Braintrust MCP server help engineers collect and query traces from environments such as Cursor, Claude Code, Windsurf, Claude Desktop, and VS Code. Brainstore keeps log queries responsive as production trace volume grows.
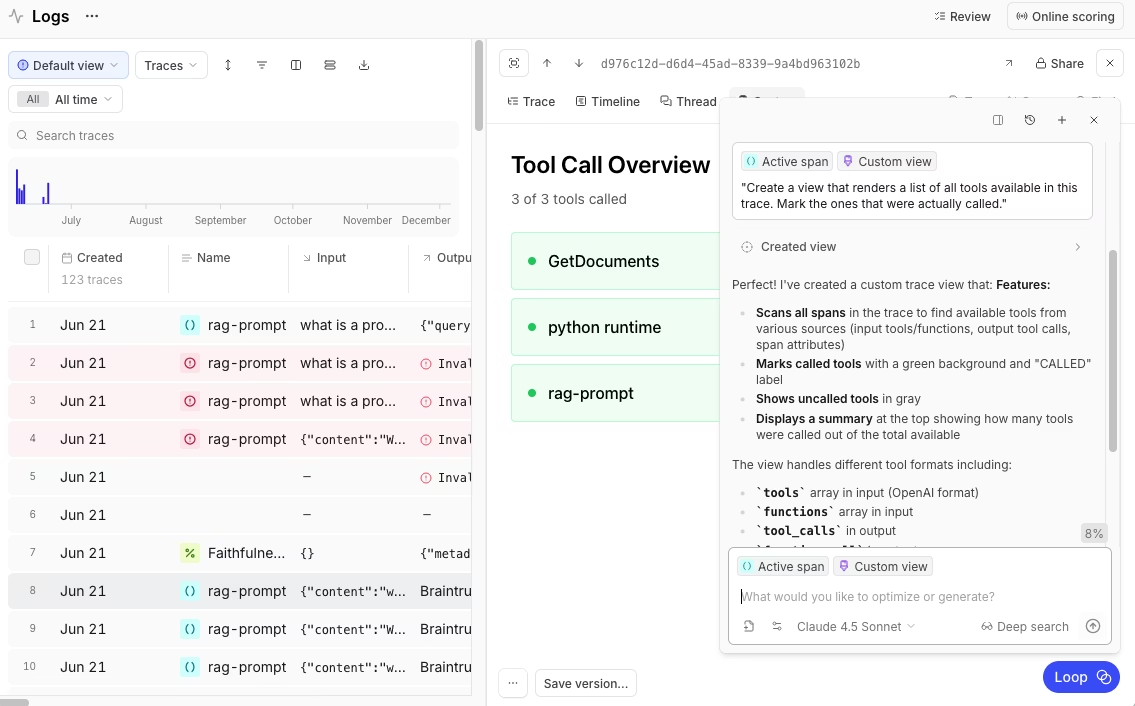
Loop helps team members generate test cases, run evaluations, and improve prompts based on recurring issues in production logs, using natural language. Topics surface repeated patterns across traces, so teams can see where RAG failures cluster without manually reviewing every log. Topics classification and the Loop agent run in the background rather than waiting on a dashboard query, so the RAG failures worth acting on surface across all traffic without running up the cost of scoring every trace.
Pros
- Connects production RAG traces to eval datasets, scorers, regression tests, and prompt experiments.
- Covers retrieval, reranking, context assembly, and generation in a single trace view.
- Supports RAG-specific scoring via autoevals, Ragas-style metrics, and custom-code scorers.
- Runs the same quality definitions across pre-deployment evals and live production traffic.
- Supports SDK-based instrumentation and OpenTelemetry for custom or existing observability stacks.
- Gives engineers side-by-side debugging across traces, prompts, models, and experiments.
- Connects trace debugging with Playground experiments, so prompt and retrieval changes can be compared before release.
- Includes Loop for generating test cases and improving prompts from observed production failures.
- Uses Topics to surface recurring patterns in production logs.
- Includes unlimited users on Starter and Pro, which supports collaboration across engineering, product, and domain experts without per-seat pricing.
Cons
- Managed-first deployment may not fit organizations that need self-hosting from the start.
- Advanced deployment, retention, access control, and privacy-sensitive data requirements are handled through Enterprise.
Pricing. The Starter plan is free and includes 1 GB of processed data, 10K scores, and unlimited users. Paid plans start at $249/month, with custom enterprise pricing available. See pricing details.
2. Arize Phoenix
Best for: Teams that need OSS and self-host with strong retrieval-debugging UX.
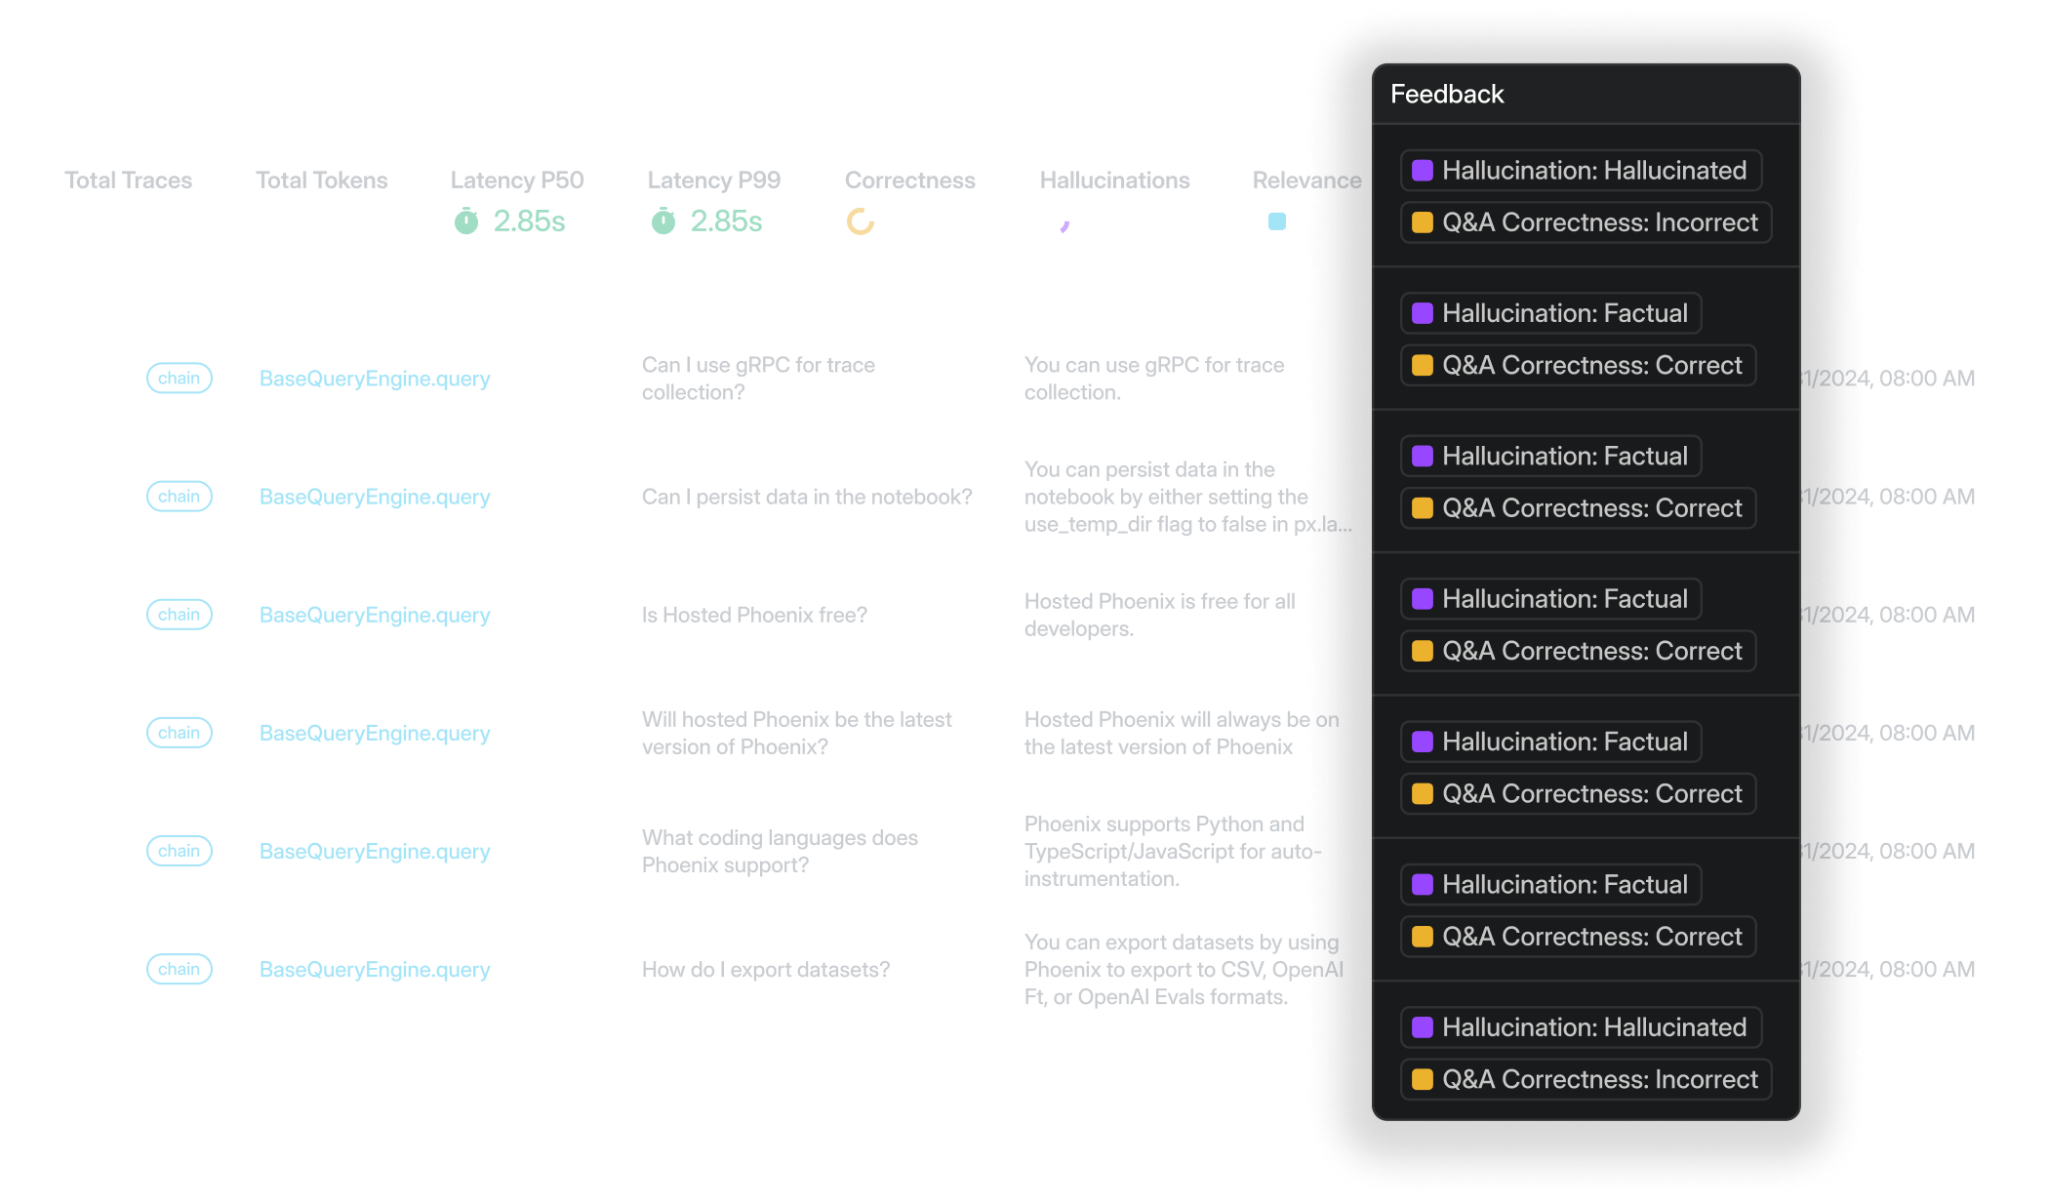
Arize Phoenix is an open-source observability tool built on OpenTelemetry and OpenInference. It supports tracing for LangChain, LlamaIndex, DSPy, Mastra, CrewAI, OpenAI Agents SDK, and Vercel AI SDK, and it can ingest spans from any OTLP-compatible source. For RAG pipelines, Phoenix captures retrieval and generation traces, supports LLM-as-judge evaluators for relevance, hallucination, Q&A correctness, and toxicity, and includes embedding visualization for analyzing retrieved chunks by semantic neighborhood.
Pros
- Open-source and self-hostable on Docker or Kubernetes.
- OpenTelemetry-native ingestion keeps trace data portable.
- Supports multiple RAG and agent frameworks through OpenInference.
- Embedding visualization helps analyze retrieval behavior across chunk clusters.
Cons
- Custom RAG scoring is less code-first than Braintrust.
- Production self-hosting requires managing Postgres-backed infrastructure.
- Teams that mainly need metric dashboards may not need the embedding-visualization workflow.
Pricing. Free for open-source self-hosting. Managed cloud at $50/month. Custom enterprise pricing.
3. Langfuse
Best for: Engineering teams that need OSS observability bundled with prompt management and evals.
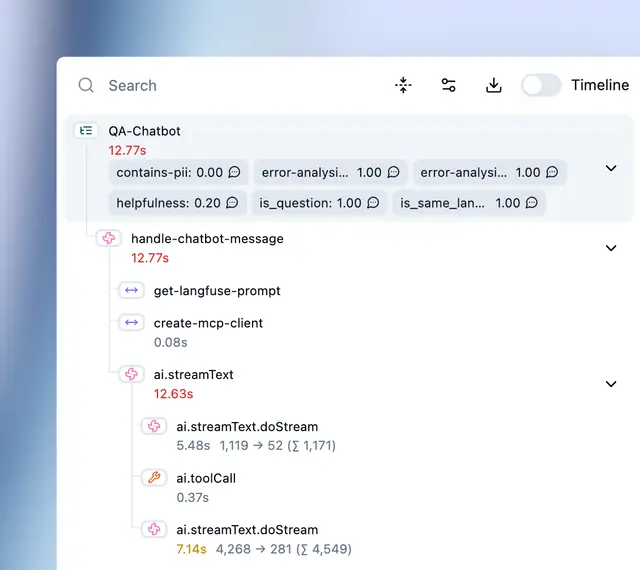
Langfuse is an open-source observability platform that combines tracing, prompt management, evaluations, and human annotation. Its hierarchical traces capture LLM calls, retrieval steps, embeddings, and tool invocations, with filtering and replay support for debugging. Langfuse integrates with OpenAI SDK, LangChain, LlamaIndex, LiteLLM, Vercel AI SDK, Haystack, and Mastra, and supports OpenTelemetry for stacks not covered by native integrations.
Pros
- Open-source and self-hostable.
- Self-hosted deployment uses the same codebase as Langfuse Cloud.
- Includes tracing, prompt management, evaluations, and annotation.
- Supports OpenTelemetry for custom instrumentation.
Cons
- RAG-specific debugging is limited.
- Production self-hosting requires ClickHouse, Postgres, Redis, and S3-compatible storage.
- Teams that need tighter eval-to-release workflows may need additional processes around Langfuse.
Pricing. Free self-hosting and a free cloud plan with 50K units per month. Paid plan starts at $29 per month.
4. Comet (Opik)
Best for: Teams that want open-source RAG tracing and evaluation, especially alongside Comet's broader ML experiment tracking.
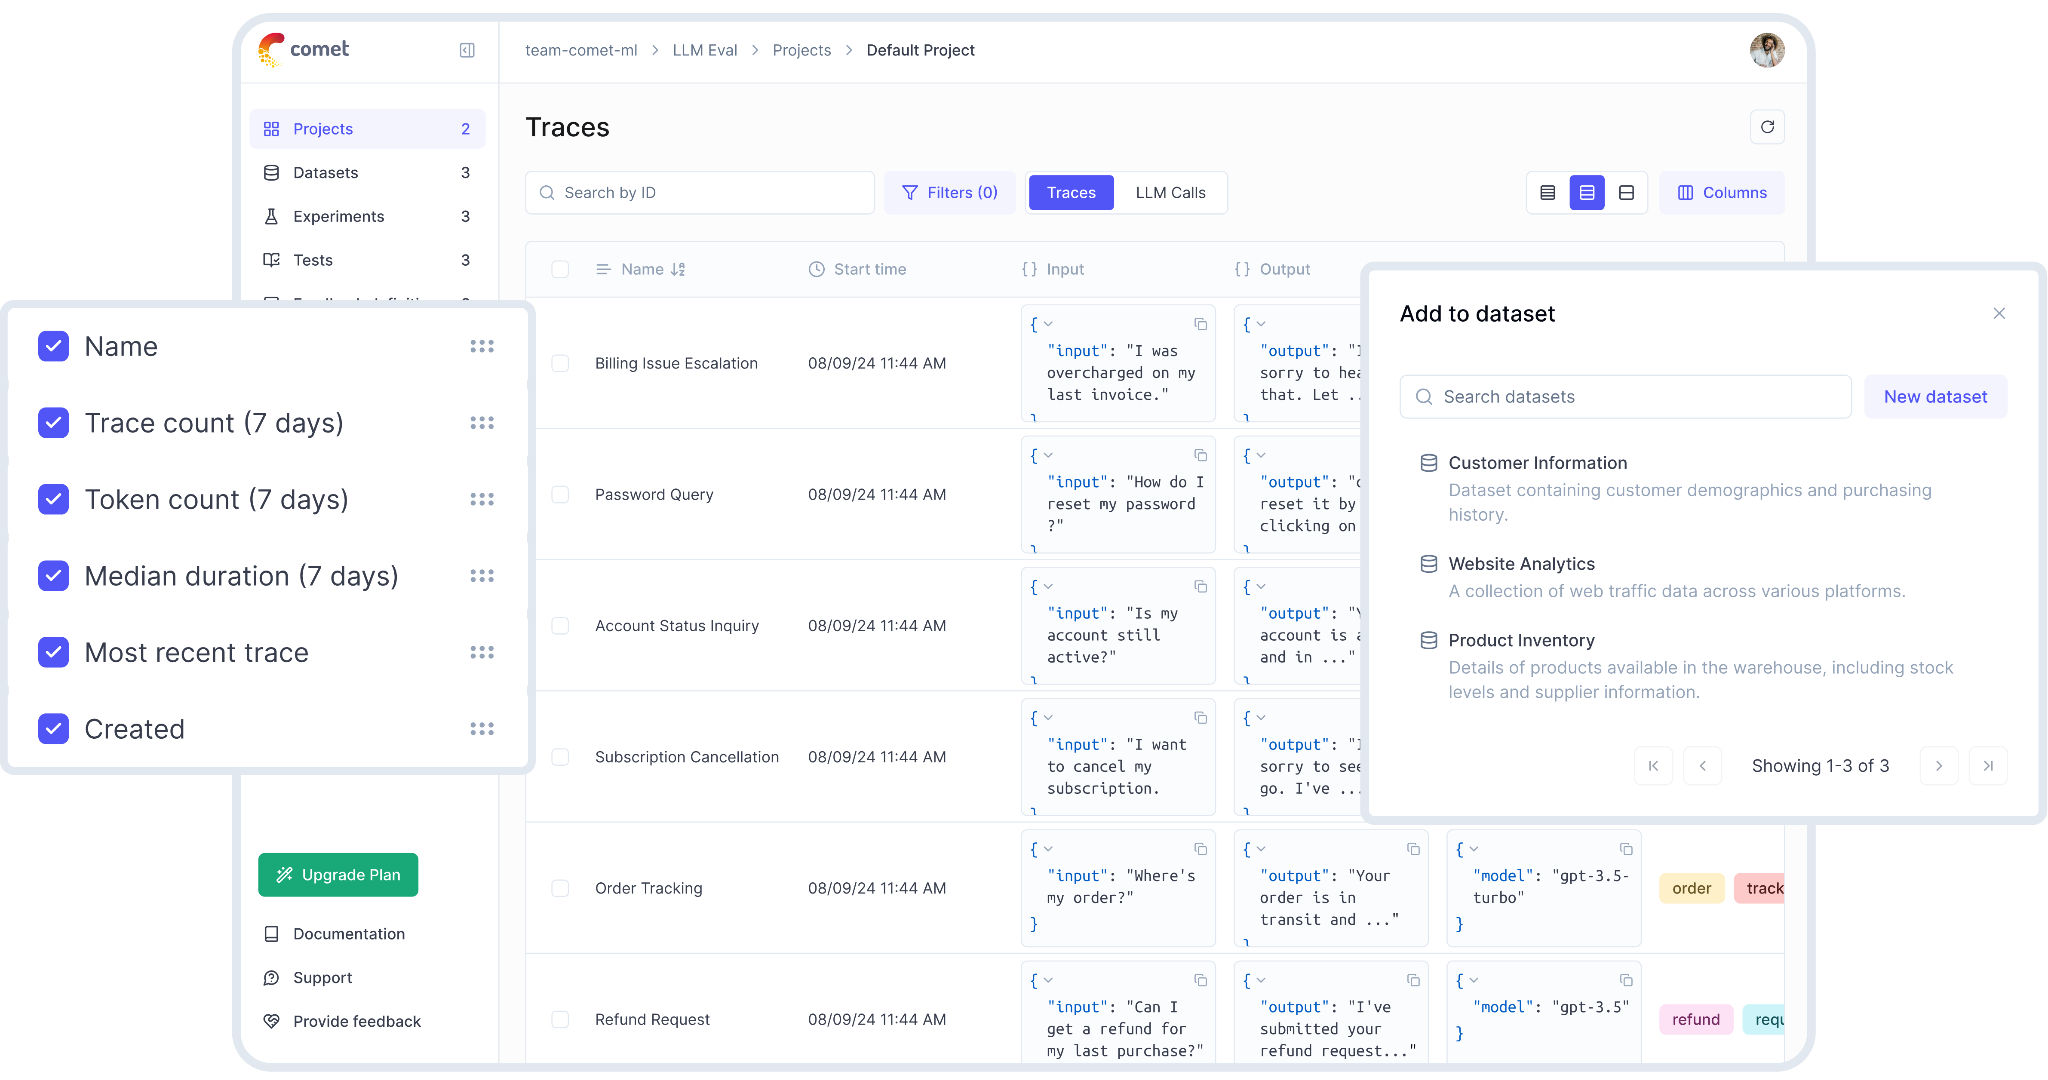
Comet (Opik) is an open-source LLM observability and evaluation platform tied to Comet's ML experiment management. For RAG pipelines, Opik records nested execution spans across retrieval, tool calls, and generation, and it includes built-in LLM-as-a-judge metrics for scoring traces. You instrument it with the Python SDK, the TypeScript SDK, or OpenTelemetry, and there are framework integrations for LangChain, LlamaIndex, and CrewAI. Opik also has PyTest-based CI integration for evaluation, plus guardrails for PII detection and content filtering. You can run it fully open-source and self-hosted, or on Comet's managed cloud.
Pros
- Open-source platform with end-to-end tracing and self-hosting support.
- Captures nested spans across retrieval, tool calls, and generation steps.
- Built-in LLM-as-a-judge metrics and PyTest integration for CI-oriented evaluation.
- Framework integrations for LangChain, LlamaIndex, and CrewAI, plus SDKs and OpenTelemetry.
Cons
- The best experience assumes teams are already using Comet's broader ML platform.
- RAG evaluation depth is lighter than dedicated AI quality platforms.
- LLM and ML priorities share the same broader product surface.
Pricing. Free open-source and self-hosting options. Cloud plan has a free tier, with paid plans starting at $19/month.
5. Galileo
Best for: Teams that want low-latency live scoring and runtime guardrails for RAG traffic.
Galileo provides production evaluation and guardrails for RAG applications through Luna-2, its small language model family for evaluation and scoring. RAG-related metrics include Context Adherence, Chunk Attribution, and Correctness. Galileo also supports Continuous Learning via Human Feedback, which uses annotated examples to tune metric behavior for a specific use case. Deployment options include SaaS, VPC, and on-prem for teams with stricter infrastructure requirements.
Pros
- Supports live scoring for RAG-specific metrics.
- Includes runtime guardrails for blocking, redacting, or overriding outputs.
- Uses annotated examples to tune metric behavior through CLHF.
- Supports SaaS, VPC, and on-prem deployment options.
Cons
- Custom scoring is more constrained than code-first platforms.
- Production-scale pricing is enterprise-led.
- Limited control over scorer implementation.
Pricing. Free tier with 5,000 traces/month. Paid plan starts at $100/month. Custom enterprise pricing.
Quick comparison: best RAG observability tools (2026)
| Capability | Braintrust | Arize Phoenix | Langfuse | Comet (Opik) | Galileo |
|---|---|---|---|---|---|
| Retrieval tracing | Full retrieval spans | Retrieval spans via OpenInference | Retrieval steps in traces | Retrieval steps in traces | RAG trace logging |
| Reranker or ranking trace support | Reranker spans when instrumented | Ranking flow through spans | Ranking steps when instrumented | Ranking steps when instrumented | RAG pipeline trace support |
| Generation tracing | LLM spans with inputs, outputs, latency, and cost | LLM spans and metadata | LLM calls, cost, latency, and tokens | LLM calls, cost, latency, and errors | Generation traces and outputs |
| Live groundedness or faithfulness scoring | Built-in and custom scorers | Phoenix evals | Online eval scores | Online evaluators | Context Adherence and related RAG metrics |
| Live retrieval-quality scoring | Context precision, recall, Ragas-style metrics, and custom scorers | RAG evals and retrieval analysis | Partial through custom scorers | Online evaluators with custom scorers | Context Precision, Precision@K, and Chunk Relevance |
| Quality trend monitoring | Logs, scores, charts, and Topics | AX monitors and custom metrics | Metrics dashboards | Monitoring and alerting | Production monitoring and alerts |
| Side-by-side regression comparison | Traces, experiments, prompts, and models | Partial through trace and eval review | Experiments and dashboards | Experiment comparison | Partial through evaluation views |
| Embedding visualization | Partial | Embedding and cluster analysis | Partial | Not a core feature | Partial |
| LangChain or LangGraph integration | Supported | Supported | Supported | Supported | Supported |
| LlamaIndex integration | Supported | Supported | Supported | Supported | Supported |
| OpenTelemetry support | Braintrust as OTEL backend | Native OTEL and OpenInference | Native OTEL SDKs | SDKs and OTEL ingestion | OTEL and SDK ingestion |
| Custom scorers | Code-first scorers in Python or TypeScript | Phoenix evals | Custom eval scores | LLM-as-judge metrics and custom evaluators | Partial within Galileo metric workflows |
| OSS or self-host option | Enterprise hosted, hybrid, or on-prem | Open-source self-host | Open-source self-host | Open-source self-host | Enterprise VPC or on-prem |
| Free tier | Starter with 1 GB processed data, 10K scores, and unlimited users | Free self-host and AX Free with 25K spans | Hobby with 50K units and 2 users | Free open-source and self-host, plus cloud free tier | Free plan with 5K traces |
| Auto-instrumentation | SDKs, bt setup, MCP, and OTEL | OpenInference and OTEL instrumentation | SDKs and OTEL | SDKs and OTEL | SDK and OTEL |
Start free with Braintrust and scale as production RAG volume grows →
Also read: Best AI observability platforms for LLMs.
Choosing the right RAG observability tool
The right RAG observability tool depends on how the team plans to connect production findings back to evaluation, debugging, and release decisions. Most tools on this list support retrieval and generation, but they differ in how much they support regression testing, custom scoring, self-hosting, and framework-specific setup.
Choose Braintrust when production RAG observability needs to connect directly with evals, prompt iteration, and regression testing. Braintrust is the strongest fit when live groundedness, faithfulness, context precision, or context recall regressions should become reusable eval cases before the next release. The managed-first deployment model works best for teams that do not need open-source self-hosting from day one.
Choose Arize Phoenix when open-source deployment and retrieval analysis are the main requirements. Phoenix fits teams that want OpenTelemetry-native tracing, OpenInference instrumentation, and embedding visualization for reviewing retrieval behavior across chunk clusters.
Choose Langfuse when the team wants open-source observability, prompt management, and evaluations in a single product. Langfuse supports hierarchical tracing for RAG workflows and OpenTelemetry, but organizations that need stronger eval-to-release control may need to build additional processes on top of the platform.
Choose Comet (Opik) when the team wants open-source RAG tracing and evaluation, especially if it already runs Comet for ML experiment tracking. Opik fits teams that value self-hosting, built-in LLM-as-a-judge metrics, and PyTest-based CI workflows, though its RAG evaluation is lighter than what dedicated AI quality platforms offer.
Choose Galileo when the primary requirement is live scoring and runtime guardrails for production RAG traffic. Galileo fits teams that want RAG metrics such as Context Adherence and Chunk Attribution, as well as guardrail actions to block, redact, or override outputs.
Why Braintrust is the best choice for production RAG observability
Production RAG observability is most valuable when live failures improve the next release. Braintrust connects production traces, eval datasets, scorers, Playground experiments, and regression checks, so a failed query can become an eval case and the fix can be tested against the same quality definitions before shipping.
Braintrust also provides RAG evaluation through a shared operating model that spans engineering, product, and domain experts. Engineers can debug failures in retrieval, context assembly, and generation in trace views, while non-engineering reviewers can help convert recurring issues into stronger eval coverage through Loop and review workflows.
Braintrust supports production AI teams at Notion, Stripe, Vercel, Zapier, Airtable, and Instacart. Notion increased issue triage from 3 issues per day to 30 after using Braintrust's observability and eval workflows.
Start free with Braintrust to turn production RAG traces into eval coverage before the next deployment.
FAQs: best RAG observability tools (2026)
Which is the best RAG observability tool?
Braintrust is the strongest RAG observability tool for production AI teams who want traces, evaluations, scorers, prompt experiments, and regression checks in a single workflow. It gives teams visibility across retrieval, reranking, context assembly, and generation, then connects production findings back to eval coverage. Phoenix, Langfuse, Comet (Opik), and Galileo are useful in specific environments, but Braintrust is the better fit when RAG quality needs to guide debugging and deployment decisions.
What's the difference between RAG observability and RAG evaluation?
RAG evaluation checks quality before deployment using test datasets, expected answers, and scoring criteria. RAG observability monitors live traffic, so teams can see whether retrieval quality, grounding, and answer relevance hold up after users interact with the system. Braintrust connects both sides by running shared scorers across evals and production traces, which helps teams turn live RAG failures into stronger test coverage.
Do I need both RAG observability and generic LLM observability?
For a pure RAG application, a strong RAG observability platform typically covers the generation-level signals tracked by generic LLM observability, such as latency, cost, token usage, errors, and model responses. Braintrust adds the retrieval and evaluation context that generic LLM monitoring tools miss, so teams can see whether an answer failed because of retrieval, ranking, prompt assembly, or generation. Applications that mix RAG with non-RAG LLM calls may still use generic LLM observability for those separate workflows.
How much overhead does RAG observability add to my pipeline?
Tracing overhead is usually limited when spans are batched and sent asynchronously. Live scoring adds more overhead when scores run inline before the response reaches the user, so production teams often score traces asynchronously after delivery. Braintrust supports that production pattern by collecting trace data first, then applying scorers, charts, and eval workflows without forcing every quality check into the user-facing request path.
Can I use a RAG observability tool with a custom (non-LangChain) RAG pipeline?
Braintrust, Phoenix, Langfuse, Comet (Opik), and Galileo can support custom RAG pipelines through SDKs, decorators, OpenTelemetry, or manual span logging. Braintrust is especially useful for custom pipelines because teams can instrument retrieval, reranking, context assembly, and generation while keeping custom scorers, eval datasets, and trace debugging connected to the same production data.