Tracking distributed tracing for AI agents: how to follow one request across services
One agent request can pass through an API service, a queue, a worker, and a remote tool service before the user receives an answer. To connect the recorded operations in one trace, each service must pass the parent span’s context to the next service, which uses it when creating its own spans. When context is lost at a service boundary, a failed tool call or slow background job can appear in a separate trace, making it harder to identify the request that triggered it.
Braintrust can export span context and use it as the parent of downstream spans, and it interoperates with OpenTelemetry for services that use different instrumentation. After configuring propagation, send a test request through every service and verify the span hierarchy, timing, and recorded inputs, outputs, and errors in the trace viewer. A connected trace lets engineers follow the request across service boundaries and locate the operation responsible for a failure or delay.
Start tracing agent requests across services with Braintrust for free →
Why agent traces break at service boundaries
Tracing within a service can work correctly even when the complete request is disconnected. In Python LLM tracing, Braintrust tracks the active span through context variables. A function decorated with @traced creates a child of the active span, and current_span() lets deeper functions add information without passing a span object through every call.
An HTTP request or queue message does not automatically carry the sending process’s active context. The caller must include trace context in the outgoing request or message, and the receiver must use it when opening its first span. Without propagation, the receiving service can record its work under a new root, separating it from the operation that triggered it. Applications using OpenTelemetry for LLM tracing also need context propagation between instrumented services.
Context can also be lost within a process. Python’s standard concurrent.futures.ThreadPoolExecutor does not automatically copy the context variables that Braintrust uses into its worker threads. A tool function may therefore produce a disconnected span even though it runs in the same service as the agent.
When reviewing a distributed request, look for the following symptoms.
Separate traces for one request: The API handler, worker, and tool service appear under different root_span_id values, even though they belong to the same execution.
Worker failures disconnected from the initiating call: A failed background job has its own error and duration, but its span has no parent connection to the request that scheduled it. Without a shared request identifier, finding the initiating request also becomes difficult.
Incomplete execution history: Expected operations are absent from the request’s trace. Check whether their spans started separate traces, whether each service sent its spans successfully, and whether the originating root span was recorded. Missing spans can indicate a delivery problem as well as lost parent context.
Trace context, span parents, and correlation IDs
Parent context tells a receiving service which span triggered its work, so the service can attach its own spans beneath it. Correlation IDs link related records across services for search, but matching IDs alone do not establish parent-child relationships or reconnect a split trace. Pass parent context across service boundaries and let the SDK manage the internal span_id and span_parents fields.
Record the application’s request ID in root-span metadata to find the request through log filters. When services might produce separate traces, record the same ID on each service’s entry span because metadata is not automatically inherited by child spans. Add subfield indexes for frequently searched metadata fields to reduce lookup time.
For tool executions, include tool_call_id and tool_name in the tool span’s metadata when available, following Braintrust’s tool-span metadata conventions. Recording both fields helps reviewers identify the requested tool and match its execution to the corresponding model output.
Propagating trace context across services
Pass trace context with the request or job data, then restore it before the receiving service starts instrumented work. Both sides must agree on the context format and where it is carried, whether in an HTTP header or a queue message field.
Exporting Braintrust span context over HTTP
The calling service exports its active span into a request header, and the receiving service uses the exported context as the parent of its handler span. In the Python example below, process_request sends the context and handle_request restores it before processing the request.
import requests
from braintrust import current_span, init_logger, start_span, traced

logger = init_logger(project="my-project")


# Client: Export the span
@traced
def process_request(request):
    return requests.post(
        "https://service-b.example/api/process",
        json=request,
        headers={"X-Trace-ID": current_span().export()},
    )


# Server: Resume the trace
def handle_request(req):
    trace_context = req.headers.get("X-Trace-ID")
    with start_span(parent=trace_context) as span:
        result = process_data(req.body)
        span.log(input=req.body, output=result)
        return result
The @traced decorator makes process_request the active span, which current_span().export() serializes into the outgoing header. On the server, start_span(parent=trace_context) creates a child span and makes it current within the with block, allowing traced functions and instrumented model calls to nest beneath the handler.
Both services must use the same header name. Although the example names the header X-Trace-ID, its value is the full exported span context, which also identifies the destination project or experiment. A bare request ID in that header would leave the receiving service without the parent span it needs to attach its work.
The example shows the client and server portions together. To integrate them into separate services, import requests on the client, use the receiving service’s absolute URL, and connect handle_request and process_data to the server’s request handling and application logic.
W3C traceparent headers for cross-service tracing
For services that use W3C Trace Context, the Braintrust TypeScript SDK provides injectTraceContext() to add traceparent and baggage headers to an outbound request. The receiver calls extractTraceContextFromHeaders() and passes the returned context to traced() as its parent. Python services can use OpenTelemetry propagators with Braintrust’s linking helpers.
Gateways and proxies must preserve the propagation headers for the receiver to recover the parent context. When no valid traceparent arrives, the TypeScript extraction helper returns undefined, and a request handler without an active parent starts a new root. The application may continue serving requests successfully even though its traces have become disconnected.
Trace context in queues and background jobs
Export the active span when enqueuing a job and store the resulting string alongside the job data. The worker reads the stored context before starting its processing span and passes it to start_span(parent=...). Keeping the context in the message lets the worker recover the parent relationship even when processing begins after the producer has finished.
Trace context can travel through message queues or gRPC metadata, provided the transport preserves it and the consumer uses the matching propagation method. TypeScript workers can use withParent() to run a callback under an exported parent, attaching spans created inside the callback to the originating trace.
Async handoffs, parallel tool calls, and retries
Background jobs can outlive the request handler, and concurrent tools or repeated attempts can create several execution paths from one agent step. Preserve the originating parent context and give each operation its own span so its timing and outcome remain visible.
Deferred and long-running work
Because the parent context travels with the job, the worker's span still attaches to the originating trace after the request handler returns. That span records its own execution time, output, and errors even though the originating span has already ended.
For a late-arriving field that belongs on an existing span, such as an asynchronously collected output, use update_span(). Flush the original span before updating it to prevent overlapping writes from overwriting fields. Alternatively, log the late work as a separate child span, which leaves the original record untouched and also captures the work required to produce the result.
Record enqueue and processing-start timestamps to measure queue wait time. A gap in the trace timeline can help locate a delay, but attributing the entire gap to the queue requires accounting for dispatch overhead and clock differences between services.
Parallel tool calls and thread pools
Braintrust’s TracedThreadPoolExecutor copies Python context variables into worker threads, keeping concurrent traced functions attached to their parent. The example below submits two functions from the active main span and waits for both results.
import os

import braintrust
import openai

braintrust.init_logger("math")


@braintrust.traced
def addition(client: openai.OpenAI):
    return client.responses.create(
        model="gpt-5-mini",
        input="What is 1+1?",
    )


@braintrust.traced
def multiplication(client: openai.OpenAI):
    return client.responses.create(
        model="gpt-5-mini",
        input="What is 1*1?",
    )


@braintrust.traced
def main():
    client = braintrust.wrap_openai(openai.OpenAI(api_key=os.environ["OPENAI_API_KEY"]))
    with braintrust.TracedThreadPoolExecutor(max_workers=2) as executor:
        addition_future = executor.submit(addition, client=client)
        multiplication_future = executor.submit(multiplication, client=client)
        addition_future.result()
        multiplication_future.result()


if __name__ == "__main__":
    main()
The addition and multiplication spans appear as siblings beneath main, with each model call nested under its corresponding function. Parallel tools should preserve the same parent-child structure so reviewers can inspect each call independently and see where their execution overlaps.
Retries and repeated tool calls
A tool span that records only the final successful result can hide earlier failures and the time spent retrying. For example, a request may succeed after an HTTP 429 response, but the trace needs to capture the failed attempt and backoff to explain the added delay.
Create a separate span for each attempt, preserving its error, duration, and attempt number. Retries that happen inside a tool implementation belong beneath the tool span, with HTTP or function spans for the operations performed. A repeated request from the agent is a different case, since the model has issued a new tool call, so record it as a new tool execution with the corresponding tool_call_id.
For queue redelivery, create a new processing span using the parent context retained in the message. Keeping a stable job ID and a separate attempt number makes repeated deliveries distinguishable within the originating trace.
Linking Braintrust and OpenTelemetry spans
An agent application may use the Braintrust SDK while a remote tool service uses OpenTelemetry. Combining their spans in one trace requires shared context within each process and context propagation between services. Configure both services to send their spans to Braintrust before testing the parent-child connection. The following snippets show propagation logic to add to services with a configured OpenTelemetry tracer provider, Braintrust exporter, and W3C trace-context and baggage propagators.
In Python, set BRAINTRUST_OTEL_COMPAT=true before importing Braintrust to share active context between the two SDKs. Install braintrust[otel] v0.3.5 or later to pass trace context between Braintrust and OpenTelemetry services using the Python examples below. Each example shows the sending and receiving code together, with the request supplied by the receiving service’s HTTP framework.
Braintrust parent span to OpenTelemetry child
The calling service exports its Braintrust span and sends the result in an HTTP header. The receiving service converts the exported string with context_from_span_export() and attaches the resulting OpenTelemetry context before starting its span.
import braintrust
import requests
from braintrust.otel import context_from_span_export
from opentelemetry import context as otel_context
from opentelemetry import trace

# Service A: Create a Braintrust span and export its context
project = braintrust.init_logger(project="my-project")

with project.start_span(name="service_a") as span:
    exported = span.export()
    requests.post(
        "https://service-b.example/api",
        headers={"x-braintrust-context": exported},
    )


# Service B: Receive the request and create an OTel child span
def handle_request(request):
    exported = request.headers.get("x-braintrust-context")
    ctx = context_from_span_export(exported)
    token = otel_context.attach(ctx)

    try:
        tracer = trace.get_tracer(__name__)
        with tracer.start_as_current_span("service_b"):
            # This span is now a child of the Braintrust span.
            pass
    finally:
        otel_context.detach(token)
The finally block restores the previous context even when the receiving operation fails. Keeping context attachment scoped to the handler prevents later work from accidentally using the completed request’s parent.
OpenTelemetry parent span to Braintrust child
When the caller uses OpenTelemetry, add_span_parent_to_baggage() copies the span’s braintrust.parent attribute into baggage for propagation. Configure BraintrustSpanProcessor so that attribute is present. The caller then injects the outgoing headers, and the receiving service uses parent_from_headers() to recover the parent for its Braintrust span.
import braintrust
import requests
from braintrust.otel import add_span_parent_to_baggage, parent_from_headers
from opentelemetry import context as otel_context
from opentelemetry import trace
from opentelemetry.propagate import inject

# Service A: Create an OTel span and export headers
tracer = trace.get_tracer(__name__)

with tracer.start_as_current_span("service_a") as span:
    # Add Braintrust parent information to baggage for propagation.
    token = add_span_parent_to_baggage(span)
    if token is None:
        raise RuntimeError("The OpenTelemetry span is missing braintrust.parent")
    try:
        headers = {}
        inject(headers)
        requests.post("https://service-b.example/api", headers=headers)
    finally:
        otel_context.detach(token)

# Service B: Receive the request and create a Braintrust child span
project = braintrust.init_logger(project="my-project")


def handle_request(request):
    parent = parent_from_headers(request.headers)
    with project.start_span(name="service_b", parent=parent):
        # This span is now a child of the OTel span.
        pass
Initialize project as a Braintrust logger in the receiving service, and configure the sender’s OpenTelemetry exporter and propagators to send spans and carry both trace context and baggage. When the Braintrust parent is available as a string, such as project_name:my-project, use add_parent_to_baggage(parent) to add that value.
For services sending spans through an OTLP exporter, the x-bt-parent export header can contain a project or experiment destination, or an exported span string that attaches the exported trace beneath an existing Braintrust span. A fixed project destination routes spans into the project without establishing a request-specific parent.
ID format compatibility across Python and TypeScript
Python SDK v0.26.0 and later exports OpenTelemetry-compatible IDs by default and can read both supported formats. The TypeScript SDK uses the legacy ID and export format by default. Passing exported context between services with incompatible settings can therefore break the parent-child link between their spans.
Enable setupOtelCompat() in TypeScript before creating loggers or spans to read either format and export the OpenTelemetry-compatible format. To retain legacy exports across both services, set BRAINTRUST_LEGACY_IDS=true in Python.
Python’s default ID format does not automatically enable active-context sharing. Set BRAINTRUST_OTEL_COMPAT=true when Braintrust and OpenTelemetry instrumentation also need to share the current span within the Python process.
Verifying distributed agent traces
To verify that a request stays connected across services, send a test request through the full workflow and record a distinctive request ID on the spans at each service boundary. Let every process flush its logs, then open the result in the Braintrust trace viewer. Check that the downstream operations appear under their intended parents and contain the data needed to investigate a failure.
Trace continuity checks in Braintrust
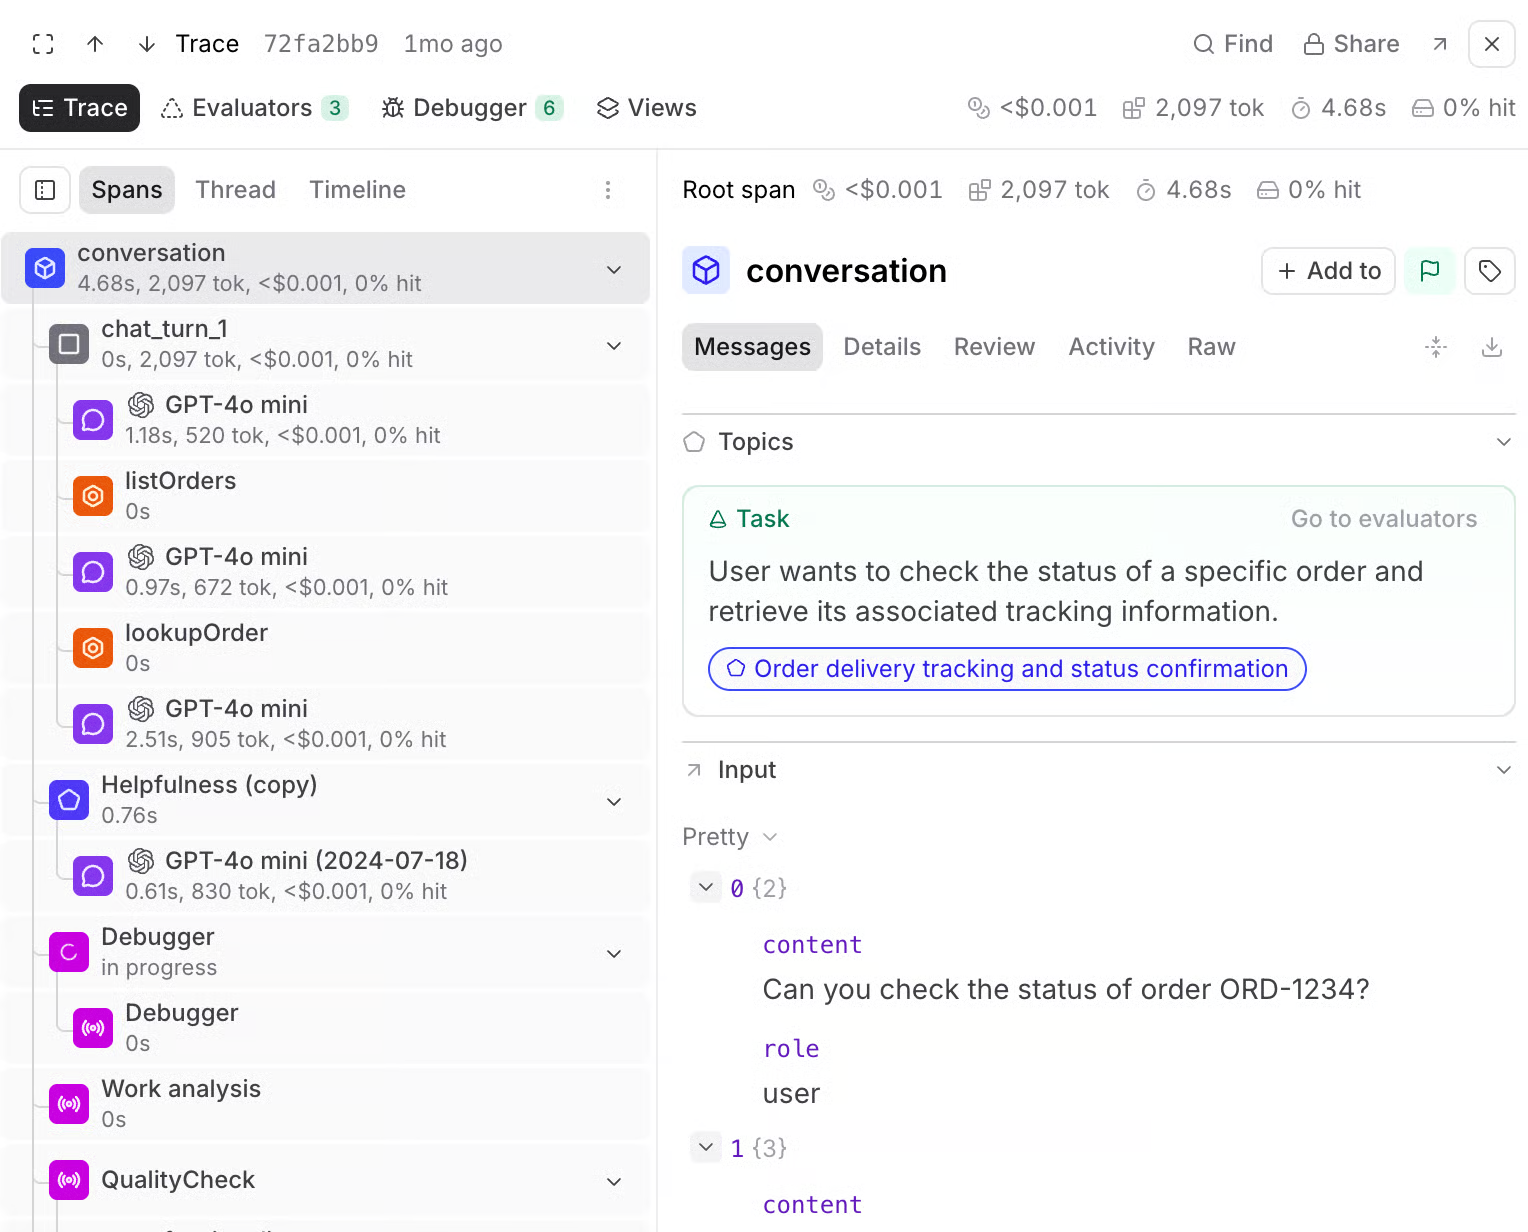
Inspect parent-child relationships in the Spans layout, then select individual spans to check their logged data.
Estimated cost is a second way to check whether remote model calls landed in the originating trace. A parent’s displayed cost includes its descendants’ costs and any cost logged directly on the parent. If a remote model call appears in a separate trace, its cost will be absent from the originating trace’s total. A lower total alone does not establish a propagation failure, since missing cost data can produce the same symptom.
Common causes of disconnected traces
-
Missing root span: Braintrust’s logs table displays traces that include a root span. If the originating service never sends its root, exported child spans alone will not appear as a trace in the list. Ensure the service where the request begins sends its spans to Braintrust.
-
Dropped or unread context: A gateway may strip the propagation header, or a worker may receive the context without reading it. Confirm that the receiving handler extracts the context and uses it when creating its first span. Without a supplied or active parent, that span starts a new trace.
-
Mismatched ID formats: Check the compatibility settings when Python and TypeScript services exchange exported context. Enable
setupOtelCompat()in TypeScript for OpenTelemetry-compatible exports, or setBRAINTRUST_LEGACY_IDS=truein Python when both services need legacy exports. -
Context lost in thread pools: Python’s standard
ThreadPoolExecutordoes not automatically carry the submitting thread’s context variables into its workers. UseTracedThreadPoolExecutorto preserve the active parent for pooled work. -
Manual spans that are not current: In TypeScript,
startSpan()creates a span without making it current. Wrap operations that rely on the active parent inwithCurrent()so their spans nest beneath it. -
Workers that exit before flushing: Buffered span data can be lost when a worker exits before sending it. Python registers an
atexitflush hook by default. IfBRAINTRUST_DISABLE_ATEXIT_FLUSH=1disables that hook, calllogger.flush()during cleanup and check for logging failures.
Visibility limits for third-party tools and APIs
When a third-party API, hosted model provider, or external MCP server exposes no telemetry, your trace can capture only what your application observes during the call. The client-side span can record the outgoing request, the returned response or error, elapsed time, and available provider request IDs. Passing trace context to the provider does not reveal its internal processing unless the provider supports propagation and makes its spans available.
To explain time spent within your own integration code, instrument operations such as authentication refreshes, HTTP requests, and retry attempts beneath the tool span. Separate spans help identify whether a slow tool call spent time preparing authentication, waiting for a response, or retrying a failed request. Operations inside the provider remain outside your visibility.
When an external platform exposes logs or traces without joining your trace, record an identifier available in both systems. This could be a request ID you pass to the platform or a provider-generated ID returned with the response. Store it on the Braintrust tool span so an engineer can locate the corresponding provider record. A shared identifier supports that lookup but does not establish a parent-child span relationship.
A batch operation can serve several agent requests, so its relationship to those requests may not fit a single parent-child tree. Braintrust supports spans with multiple parents in its underlying trace data, but the trace viewer displays a single root. Record a shared batch ID on the batch operation and each participating request so engineers can find the related work across traces.
Investigate and validate distributed agent fixes with Braintrust
A distributed trace can show where a request went wrong, but validating the fix requires a reproducible test and a clear definition of success. Use the failed request to guide the investigation, then check the corrected behavior before and after deployment.
Step 1. Connect the observed failure to its cause
Start with what went wrong for the user, such as an incorrect answer, a failed tool action, or an excessive delay. Follow the affected request to the operation responsible and inspect its inputs, outputs, errors, and timing. For long project log traces, the Debugger can suggest likely causes with supporting span evidence.
Review the evidence before deciding what to change. A tool timeout might require a service fix, an incorrect tool argument a prompt change, and a missing worker span a propagation fix. Save the relevant span’s permalink with the issue so reviewers can inspect the same request.
Step 2. Create a reproducible test case
Promote the relevant log span to a dataset, choosing the input for the component being tested. A tool-level test needs the tool arguments and relevant service state; an agent-level test needs the user request and any conversation or retrieved context required to reproduce the decision.
Review the dataset's expected value before saving the case and replace it with the intended result, since the failed output may have been copied into that field. When the failure depends on a timeout, unavailable service, or changing external data, reproduce that condition in the test setup, because a saved request does not recreate the condition on its own.
Step 3. Define and run the correctness check
Choose a scorer that measures the behavior the fix should change. An incorrect tool argument can be scored by comparing the generated value with the expected one, while a failed service call needs a check on whether the application handles the error as intended. When the acceptable result is still unclear, send the case to human review.
Evaluate the original and updated implementations against the same dataset and scoring rules. Include existing cases alongside the new failure case, then inspect regressions and changes in latency or cost before selecting the update.
Step 4. Verify the deployed request across services
After deployment, send a controlled request through the affected API, worker, and tool service. Confirm that the intended behavior succeeds, then check that the spans appear under the correct parents, since an application-level correctness score cannot show whether context survived every service boundary.
Configure online scoring to evaluate the relevant production behavior, using logged fields that contain the evidence the scorer needs. Add newly discovered failures to the dataset so subsequent releases are checked against a growing set of real operating conditions.
Start free with Braintrust and validate fixes across your agent services →
FAQs about distributed tracing for AI agents (2026)
What is distributed tracing for AI agents?
Distributed tracing follows one agent request across model calls, tool executions, workers, and services. Each operation becomes a span linked to the request, so engineers can inspect execution order, timing, errors, and recorded data across service boundaries.
How is a trace ID different from a correlation ID?
A trace ID identifies one connected execution in the tracing system. A correlation ID comes from the application and represents a business object such as an order, session, or job. One correlation ID can be associated with several traces when the same session or job triggers multiple requests.
Can Braintrust and OpenTelemetry spans appear in the same trace?
They can when the services exchange compatible trace context. Braintrust’s OpenTelemetry helpers support propagation between Braintrust spans and W3C trace context, and compatibility settings allow both SDKs to share the active span inside a process.
Why do my worker spans show up as separate traces?
The worker probably created its first span without the parent context from the originating request. Check that the queue message or job payload includes the exported span context or the required traceparent and baggage headers, and that the worker reads it before starting its outermost span.
Does trace context propagation work with message queues?
Message queues can carry trace context through message attributes, headers, or payload fields. The consumer must extract the stored context and use it when creating the processing span. Retries can remain connected when they reuse the original parent context.
How do I trace a third-party API that exposes no telemetry?
Create a client-side tool or function span around the outbound call and record the relevant request details, response or error, duration, and provider request ID. The client-side span shows how your application interacted with the service, but it cannot reveal processing inside the provider.