Claude API responses alone cannot explain why a request was slow or produced an unexpected result. A trace records the request, response, execution timing, and token usage of each call and keeps them for review after the call completes. Connecting Claude calls to application context also helps identify which user request triggered them.
Braintrust's Anthropic integration supports automatic instrumentation and manual client wrapping to capture Claude API calls. The resulting traces in Braintrust show request details alongside production behavior, including streaming latency and prompt-cache usage when the SDK reports them.
Start free with Braintrust to trace Claude API calls and inspect production requests →
Claude API tracing prerequisites
Tracing Claude API calls requires an Anthropic API key, a Braintrust API key, and a Braintrust project to receive the logs. Your application continues sending requests directly to Anthropic, while Braintrust records the instrumented calls in the project specified during logger initialization.
1. Check SDK compatibility
Braintrust supports Anthropic tracing across TypeScript, Python, Ruby, Go, Java, and .NET. This tutorial focuses on Python and TypeScript, which require the following minimum Anthropic SDK versions:
| Language | Package | Minimum version |
|---|---|---|
| Python | anthropic | 0.48.0 |
| TypeScript | @anthropic-ai/sdk | 0.60.0 |
For Ruby, Go, Java, and .NET, check the minimum SDK versions and supported instrumentation methods in Trace LLM calls before proceeding with setup.
TypeScript auto-instrumentation uses Node.js's --import flag, which requires Node.js 18.19.0+ or 20.6.0+. Applications using bundlers such as Next.js, Vite, or Webpack need the corresponding Braintrust integration.
2. Install the required packages
Install the Braintrust SDK alongside the Anthropic SDK in your existing application.
Python
pip install braintrust anthropic
TypeScript
pnpm add braintrust @anthropic-ai/sdk
3. Configure API keys
Set both credentials in your application's environment. You can generate a Braintrust API key under Settings > Organization > API keys.
export ANTHROPIC_API_KEY="your-anthropic-api-key"
export BRAINTRUST_API_KEY="your-braintrust-api-key"
ANTHROPIC_API_KEY authenticates Claude requests, while BRAINTRUST_API_KEY allows the Braintrust SDK to send trace data to your project.
Organizations using Braintrust's EU data plane or a self-hosted deployment must also configure BRAINTRUST_API_URL with the appropriate data plane endpoint.
Optional: connect Anthropic as an AI provider
Direct SDK tracing works without adding Anthropic as a provider in Braintrust. A separate provider connection is required when you want to call Claude through the Braintrust playground, API, or gateway.
To configure the connection, go to Settings > AI providers, select an organization-level or project-level provider, and choose Anthropic. Enter your Anthropic API key and save the configuration. Organization-level providers are available across projects, while project-level providers are limited to the selected project.
Anthropic SDK instrumentation options
Choose between two instrumentation methods for Claude API calls:
Auto-instrumentation patches the Anthropic SDK at startup and is the recommended option for most applications.
Manual instrumentation wraps individual client instances, so only the clients you wrap produce traces.
Auto-instrumentation for Python and TypeScript
Auto-instrumentation allows existing Claude requests to generate traces without adding a wrapper around every client. The setup differs slightly between Python and TypeScript.
Python
Initialize Braintrust and call auto_instrument() before creating the Anthropic client. If your code imports the client class directly with from anthropic import Anthropic, call auto_instrument() before that import when possible. The following example sends a Claude Messages API request and records the call in the specified Braintrust project.
import os

import anthropic
from braintrust import auto_instrument, init_logger

logger = init_logger(project="My Project")
auto_instrument()

client = anthropic.Anthropic(api_key=os.environ["ANTHROPIC_API_KEY"])

try:
    result = client.messages.create(
        model="claude-sonnet-4-5-20250929",
        max_tokens=1024,
        messages=[{"role": "user", "content": "What is machine learning?"}],
    )
finally:
    logger.flush()
The same setup also captures streaming requests made with messages.stream() and structured-output requests made with messages.parse() on Anthropic SDK versions that expose that method.
TypeScript
Initialize the Braintrust logger alongside your existing Anthropic client. The import hook instruments the SDK at startup, so existing messages.create() calls generate traces with no changes at the call site. The following example shows the application setup and the command needed to run it.
const logger = initLogger({
  projectName: "My Project",
  apiKey: process.env.BRAINTRUST_API_KEY,
});

const client = new Anthropic({ apiKey: process.env.ANTHROPIC_API_KEY });

async function main() {
  try {
    const result = await client.messages.create({
      model: "claude-sonnet-4-5-20250929",
      max_tokens: 1024,
      messages: [{ role: "user", content: "What is machine learning?" }],
    });
  } finally {
    await logger.flush();
  }
}

main().catch((error) => {
  console.error(error);
  process.exitCode = 1;
});
Run the file with the import hook.
node --import braintrust/hook.mjs trace-anthropic-auto.js
The hook runs JavaScript files directly. TypeScript projects compile first and run the compiled output with the same --import flag.
Manual client wrapping with wrap_anthropic and wrapAnthropic
Manual instrumentation is useful when an application needs to trace selected Anthropic clients or cannot use startup auto-instrumentation. Wrap each client instance that should produce traces, then continue calling the Messages API through the wrapped client.
Python
import os

import anthropic
from braintrust import init_logger, wrap_anthropic

logger = init_logger(project="My Project")
client = wrap_anthropic(anthropic.Anthropic(api_key=os.environ["ANTHROPIC_API_KEY"]))

try:
    result = client.messages.create(
        model="claude-sonnet-4-5-20250929",
        max_tokens=1024,
        messages=[{"role": "user", "content": "What is machine learning?"}],
    )
finally:
    logger.flush()
TypeScript
const logger = initLogger({
  projectName: "My Project",
  apiKey: process.env.BRAINTRUST_API_KEY,
});
const client = wrapAnthropic(
  new Anthropic({ apiKey: process.env.ANTHROPIC_API_KEY }),
);

async function main() {
  try {
    const result = await client.messages.create({
      model: "claude-sonnet-4-5-20250929",
      max_tokens: 1024,
      messages: [{ role: "user", content: "What is machine learning?" }],
    });
  } finally {
    await logger.flush();
  }
}

main().catch((error) => {
  console.error(error);
  process.exitCode = 1;
});
Anthropic tracing in other languages
Ruby, Go, Java, and .NET each use a different instrumentation method, and .NET currently has no auto-instrumentation option.
Flush traces before exiting: Short-lived scripts and batch jobs should call logger.flush() before the process exits to ensure buffered spans reach Braintrust. In TypeScript, await logger.flush() during cleanup so pending writes complete.
What Braintrust records for each Claude API call
Once instrumentation is configured, supported Claude API calls generate LLM spans in Braintrust. Each span stores the request and response alongside operational metrics, so an unexpected output or a jump in latency or cost can be traced back to the exact call that produced it.
Span names and request fields
A standard Claude Messages API call appears under the span name anthropic.messages.create. The recorded fields provide the information needed to reconstruct the model interaction:
-
Input: The messages and system prompt sent to Claude.
-
Output: Claude's response content, including any tool-use requests returned by the model.
-
Request parameters: The model and generation settings, including
max_tokensand other parameters supplied by the application. -
Stop reason: The reason Claude stopped generating, such as
end_turn,max_tokens, ortool_use. A response ending withmax_tokensindicates that generation reached the configured output limit. -
Stop sequence: The custom stop sequence that ended generation, when applicable.
Braintrust displays the messages in the trace viewer and exposes request parameters through the Details tab. The Raw tab provides the underlying JSON when developers need to verify an exact field value.
Token usage, latency, and cost metrics
Braintrust records total input tokens as prompt_tokens, including cache reads and writes, and output tokens as completion_tokens. Cache counters break down input usage; do not add them to prompt_tokens again. Tracking both values helps developers determine whether a request's token consumption comes from the supplied context or Claude's generated response.
Each span also records execution timing and, when model pricing and usage data are available, an estimated LLM cost. In applications that make multiple Claude calls, Braintrust rolls child-span costs up to the parent span, so each trace shows the cost of a single call and the full request cost. The LLM token usage guide provides additional guidance on attributing usage across multi-step applications.
Application identifiers and request metadata
The Anthropic integration captures the model interaction, but the SDK cannot automatically know which application, user, or feature initiated it. Developers must supply the relevant context to make Claude traces useful for investigating individual customer requests.
The most practical way to attach application metadata is to create a parent span at the request entry point and record identifiers when the request begins. In Python, logger.start_span() accepts metadata and tags at creation. TypeScript provides the equivalent through logger.traced() with event: { metadata, tags }. Instrumented Claude calls executed within the active parent span become part of the same trace.
For values discovered during execution, such as a retrieved document ID or routing decision, span.log() adds metadata to the active span. Store identifiers that developers need to filter or group by as top-level metadata fields. For example, metadata.user_id makes it possible to retrieve a customer's recorded requests without searching through message content.
Streaming Claude responses: time to first token vs. total duration
Streaming lets Claude deliver response content incrementally, so users can start reading before generation finishes. Braintrust collects the streamed chunks into a single LLM span and records the completed response alongside two latency measurements. Both are needed to understand whether a request was slow to begin responding or took a long time to finish.
Time to first token: The time_to_first_token metric measures initial streaming latency. Its exact boundary depends on the integration: the Python Anthropic wrapper records the first stream event, which can precede visible text. A high value indicates a slower start to the stream. Braintrust records the metric for supported streaming calls, which separates a slow start from slow generation.
Total duration: Span duration measures the elapsed time across the request through the end of the stream. A response that begins quickly may still take several seconds to finish, particularly when Claude generates a lengthy answer.
Interpreting both metrics: When time to first token is high and completion is short, output length is unlikely to explain the wait, pointing to a delay before generation started. When the first token arrives quickly, but total duration is long, compare the duration with completion_tokens to determine whether output length contributed to the delay. Neither measurement establishes the underlying cause on its own, but comparing them helps narrow the investigation.
View streaming latency in Braintrust
Time to first token is hidden by default in the trace viewer. Open the trace in the Spans layout, select the three-dot menu (⋮), and choose Display metric types. Enable Time to first token to display the metric alongside duration and other span metrics. Use streaming calls when interpreting this as initial response latency. Some SDK paths also populate time_to_first_token for non-streaming calls with the time until the full response arrives.
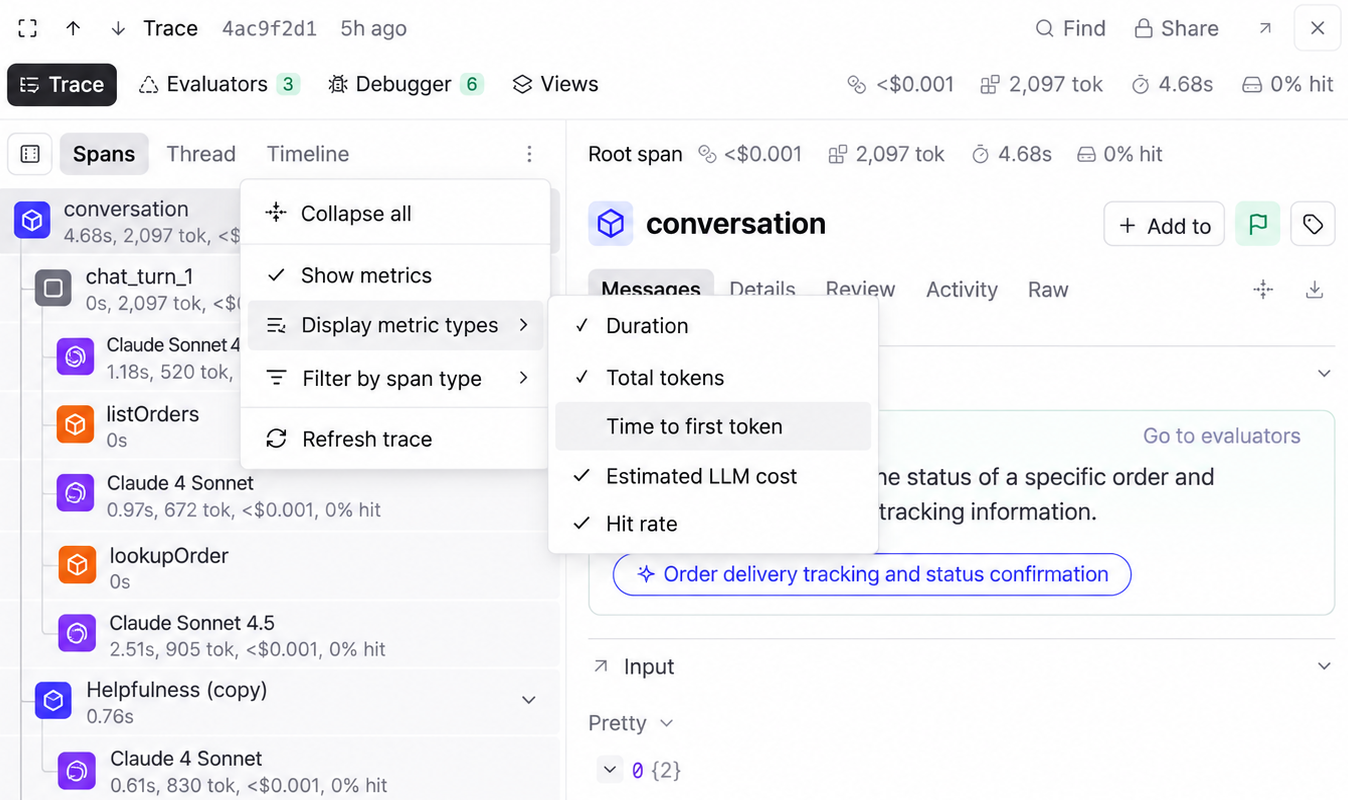
Enable Time to first token in the Spans layout to compare initial response latency with total duration.
Prompt caching and server tool usage in Claude traces
Claude's response includes usage data beyond standard input and output tokens when prompt caching or server-side tools are used. Braintrust records these provider metrics on the corresponding LLM span, where they show how much of a request came from cache and whether Claude ran server-side tools. Metric availability depends on the Anthropic SDK integration.
Prompt cache read and write tokens
Anthropic's provider prompt caching reuses previously processed prompt prefixes across requests. Applications can mark reusable content, such as a system prompt or tool definitions, with cache_control. Subsequent requests can reuse the cached prefix when the content matches and the cache entry remains valid.
Braintrust records two primary metrics for examining Claude's cache activity:
-
Cache reads:
prompt_cached_tokensrecords tokens retrieved from Anthropic's cache, corresponding tocache_read_input_tokensin the provider response. -
Cache writes:
prompt_cache_creation_tokensrecords tokens written to the cache, corresponding to Anthropic'scache_creation_input_tokens. Where the SDK exposes the breakdown, additional metrics distinguish writes using the five-minute and one-hour cache durations.
A correctly configured cache may show writes on the first eligible request and reads on subsequent requests. Repeated writes with few or no reads can indicate that the reusable prefix changes between requests or that the cache entry expires before reuse. Cache eligibility and the provider's minimum cacheable prompt length also affect the results.
Inspect cache usage in Braintrust: Open the trace in the Timeline layout to view token distribution and cache hit rate for individual LLM spans. The Cached tokens view isolates LLM spans and scales their bars by cached read tokens, so calls that reused the cache stand out from calls that did not.
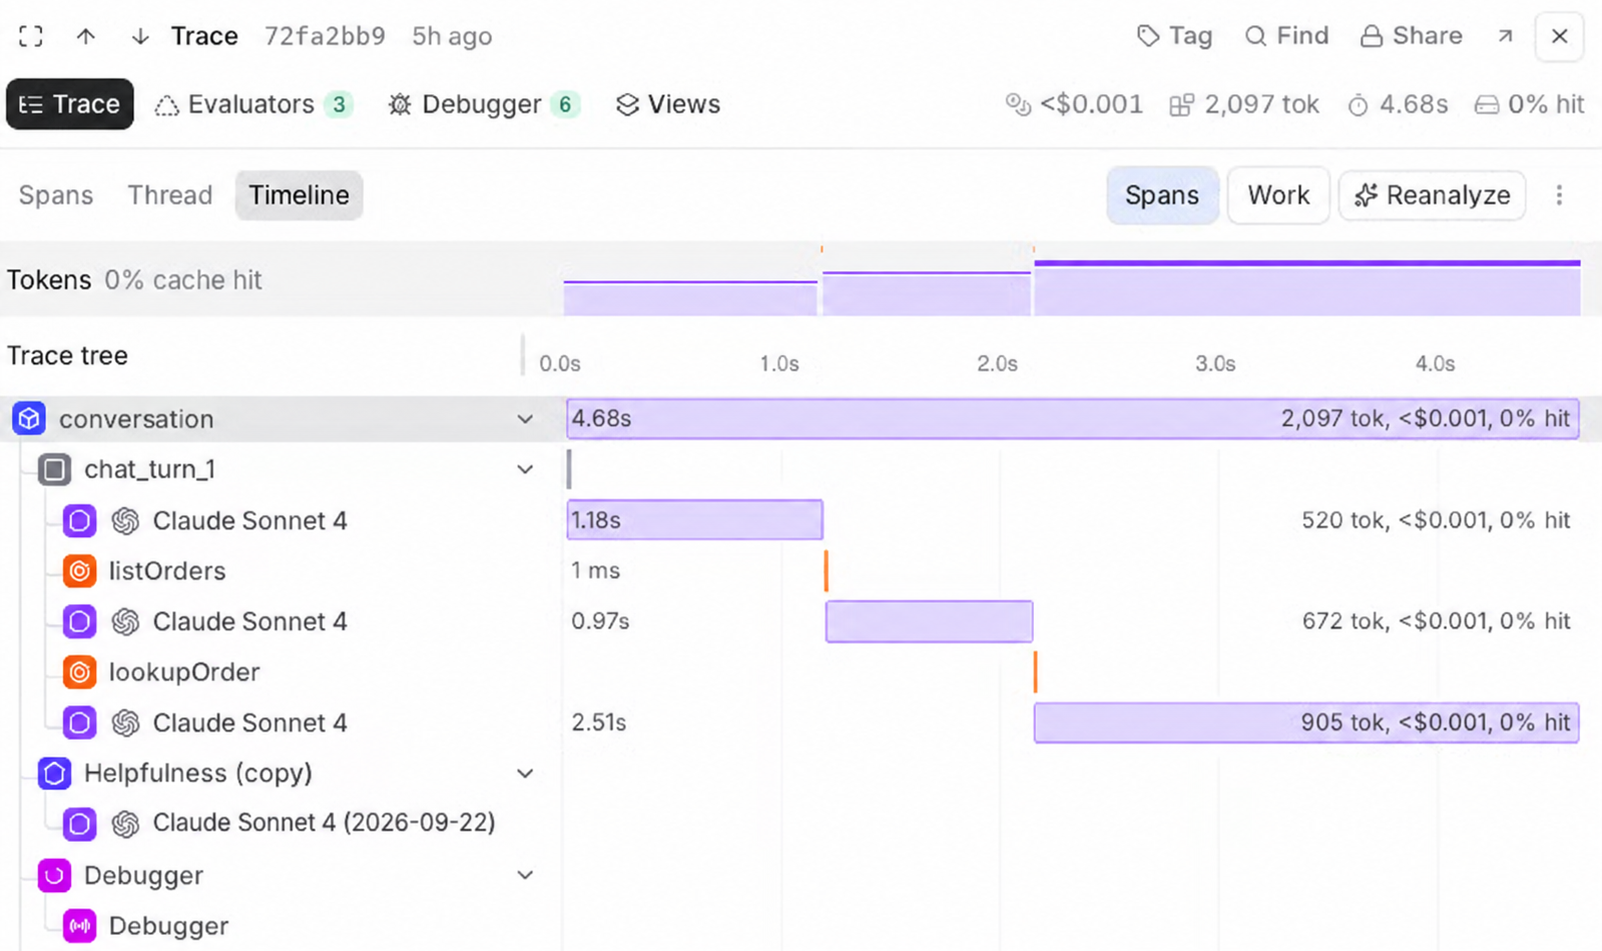
Braintrust's Timeline view displays token distribution and cache hit rates across Claude API calls.
Server-side tool usage counters
Anthropic executes server-side tools such as web search within its API. When Claude uses web search, the response can contain server_tool_use and web_search_tool_result content blocks. Anthropic also reports the number of searches in the response's usage.server_tool_use field.
Braintrust captures supported counters as server_tool_use_* metrics. For example, server_tool_use_web_search_requests records the number of web search requests reported by Anthropic for a Claude call. Developers can inspect the metric alongside the model response to determine whether the request involved server-side search.
Tracing application-owned tool execution
Claude can request a tool through the Messages API, but your application executes the function and sends the result back.
Tool-use blocks vs. executed tool spans
When Claude requests a tool, its response contains a tool_use block with the tool name and arguments. The response's stop reason is tool_use, indicating that control has passed to the application. After executing the function, the application sends the result back to Claude in a tool_result block.
The Anthropic integration records both model interactions, showing which tool Claude requested and what result it subsequently received. However, model spans alone cannot reveal what happened during the function's execution. A slow database query, for example, would appear as a delay between two Claude calls without a separate span recording the tool's duration and any internal errors.
Trace tool functions with @traced and wrapTraced
Application-owned operations are traced at the function level, with the @traced decorator in Python and wrapTraced() in TypeScript. Both record function arguments as input and return values as output, along with errors raised during execution.
Python
Apply @traced to the function your application executes. The following example demonstrates how to capture a user-data lookup. Install requests with pip install requests and set USER_API_BASE_URL to your service's origin before running it.
import os
from urllib.parse import quote

import requests
from braintrust import init_logger, traced

logger = init_logger(project="My Project")
api_base_url = os.environ["USER_API_BASE_URL"].rstrip("/")


@traced
def fetch_user_data(user_id: str):
    response = requests.get(f"{api_base_url}/api/users/{quote(user_id, safe='')}", timeout=30)
    response.raise_for_status()
    return response.json()


try:
    user_data = fetch_user_data("user-123")
finally:
    logger.flush()
TypeScript
Wrap the equivalent function with wrapTraced() to record its execution through the TypeScript SDK. Set USER_API_BASE_URL to the same service origin.
const logger = initLogger({ projectName: "My Project" });
const apiBaseUrl = process.env.USER_API_BASE_URL;
if (!apiBaseUrl) {
  throw new Error("Set USER_API_BASE_URL to your service's origin");
}

const fetchUserData = wrapTraced(async function fetchUserData(userId: string) {
  const url = new URL(`/api/users/${encodeURIComponent(userId)}`, apiBaseUrl);
  const response = await fetch(url);
  if (!response.ok) {
    throw new Error(`User lookup failed: ${response.status}`);
  }
  return response.json();
});

async function main() {
  try {
    const userData = await fetchUserData("user-123");
  } finally {
    await logger.flush();
  }
}

main().catch((error) => {
  console.error(error);
  process.exitCode = 1;
});
When a traced function runs within an active parent span, its execution appears as a child span in the same trace.
Nest Claude calls and tool execution in one trace
Create a parent span around the application's request handler to connect the initial Claude call with the tool execution and subsequent model response. Braintrust automatically nests instrumented operations executed within the active parent span, preserving their relationships in the trace viewer.
For a Claude tool loop, the execution follows three steps:
Step 1. Initial Claude call: Claude returns a tool_use block containing the requested tool name and arguments.
Step 2. Application tool execution: The instrumented function records the arguments it received and the result it returned. It also captures execution timing and errors.
Step 3. Follow-up Claude call: The application submits the tool result, and Claude generates its response using the returned information.
Reading the three spans in order shows whether an unexpected answer started with Claude's tool request, the function's output, or Claude's handling of the returned result.
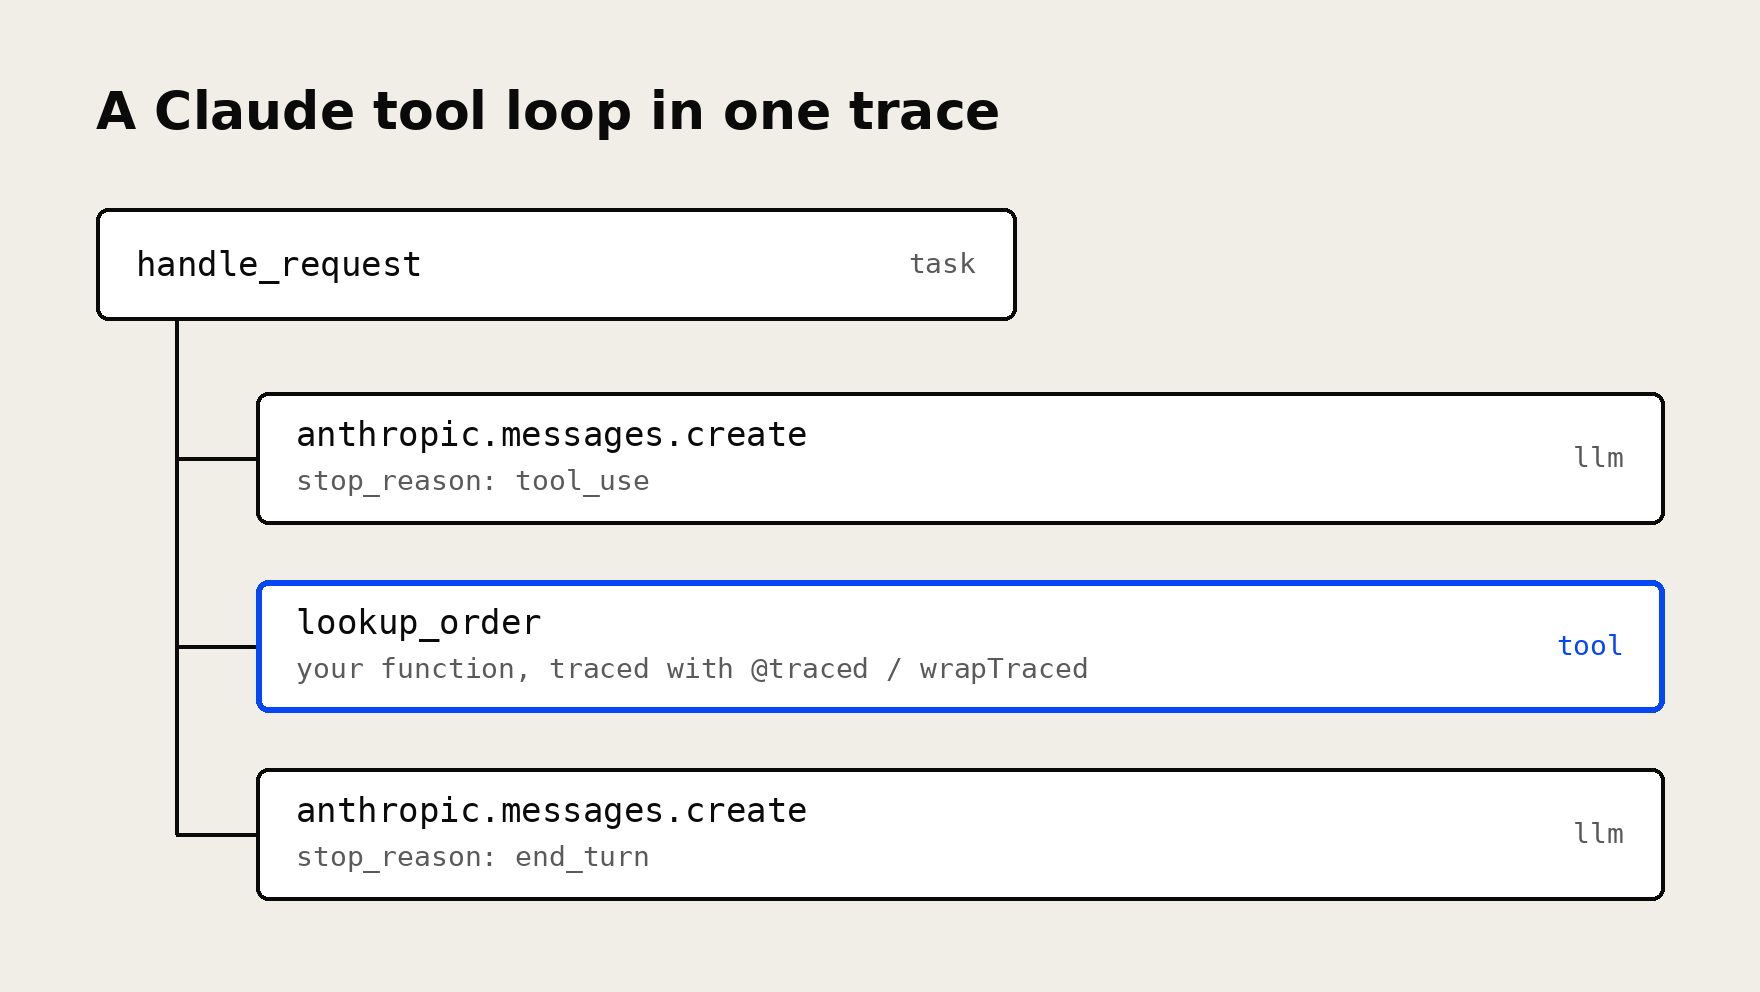
A parent span connects Claude's tool request, application-owned tool execution, and follow-up response in one trace.
TypeScript beta tool runner
Braintrust also captures Anthropic's beta tool runner through an anthropic.beta.messages.toolRunner span. The span records the task input and tool definitions, along with response messages and metrics aggregated across iterations.
Wrapping each tool function with wrapTraced() adds a separate span for every execution inside the tool runner, so individual tool calls appear next to the runner's aggregated metrics.
Finding and inspecting Claude traces in Braintrust
After running an instrumented Claude API request, open the corresponding Braintrust project to locate its trace and verify the captured data. The Logs interface provides search and filtering to find requests, while the trace viewer shows the recorded model interaction and any instrumented application operations connected to it.
Step 1. Find the Claude API request
Open the project's Logs page, where each row represents a complete trace by default. Use the search field to find a phrase from the request or response, or apply structured filters to search production logs using recorded metadata. Basic filters support point-and-click conditions, and the SQL tab provides more precise queries. For example, the following filter returns every trace recorded for one user:
metadata.user_id = "user-123"
To find traces containing an LLM call that raised an error, use:
ANY_SPAN(span_attributes.type = 'llm' AND error IS NOT NULL)
Both conditions inside ANY_SPAN() apply to the same span, ensuring the query matches the failed LLM call. You can also search response text using search() or narrow results to a particular time window.
For a specific Anthropic operation, select the span name anthropic.messages.create in an open trace. Braintrust applies the span-name filter to the Logs list and switches to the Spans row type when necessary.
Use these filter expressions in the WHERE clause of a full BTQL query with bt sql in the terminal. The --json option provides machine-readable output for scripts and further analysis.
Step 2. Inspect the Claude LLM span
Select the matching trace to open the trace viewer. The Spans layout displays the execution hierarchy, with instrumented Claude calls and application-owned operations nested under their parent spans. Developers can examine each operation's duration and token usage alongside its estimated cost.
Select anthropic.messages.create to inspect the recorded request. The span's detail tabs provide different views of its data:
-
Messages: Examine the input messages and Claude's response, including tool-use requests and recorded errors.
-
Details: Check the request parameters and available usage metrics. Application metadata also appears here when recorded on the selected span.
-
Raw: Inspect the underlying JSON to confirm exact values, including provider-specific fields that may be difficult to locate in the formatted views.
For requests involving multiple Claude calls, the Thread panel presents the conversation and tool exchanges chronologically. Timeline view helps identify where execution time and token consumption accumulated. You can also use Find with the scope set to Full trace to locate specific content across the recorded spans.
Each trace has a stable URL identified by its root_span_id, allowing developers to reference the exact execution in a bug report or share it with another team member. The SDK's Span.permalink() method generates direct links to individual spans.
Step 3. Verify the captured trace data
After opening the first Claude trace, confirm that the expected fields were recorded before relying on the instrumentation in production. Braintrust captures several metrics conditionally, so verification should distinguish missing instrumentation from features that were not used in the request.
For streaming requests, check the first-token latency against the total duration. When testing prompt caching, issue eligible requests that reuse the same cacheable prefix and inspect the reported cache activity. Application-owned tools only appear when instrumented, so a missing tool span usually means the function wasn't wrapped with @traced or wrapTraced().
Troubleshoot missing Claude traces
If the Logs page shows no trace after a completed request, check the setup in the following order:
-
Credentials and project: Confirm that
BRAINTRUST_API_KEYis configured and the logger points to the intended project. -
Instrumentation: Verify that Python initializes instrumentation before the Anthropic client is created, or that TypeScript loads the required import hook or bundler integration.
-
Trace delivery: Confirm that short-lived scripts flush buffered records before exiting. Applications that terminate before asynchronous logging finishes may leave traces unwritten.
-
Data plane configuration: Check
BRAINTRUST_API_URLwhen using an EU data plane or self-hosted deployment.
If traces appear but a specific field is missing, first check whether the request used the corresponding feature and whether the selected SDK captures its metrics. For missing application context or tool spans, inspect the parent-span configuration and confirm that the relevant functions execute within the active trace.
Claude API observability with Braintrust
The production traces Braintrust captures from Claude calls also feed evaluation. Online scoring grades selected production requests as they arrive, and failures or edge cases from those traces can be added directly to datasets, becoming repeatable test cases for assessing future changes.
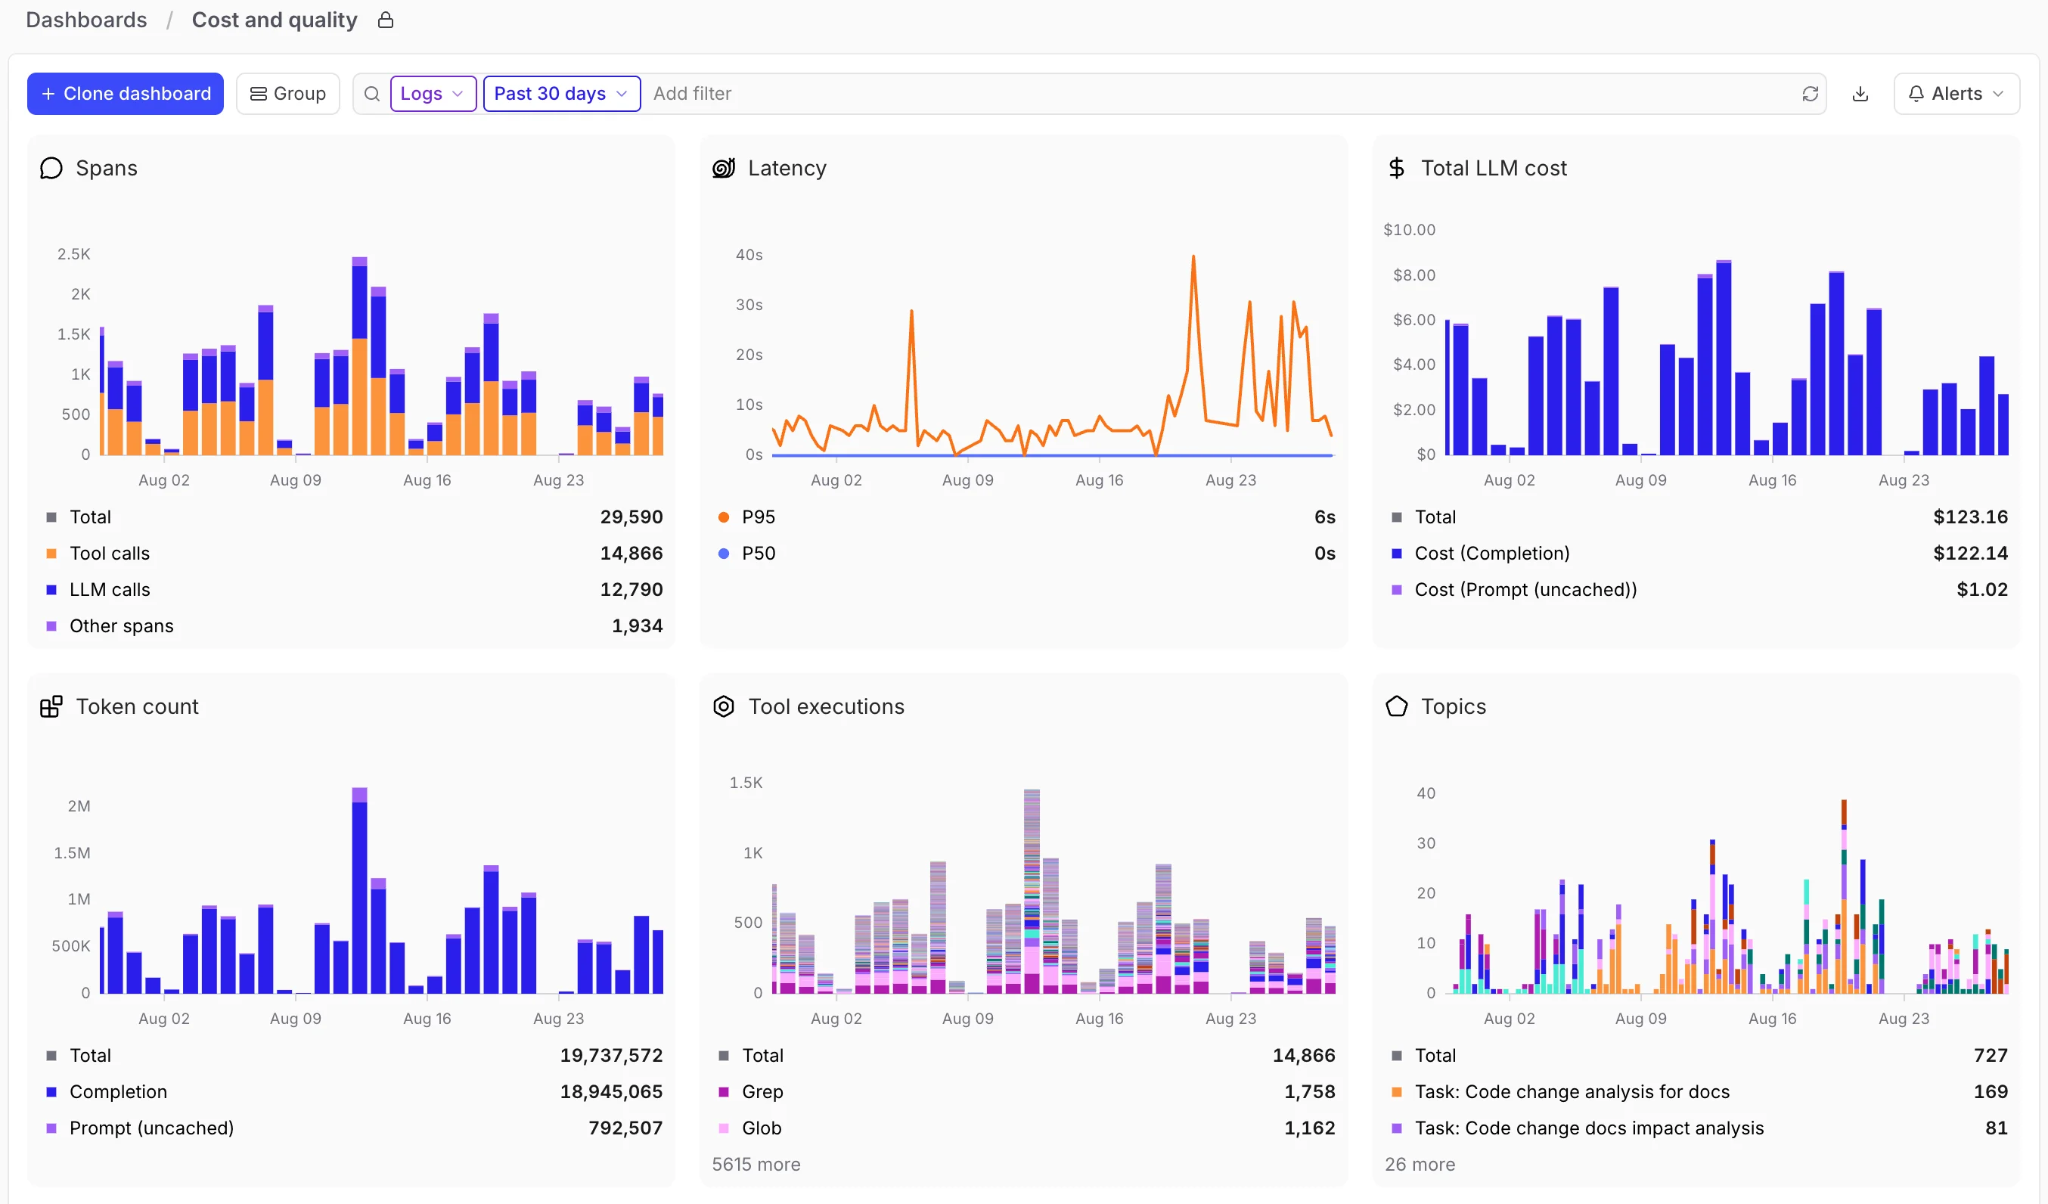
Across larger volumes of Claude traffic, dashboards and Topics surface patterns in latency, usage, sentiment, and recurring issues, so engineers don't have to open every trace. When a production problem needs deeper analysis, Loop, Braintrust's built-in AI assistant, can investigate selected patterns in natural language, summarize complex traces, and find similar executions.
Notion uses Braintrust to search large AI traces for specific tool calls, error codes, and customer-impacting patterns, and its team turns those findings into targeted evaluation datasets that catch regressions.
Start free with Braintrust to trace Claude API calls and turn production findings into evaluation cases.
Also read: How to trace LLM apps in Python and How to trace LLM applications in TypeScript
FAQs: how to log and trace Claude API calls (2026)
Can I trace Claude API calls without changing every call site?
Yes, in Python, TypeScript, Ruby, Go, and Java, which instrument the Anthropic SDK at startup or build time once Braintrust is configured. In .NET, each client needs .WithBraintrust() because auto-instrumentation isn't available yet.
Does Braintrust trace streaming Claude responses?
Braintrust records a streamed Claude response as a single span containing the completed output and adds time_to_first_token to measure initial streaming latency. Depending on the integration, this can measure the first stream event rather than the first visible text token. The exact span name depends on the Anthropic SDK integration used.
How can I confirm that Claude prompt caching is working?
Send two eligible requests with the same cacheable prefix and compare their LLM spans. A cache miss followed by a hit should show prompt_cache_creation_tokens on the first call and prompt_cached_tokens on the second, provided the prefix meets Anthropic's caching requirements and has not expired. The Cached tokens option in the Timeline layout shows reuse across LLM calls in a trace.
Does Braintrust trace Claude on AWS Bedrock or through the Braintrust gateway?
Both paths are supported, but the instrumentation differs. TypeScript applications using Anthropic’s Bedrock SDK can use the Anthropic import hook or wrapAnthropic(), while Python applications using boto3 use Braintrust’s AWS Bedrock integration. Claude requests sent through the Braintrust gateway can be traced without separate SDK instrumentation when gateway logging is enabled with the x-bt-parent header identifying the destination project or experiment.