The easiest way to add LLM observability to your AI app (2026)
Braintrust is the fastest way to add LLM observability to an AI app because the CLI handles authentication, SDK setup, instrumentation, verification, and trace access in one workflow. In a typical Python or TypeScript project, engineering teams can move from no tracing to a live Braintrust trace in about five minutes.
Why setup effort slows LLM observability adoption
Adoption of LLM observability usually slows during implementation, even when teams already have an evaluation strategy in mind. Engineers need traces to debug prompts, responses, tool calls, latency, token usage, errors, and cost, but getting those traces often requires changes across the application code, runtime environment, and deployment pipeline.
Self-hosted tools can add database setup, collector or exporter configuration, secrets management, service deployment, and ongoing maintenance. Hosted tools remove most infrastructure ownership, but setup can still require project configuration, API keys, SDK installation, provider-specific instrumentation, and verification across local, staging, and production environments.
Each setup step may be reasonable on its own, but the combined work can turn observability into a separate engineering project. When trace collection waits until after launch, production issues become harder to diagnose because the team lacks request-level visibility into model behavior and the surrounding application steps.
What easy LLM observability setup requires
An LLM observability tool is easy to adopt only if developers can capture useful traces before it becomes an infrastructure project. For AI apps, this means the setup process must meet four requirements.
One CLI flow: The setup should install, authenticate, configure the project, instrument the app, verify trace delivery, and return a trace link in a single terminal session. A developer should not need to move across several docs pages before seeing the first trace.
Automatic instrumentation: The tool should capture supported LLM calls without requiring manual wrappers around every provider client. Auto-instrumentation should detect AI libraries or frameworks in the application and attach tracing to model calls.
No backend to operate: Evaluation should start on a managed backend with a usable free tier, so teams can test observability without having to maintain storage, services, or deployment infrastructure during the initial setup pass.
A direct route from traces to evals: Logging is only the starting point for achieving production-quality AI. The same trace data should support cost analysis, online scoring, regression datasets, and CI evals, so the workflow can move from visibility to release checks without exporting data into a second system.
The 5-minute LLM observability setup with the Braintrust CLI
The Braintrust CLI handles installation, authentication, instrumentation, verification, and trace inspection from the terminal. In a typical Python or TypeScript project, the setup flow can take an application from no LLM observability to a live Braintrust trace without requiring the setup of Postgres, ClickHouse, Redis, or a separate observability backend.
The four steps below follow the shortest working path: install the CLI, authenticate Braintrust, instrument the repository, and open the first trace.
Step 1: Install the Braintrust CLI
On macOS or Linux, install the CLI with a single shell command:
curl -fsSL https://bt.dev/cli/install.sh | bash
The installer downloads a pre-built binary to ~/.local/bin/bt, or to $XDG_BIN_HOME/bt if that environment variable is set. Windows users can run the equivalent PowerShell installer:
powershell -ExecutionPolicy Bypass -c "irm https://github.com/braintrustdata/bt/releases/latest/download/bt-installer.ps1 | iex"
After installation, the CLI prompts you to run bt setup, which handles authentication and API key creation.
If the bt command is not available immediately after installation, open a new shell so the updated PATH is loaded.
Step 2: Authenticate with bt setup
Braintrust supports OAuth and API key authentication. For local development, use the browser-based login flow. For CI, scripts, or environments where OAuth is not the right fit, use BRAINTRUST_API_KEY.
bt auth login                       # OAuth: opens a browser login flow, saves credentials to your keychain
export BRAINTRUST_API_KEY=<your-key> # API key: good for CI, scripts, or if you prefer not to use OAuth
After authenticating, set and confirm the active org and project context:
bt switch   # Pick a default org and project
bt status   # Confirm what's active
bt setup is the entry point for the agent-led setup flow. On its own it handles authentication and API key creation, and with --skills or --mcp it installs Braintrust skill files, workflow docs, and the MCP server for supported coding agents, including Claude, Copilot, Cursor, Codex, Gemini, Opencode, and Qwen.
bt setup                              # Auth + API key only (ephemeral without --skills or --mcp)
bt setup --skills --agent claude      # Auth + install Braintrust skills for Claude
bt setup --skills --mcp --agent codex # Auth + skills + MCP server for Codex
To take an unrelated app from no observability to a live trace, use bt setup instrument. The instrument subcommand runs a coding agent against the repo, detects the project language, installs the exact SDK version, instruments LLM clients in the app entry point, runs the app to verify that traces are emitted, and outputs a Braintrust permalink to the captured trace.
bt setup instrument --agent codex                                  # Run codex against the current repo
bt setup instrument --agent claude --language typescript           # Force a language if auto-detection misses it
bt setup instrument --agent codex --project 'project-name' --yolo  # CI- or script-friendly run with full permissions
bt setup instrument supports Python, TypeScript/JavaScript, Go, Java, Ruby, and C#, and runs after bt setup has created the API key for the active session. With that context in place, the CLI handles the steps that would otherwise require moving across several docs pages before seeing the first trace.
Step 3: Auto-instrument your repository
Braintrust auto-instrumentation patches supported AI libraries at startup, so LLM calls are captured without manual wrappers around each client. That keeps the first setup pass focused on quickly getting traces into Braintrust. Manual wrappers are still available when a team needs explicit client-level control, but auto-instrumentation should be the default path for a five-minute setup.
For a TypeScript application using OpenAI, install the Braintrust and OpenAI packages:
npm install braintrust openai
For a Python application using OpenAI, install the Braintrust and OpenAI packages:
pip install braintrust openai
Set the required environment variables for both TypeScript and Python:
export BRAINTRUST_API_KEY="your-api-key"
export OPENAI_API_KEY="your-api-key"
Initialize Braintrust once at startup.
For TypeScript:
// Call once at startup — all LLM calls are traced automatically
initLogger({
  apiKey: process.env.BRAINTRUST_API_KEY,
  projectName: "My Project (TypeScript)",
});

const client = new OpenAI({ apiKey: process.env.OPENAI_API_KEY });
const response = await client.responses.create({
  model: "gpt-5-mini",
  input: "What is the capital of France?",
});
For Python:
import os

import braintrust

# Call once at startup — all LLM calls are traced automatically
braintrust.auto_instrument()
braintrust.init_logger(
    api_key=os.environ["BRAINTRUST_API_KEY"],
    project="My Project (Python)",
)

from openai import OpenAI

client = OpenAI(api_key=os.environ["OPENAI_API_KEY"])
response = client.responses.create(
    model="gpt-5-mini",
    input="What is the capital of France?",
)
Run the app.
For TypeScript:
node --import braintrust/hook.mjs app.js
For Python:
python app.py
This setup automatically traces LLM calls. For TypeScript projects that use a bundler such as Vite, Webpack, Rollup, or esbuild, use the relevant Braintrust bundler plugin in place of the Node --import flag.
The same setup pattern extends beyond OpenAI. Braintrust supports instrumentation across common AI providers and frameworks, including Anthropic, Google GenAI, AWS Bedrock, LangChain, LangGraph, the Vercel AI SDK, Pydantic AI, LiteLLM, and OpenTelemetry-based workflows. For other stacks, Braintrust's instrumentation docs cover the provider-specific and framework-specific setup details.
Step 4: Click the permalink and see your first trace
When bt setup instrument finishes, it prints a Braintrust permalink to the trace it just captured. If you instrumented the app manually instead, run it once and open the trace from the project's Logs view. Either path takes you to the same trace screen, where you can inspect the full request and response, the model and version used, input and output token counts, cost in USD, time-to-first-token, and total latency.
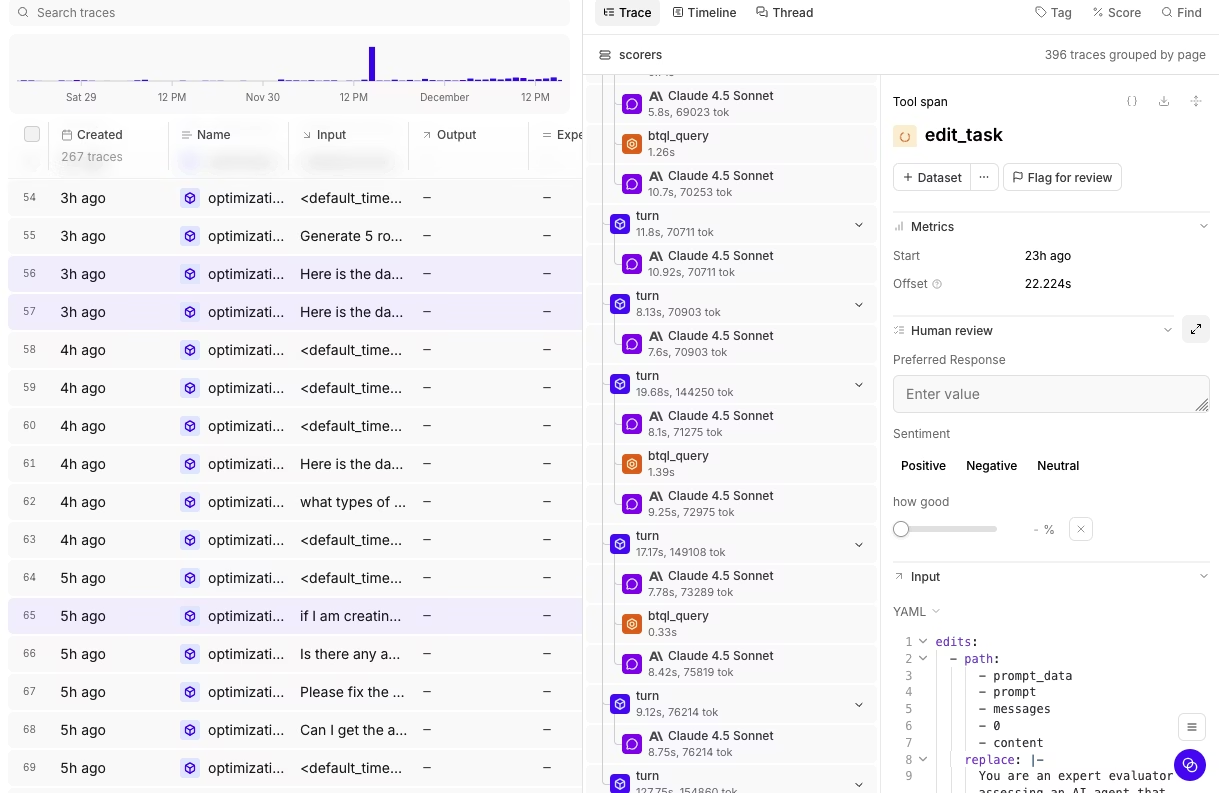
When the call invokes tools, Braintrust shows those tool calls as nested spans under the parent LLM span. Retrieval, formatting, routing, and safety logic appear in the same trace whenever those steps are instrumented, so developers can see the full request lifecycle in a single view.
For a typical Python or TypeScript application, the flow should take only five minutes from CLI installation to the first trace. The full walkthrough can run on Braintrust's free tier, which includes 1 GB of processed data per month. That gives engineering teams enough room to test LLM observability against real application traffic before expanding Braintrust across the production workflow.
Working with logs after setup
Once traces are flowing, the CLI gives developers a direct way to inspect production behavior from the terminal. These commands are not required for the first trace, but they are useful for debugging incidents, sampling recent traffic, querying scored logs, and running evaluations in CI.
bt view logs opens an interactive terminal UI for browsing project logs. Use search and filters to narrow the view during an investigation.
bt view logs                                       # Browse logs for the active project
bt view logs --search "error"                      # Search by keyword
bt view logs --filter "metrics.duration > 5.0"     # Filter by expression
bt view logs --url <braintrust-url>                # Open a Braintrust URL in the terminal
For programmatic access, bt sql runs SQL queries against project logs from the terminal or from scripts.
bt sql "SELECT * FROM project_logs('my-project') WHERE scores.Factuality < 0.5 LIMIT 50"
BRAINTRUST_API_KEY=... bt sql "SELECT count(*) FROM project_logs('my-project')" --json
The same CLI workflow supports evaluation in CI. Set BRAINTRUST_API_KEY as a secret, then run evals in the pipeline.
- name: Run evals
  env:
    BRAINTRUST_API_KEY: ${{ secrets.BRAINTRUST_API_KEY }}
  run: bt eval tests/
For non-interactive CI output, Braintrust supports --no-input and --json.
BRAINTRUST_API_KEY=... bt eval tests/ --no-input --json
These commands keep the workflow connected after setup. Developers can inspect traces, query scored logs, and run the same evaluation process before deployment without exporting data into a separate debugging or reporting tool.
What auto-instrumentation captures inside every LLM call
Auto-instrumentation is useful only if the resulting trace contains enough context to debug production behavior. Braintrust records model calls as spans within a request trace and keeps the prompt, response, model metadata, token usage, latency, cost, and configured scores attached to the same request.
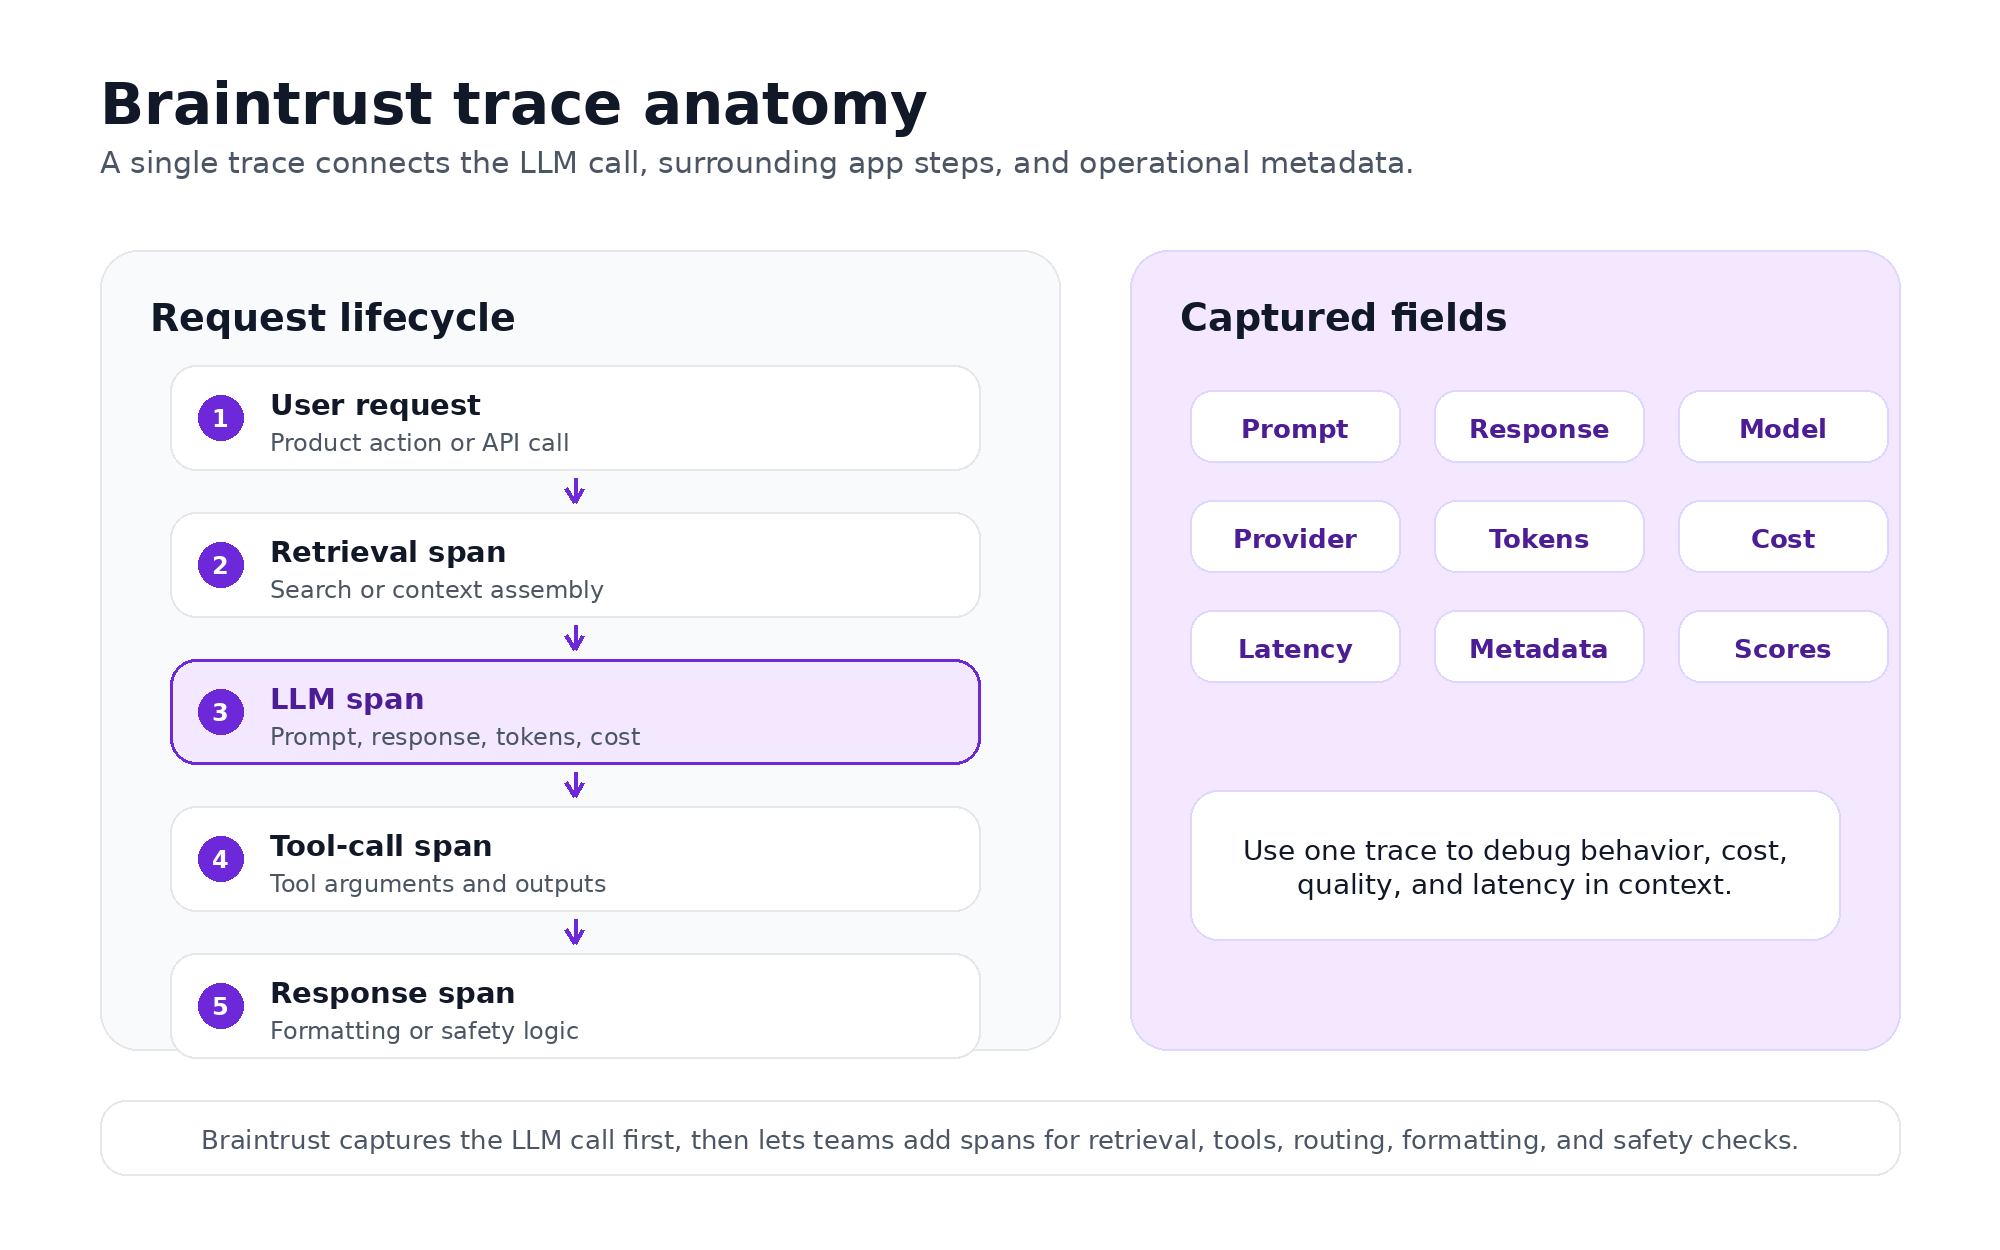
Braintrust connects the LLM call, the surrounding application steps, and the operational metadata into a single trace.
Model request
Braintrust captures the fields passed to the provider, including the system message, user prompt, tool definitions, temperature, top_p, max_tokens, and other model parameters. These fields show exactly what the model received when a production call behaved unexpectedly.
Model response
The response side includes generated content, tool-call payloads, finish reason, and the streamed token timeline when streaming is enabled. These response fields provide developers with the context needed to inspect hallucinations, malformed tool calls, incomplete responses, or unexpected model behavior.
Runtime, cost, and quality metadata
Each captured call also includes operational fields such as provider, model, and version, deployment name, user or session ID when set, time-to-first-token, total latency, output tokens per second, input and output tokens, and estimated cost in USD. Developers can group, filter, and query these fields in the Braintrust UI or through bt sql to investigate cost spikes, slow traces, and low-scoring outputs.
Application context around the model call
Auto-instrumentation captures supported LLM calls first, while surrounding application logic can be added as spans when needed. Retrieval, routing, formatting, safety checks, and tool execution can appear in the same trace, so developers can see whether a failure came from the model call itself or from the logic around it.
Custom business fields also need explicit instrumentation. User ID, tenant ID, feature flag, experiment name, or other metadata should be added when those fields are important for debugging, cost attribution, or production analysis.
Braintrust supports instrumentation across common providers and frameworks, including OpenAI, Anthropic, Google GenAI, xAI Grok, AWS Bedrock, LangChain, LangGraph, the Vercel AI SDK, Pydantic AI, LiteLLM, and OpenTelemetry-based workflows.
Braintrust stores traces in Brainstore, the database built for AI trace workloads. AI traces are larger than traditional observability spans because they often include prompts, responses, tool calls, metadata, scores, and late-arriving annotations, so Brainstore handles the larger payload sizes and the query patterns characteristic of production AI systems.
Also read: The complete guide on agent observability.
From production traces to release checks in one workflow
LLM observability becomes more useful when production traces feed the workflows that control quality, cost, and release readiness. Braintrust keeps logs, cost analysis, online scoring, datasets, and CI evals in a single workflow, so trace data can move from debugging evidence to release criteria without an export or a second system.
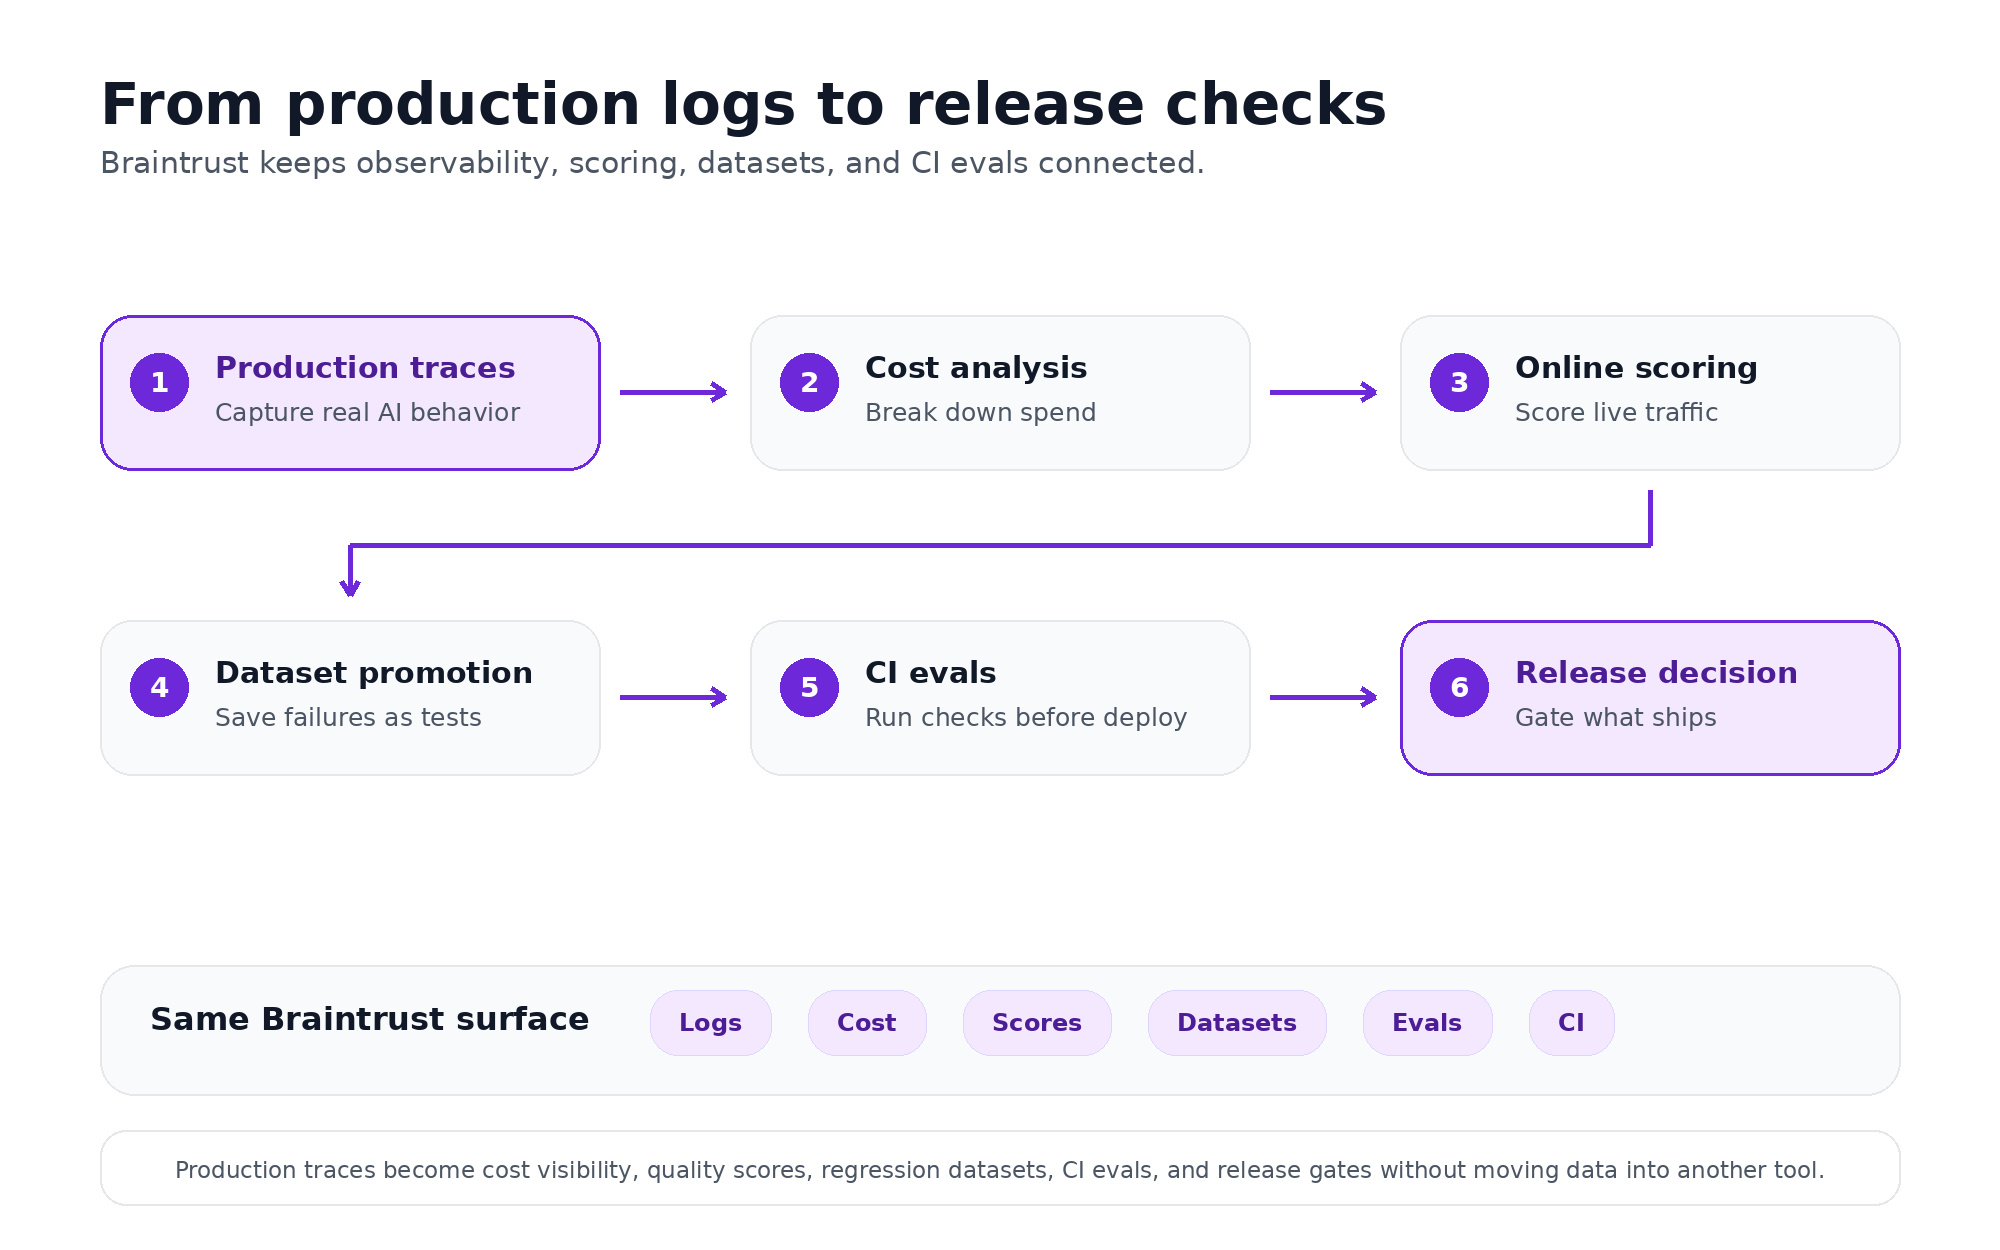
Braintrust turns production traces into cost visibility, quality scores, regression datasets, CI evals, and release checks without moving data into another tool.
Cost analysis from captured traces
Every captured trace includes cost data in USD, which makes cost analysis available from the same logs used for debugging. Engineering teams can group spend by model, feature, prompt version, user, or tenant to identify where LLM usage is increasing and which application flows are driving the largest share of spend.
Cost analysis becomes especially useful when a prompt change, model switch, or agent loop changes token usage. Instead of reviewing aggregate provider bills after the fact, teams can inspect the specific traces responsible for the increase and connect spend back to the model call, feature, or customer workload that produced it.
Online scoring on production traffic
Trace data can also support quality measurement after deployment. Braintrust supports built-in scorers for common evaluation needs, such as Factuality and ContextRelevancy, as well as custom LLM-as-judge scorers for product-specific quality criteria.
With online scoring configured, production calls can be evaluated automatically at a chosen sampling rate. The same scoring logic can be run on CI eval datasets before release, keeping pre-deploy and post-deploy quality signals aligned.
Production failures as regression tests
When a low-scoring or problematic trace appears in production, Braintrust can promote the example into a dataset. The next prompt, model, or retrieval change can be run against that dataset before deployment, so the failure becomes part of the regression suite rather than a one-off incident.
How easy LLM observability setup compares across tools
Each tool is compared by setup flow, instrumentation, infrastructure requirements, and trace-to-eval workflow.
| Tool | One setup flow | Instrumentation | No infra to start | Trace-to-eval workflow |
|---|---|---|---|---|
| Braintrust | CLI-led setup for auth, SDK install, instrumentation, verification, and trace permalink | Auto-instrumentation, SDK wrappers, OTel, provider, and framework integrations | Managed free tier with 1 GB processed data per month | Traces, cost analysis, online scoring, datasets, and CI evals in one workflow |
| Langfuse OSS | SDK setup is straightforward, but self-hosting comes first | SDK, decorators, and OTel support | Self-hosted stack includes application containers, worker, Postgres, ClickHouse, Redis or Valkey, and object storage | Datasets and evals are supported, but setup starts with infrastructure ownership |
| Langfuse Cloud | Managed setup reduces infrastructure work, but SDK and decorator setup still apply | SDK, decorators, and OTel support | Managed cloud option | Observability, datasets, and evals are in the platform, but the setup path is less CLI-led than Braintrust |
| PostHog | SDK or integration setup for LLM analytics | LLM analytics instrumentation through PostHog capture patterns and integrations | Managed cloud option | LLM evaluations exist, but PostHog is analytics-first, not an eval-first release workflow |
| Arize Phoenix | OTel registration and exporter setup | OTel with auto-instrumentation for common frameworks, providers, and languages | Phoenix Cloud is managed; OSS or self-hosting is also common | Evals and datasets are supported, but the trace-to-release workflow is less direct than Braintrust |
Braintrust
Braintrust is the strongest fit when the goal is the shortest route from setup to production evaluation. The CLI covers terminal workflows for instrumentation, log browsing, SQL queries, evals, and coding-agent configuration. bt setup authenticates the project and creates the API key, and bt setup instrument runs a coding agent to install the SDK, instrument LLM clients, verify the app, and return a trace permalink. Braintrust also supports CI evals through the same CLI, which connects the first-trace setup to release checks without moving trace data to another system.
Auto-instrumentation and provider coverage also extend Braintrust's usefulness past the first trace. Braintrust connects provider and framework integrations with logs, cost analysis, online scoring, datasets, and CI evals, so production traces become part of the same workflow used to measure quality and prevent regressions. Braintrust's free tier includes 1 GB of processed data per month, which is enough to test instrumentation on real production traffic before committing to a paid plan.
Langfuse OSS
Langfuse OSS is a reasonable fit for teams that need open-source ownership and have the DevOps capacity to operate the stack. Langfuse can be self-hosted and supports LLM-specific observability, prompt management, datasets, and evaluations, including datasets created from production traces. Its setup burden is higher because the self-hosted architecture includes application containers, a worker, Postgres, ClickHouse, Redis or Valkey, and object storage.
Langfuse Cloud
Langfuse Cloud is the managed version of Langfuse maintained by the Langfuse team. It removes the self-hosted infrastructure work while keeping Langfuse's tracing, SDKs, prompt management, datasets, experiments, and live evaluator workflows. The setup path is better suited to teams that want Langfuse's product model without having to run the underlying storage and worker architecture themselves.
PostHog
PostHog is for teams that want LLM analytics within a broader product analytics system. Its LLM analytics features cover usage, latency, cost, and generation quality, and its evaluation workflow supports both LLM-as-a-judge checks and deterministic code-based evaluations. PostHog is best framed as an analytics-led option for teams that already use the product data layer and want LLM behavior measured alongside other product events.
Arize Phoenix
Arize Phoenix is an OpenTelemetry-based AI observability and evaluation system. Phoenix accepts traces over OTLP and supports auto-instrumentation for common frameworks, providers, and languages, including LangChain, LlamaIndex, DSPy, the Vercel AI SDK, OpenAI, Bedrock, Anthropic, Python, TypeScript, and Java. It also supports LLM-based evaluations, human annotations, datasets, experiments, prompt workflows, and span replay, making it a technical fit for teams already standardizing around OpenTelemetry and OpenInference.
For detailed comparisons, see the best LLM monitoring tools and best AI observability tools roundups.
When easiest LLM observability isn't the right fit
Setup speed is important, but the fastest path to the first trace should not override deployment, governance, or workflow requirements. Some teams need to weigh other constraints before choosing an LLM observability tool.
Strict on-prem or air-gapped requirements
If data residency, security policy, or customer commitments rule out hosted SaaS, the deployment model becomes the first requirement. A self-hosted observability stack or Braintrust's hybrid deployment may be the better fit, even if the initial setup takes longer than the managed free-tier path.
Existing Datadog APM workflows
Teams that already use Datadog as the operational source of truth may want LLM traces near infrastructure metrics, alerts, dashboards, and on-call routing. Datadog LLM Observability can fit that operating model when centralized incident response matters more than the shortest CLI-led setup.
Cost tracking without quality evaluation
Some teams only need to monitor token usage, model spend, and latency across providers. A gateway or analytics-first tool can be enough when quality scoring, regression datasets, and CI evals are not part of the roadmap. Braintrust becomes the stronger choice when cost visibility needs to connect with output quality, production scoring, and release checks.
Get started with the easiest LLM observability setup
The Braintrust CLI brings authentication, SDK install, auto-instrumentation, verification, and the first trace permalink into one terminal flow, so a Python or TypeScript AI app can reach live LLM observability in about five minutes. From there, the same data feeds cost analysis, online scoring, regression datasets, and CI evals in a single workflow, without exporting traces into a second system.
Start with the Braintrust free tier, which includes 1 GB of processed data per month, and run the five-minute setup against real production traffic before expanding Braintrust across your release workflow.
FAQs
How long does it actually take to set up Braintrust?
A typical Python or TypeScript app can reach a live Braintrust trace in about five minutes. The CLI handles authentication, SDK setup, instrumentation, verification, and trace access in a single workflow, so developers can confirm observability before rolling out the setup to production.
Does bt setup instrument work with LangChain and LangGraph?
Braintrust supports LangChain and LangGraph through OpenTelemetry-based instrumentation. Traces from framework-based workflows can flow into the same Braintrust project as direct provider calls, allowing engineering teams to inspect model calls, framework spans, tool activity, latency, and cost in a single trace view.
What does Braintrust auto-instrumentation actually wrap, and what does it skip?
Braintrust captures supported LLM calls across common providers and frameworks, including OpenAI, Anthropic, Google GenAI, xAI Grok, AWS Bedrock, LangChain, LangGraph, the Vercel AI SDK, Pydantic AI, LiteLLM, and OpenTelemetry-based workflows. Business-specific fields such as user ID, tenant ID, feature flag, and experiment name, as well as non-LLM application steps such as retrieval or formatting, should be explicitly added when needed for debugging, cost attribution, or analysis.
Do I need to change my code to use Braintrust?
Braintrust adds the SDK initialization and instrumentation needed to capture calls to supported LLMs. Most application logic can stay unchanged during the first setup pass. Teams can add custom metadata and non-LLM spans later when production debugging requires more context.
How does the Braintrust free tier compare to self-hosting Langfuse?
Braintrust's free tier includes 1 GB of processed data per month without requiring teams to operate the observability backend. Langfuse OSS gives teams open-source ownership, but the self-hosted deployment includes infrastructure setup and maintenance. Braintrust is the faster path for teams who want a hosted setup, trace visibility, and a direct route into evaluation workflows.
What if I'm using a model provider that isn't auto-instrumented?
If the provider emits OpenTelemetry traces, Braintrust can route those spans into the project through the supported OTel setup. If no auto-instrumentation exists for the provider, developers can use Braintrust's tracing primitives to manually wrap the call while still keeping the provider activity connected to the broader trace.
Can I use the Braintrust CLI in CI/CD?
The Braintrust CLI can run evals in GitHub Actions or other CI runners with BRAINTRUST_API_KEY stored as a secret. The CLI also supports non-interactive output with --no-input and --json, which makes eval runs easier to script. Using the same evaluators in CI and production scoring keeps pre-deploy and post-deploy quality checks aligned.
Is Braintrust easier to set up than Langfuse?
Braintrust is easier for teams that want the shortest hosted route from setup to first trace and from traces to evaluation. Langfuse offers fast SDK-based instrumentation and a strong open-source option, but self-hosted deployment adds infrastructure work, while Cloud still centers setup on the SDK and product configuration. Braintrust puts authentication, instrumentation, verification, trace inspection, and CI evals behind a CLI-led workflow, which makes the setup-to-release process more direct.