

LLM trace storage: how to store and search production agent runs
Production agent runs generate complex traces that must remain complete for effective debugging. Truncation can remove the inputs or tool responses responsible for a failure, and sampling may discard the entire run. Preserving the execution history allows engineers to reconstruct what happened and identify where the agent went wrong.
As trace volume grows, full-text search and metadata filtering help engineers locate relevant failures across production runs. Retention and export policies ensure historical traces remain available for investigations, while the choice between object storage and a dedicated trace backend depends on search requirements and the infrastructure an organization is prepared to maintain.
Braintrust stores production traces in Brainstore, which keeps a run's spans in the same index so a complete execution loads together. Full-text search and metadata filters narrow production runs down to the failing one, and large payloads live in attachments that stay inspectable without weighing down the search index.
Start free with Braintrust to store and investigate production agent runs →
What a production LLM trace contains
A production LLM trace records an application request's end-to-end execution. Each operation becomes a span, and parent-child relationships connect individual spans into a tree that reflects the execution flow. For an AI agent, the trace reveals which model call initiated a tool execution and how subsequent steps contributed to the final response.
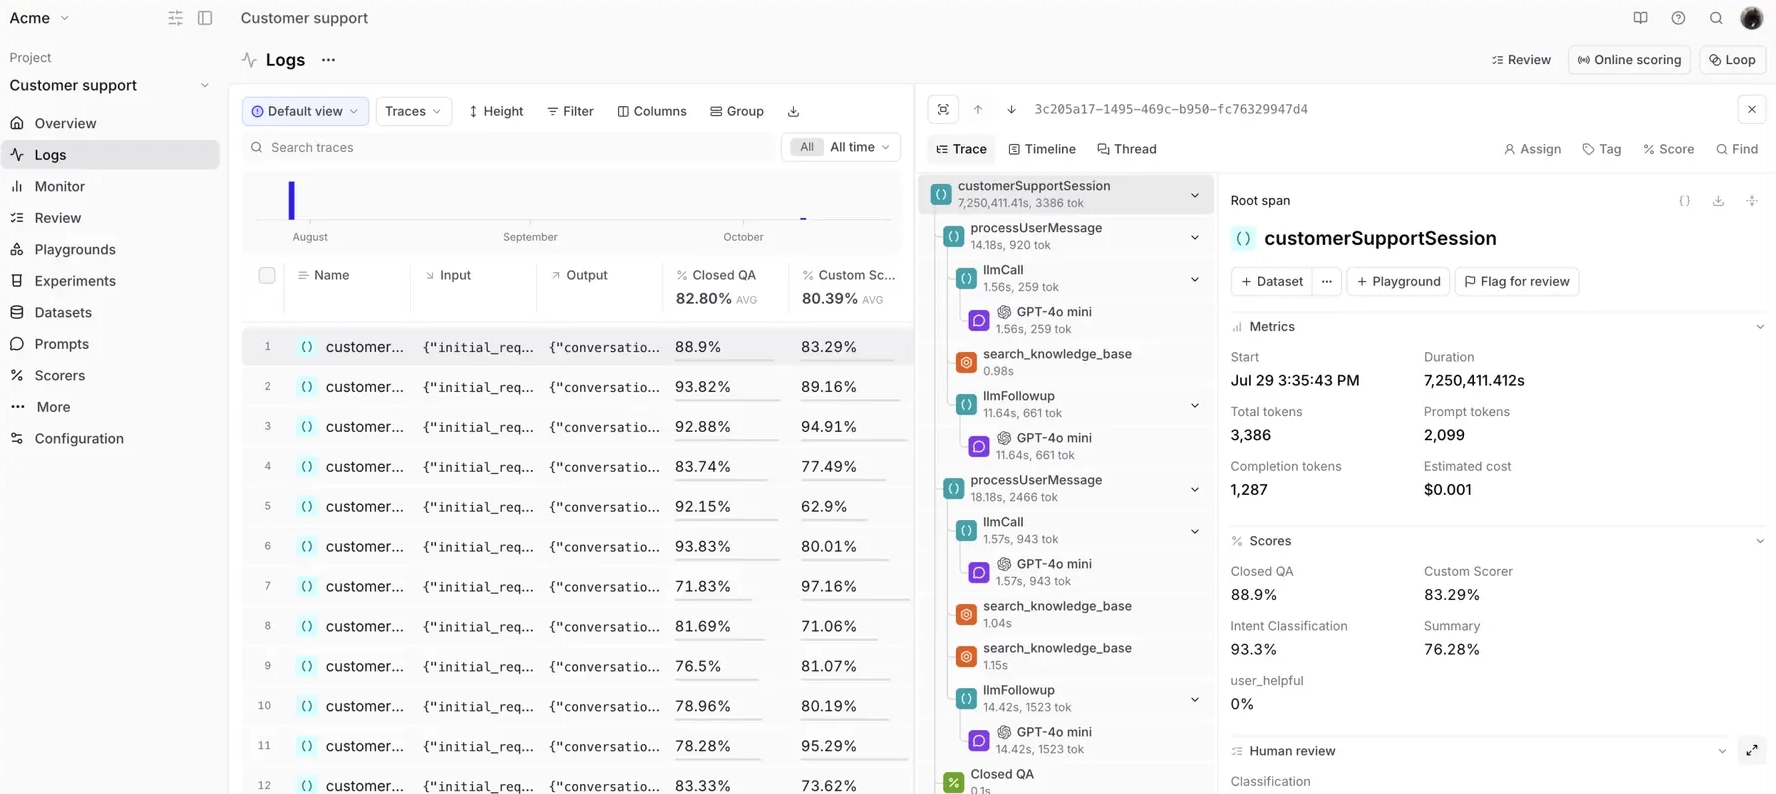
A production trace in Braintrust showing the connected spans behind an application request.
Six types of information need to be preserved for a complete production trace:
Span tree: Parent-child relationships establish the execution sequence and connect related operations. Without them, a tool failure may appear unrelated to the model call that triggered it.
Model call spans: Each LLM call should retain its messages and model configuration alongside token usage and estimated cost. Braintrust's LLM call observability guide covers call-level data collection in greater detail.
Tool call spans: Tool names, arguments, and returned values show what the agent attempted and whether a tool error affected subsequent operations.
Full inputs and outputs: Complete prompts, retrieved context, and responses provide the original content needed to reproduce failures and investigate incorrect answers.
Identifiers: Trace and span IDs connect records to the correct execution, while session and user IDs help locate runs associated with a specific interaction. Braintrust identifies traces using root_span_id and individual spans using id.
Application metadata: Consistent fields such as environment, model version, prompt version, and tenant support filtering across deployments and customer interactions.
Preserving individual records is only part of the storage requirement. Engineers must also be able to retrieve the complete execution with its original span relationships intact, without manually reconstructing the run from disconnected records.
LLM trace payloads: truncation, sampling, and large spans
LLM traces can contain substantially more data than traditional application logs because individual spans may include lengthy prompts or extensive tool outputs. Braintrust reported that its p95 log size had increased from 500 KB to nearly 3 MB over a few months, with individual spans often exceeding 1 MB. Storage systems must accommodate growing payloads without sacrificing the information engineers need for debugging.
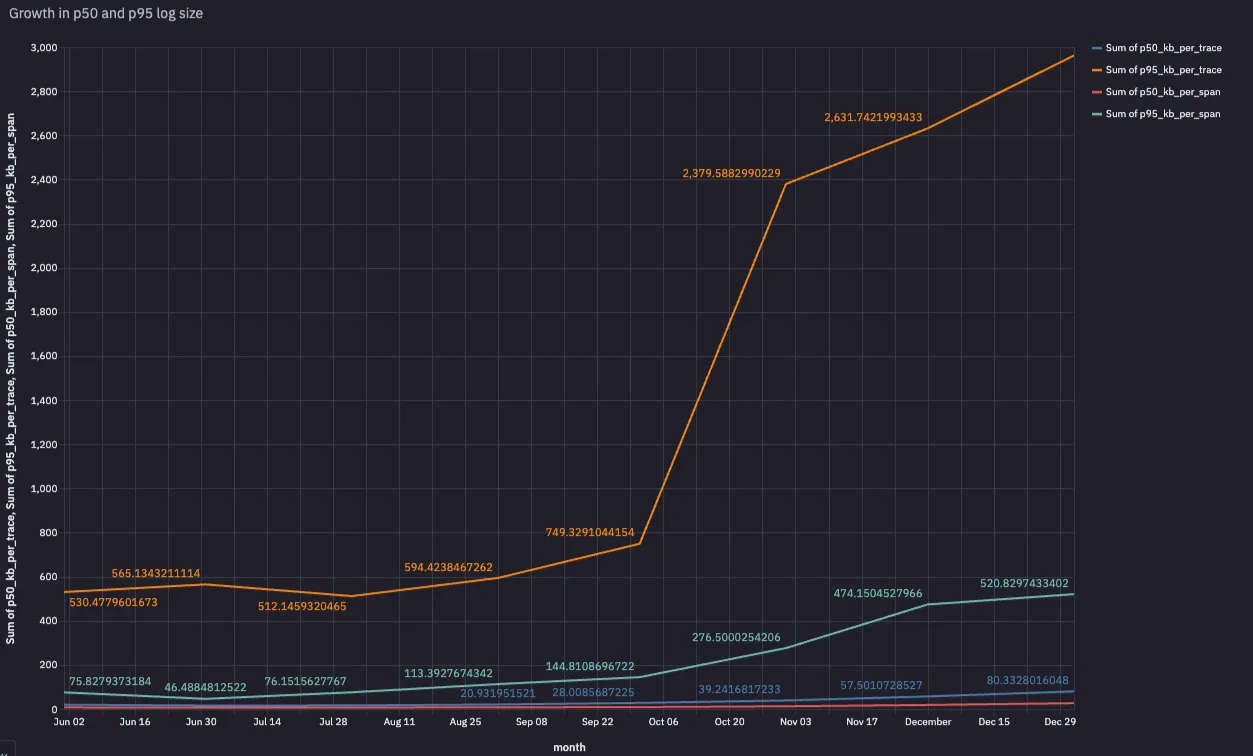
Growth in LLM log sizes as AI applications handle longer contexts and more complex agent runs.
Truncation: Setting a fixed payload limit controls storage consumption but can remove the exact text responsible for an incorrect response. If a retrieved document or tool output is cut off, engineers may lose the evidence needed to reproduce the failure. Full-text searches also cannot match content that was never stored.
Sampling: Retaining only a percentage of traces reduces ingestion volume but creates gaps in production history. Head sampling decides at the start of a request, before any later failure can be seen. Tail sampling evaluates a run after collecting its spans and can prioritize errors, although it may still discard apparently successful runs. A confidently incorrect answer discovered through customer feedback may therefore have no corresponding trace in storage.
Large payload handling: Keeping searchable fields separate from bulk content helps preserve complete execution records without indexing every byte. Frequently queried fields such as user IDs and error types remain indexed, while lengthy transcripts or document collections can be stored as attachments that remain accessible during trace inspection.
The key is to decide which information requires indexing and which only needs to be available when an engineer opens a specific trace. Searchable metadata should remain consistent across runs, and attachments should preserve the original content without losing its association with the execution.
Searching LLM traces by text, fields, and metadata
A customer reports an incorrect answer but provides only a sentence from the response. An engineer might start by searching for the reported phrase and then narrow the results to the affected customer or release. Effective trace retrieval must support investigations that begin with incomplete information and progressively narrow the search to the relevant execution.
Three search capabilities cover most production investigations:
-
Full-text search: Find words or phrases within recorded prompts and responses. Searching for a reported error message can help locate the affected execution even when the trace ID is unavailable.
-
Structured field filters: Narrow results using recorded values such as span type or error status. Engineers can also filter by latency and token usage to investigate slow or expensive model calls.
-
Metadata filters: Search application-defined fields to isolate requests from a particular customer or deployment. Filtering by prompt version can also help identify traces associated with a specific release.
Agent investigations may require conditions that span multiple operations within the same execution. For example, an engineer might search for runs containing both a failed tool call and an LLM call. The storage system must distinguish between conditions that apply to the same span and conditions satisfied by separate spans within a trace. Braintrust supports both forms of filtering through ANY_SPAN(), depending on how the conditions are grouped.
As production data accumulates, the storage backend needs efficient indexing for targeted text queries and flexible filtering across semi-structured records, particularly when application metadata changes frequently. Brainstore covers both with an inverted index and native support for semi-structured data.
Metadata consistency: Establish shared field names and value formats before deployment. Recording the same identifier as user_id in one service and customer_id in another can cause filters to exclude relevant traces. Consistent metadata also allows engineers to investigate issues across services and historical releases without maintaining separate query conventions.
Object storage vs. trace backends for LLM traces
Engineers can store production agent traces as raw files in Amazon S3 or Google Cloud Storage, or send them to a dedicated trace backend with built-in search and inspection. The storage decision affects how quickly engineers can investigate failures and how much infrastructure the organization must maintain.
Raw records in object storage: JSON Lines or Parquet files provide durable storage with control over data location and retention. However, storing complete records does not automatically make them easy to investigate. Engineers need a query engine to search historical traces and additional tooling to reconstruct span relationships and inspect execution history.
Trace backend with search and inspection: A dedicated backend provides indexed retrieval and a trace viewer, allowing engineers to locate production failures and examine the corresponding execution history. Hosted services also handle search infrastructure and maintenance, although ingestion costs and retention limits depend on the provider. Self-hosted deployments introduce additional infrastructure responsibilities.
Object storage can also serve as the foundation for a dedicated trace database. Brainstore, for example, keeps trace data on object storage and layers an index over it so records remain searchable and complete runs load together; the Braintrust section below covers how.
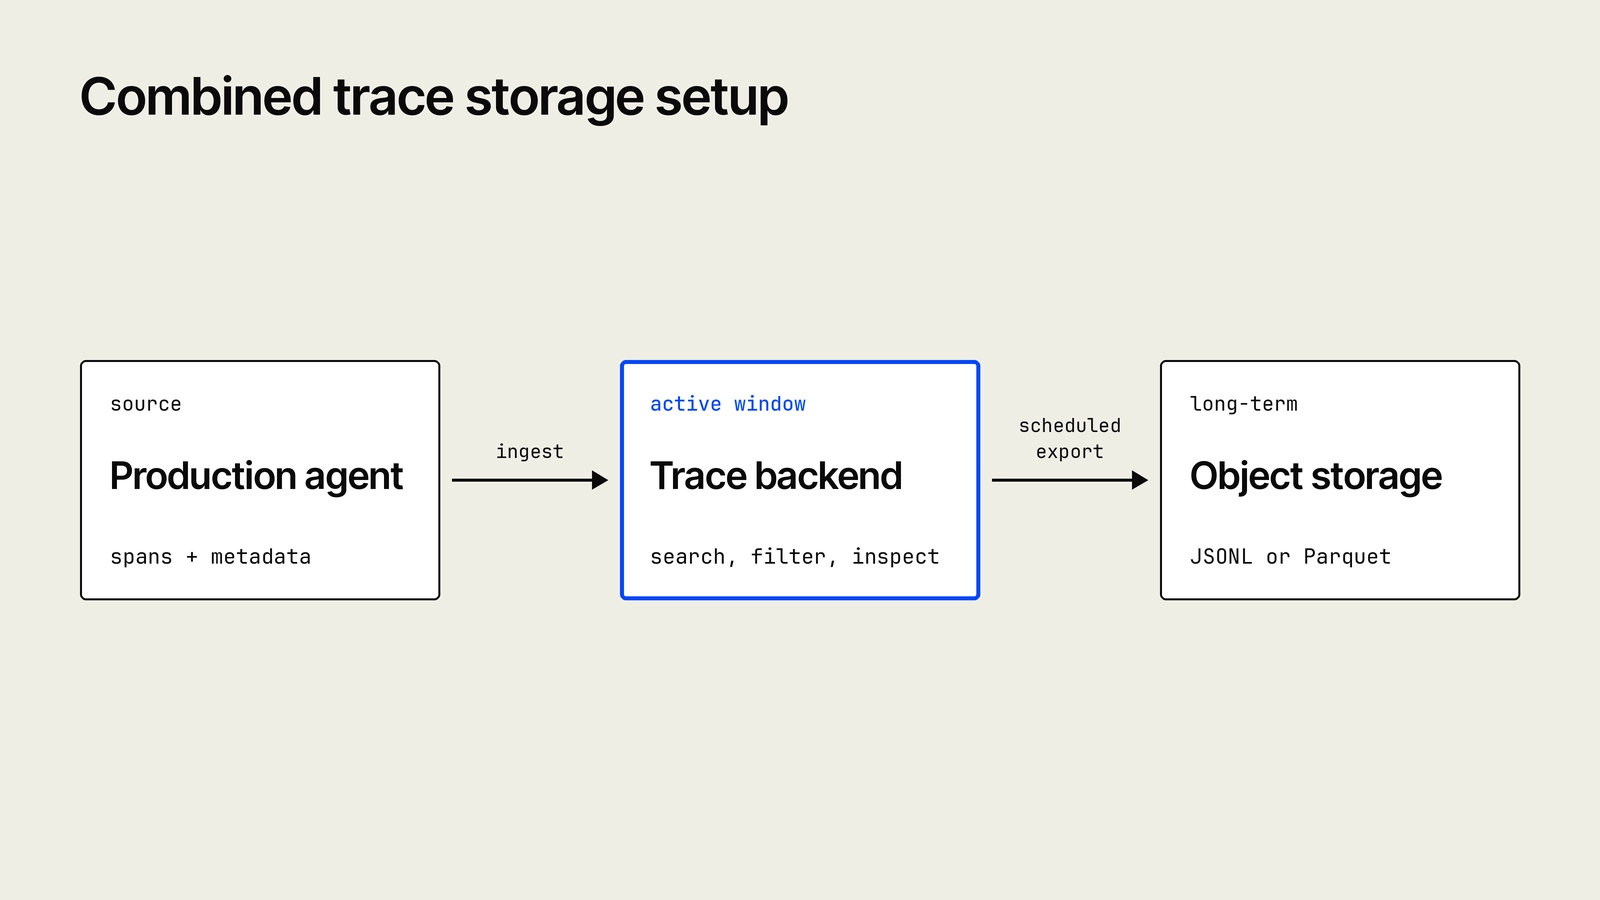
A trace backend supports active investigations, while scheduled exports preserve historical records in organization-controlled object storage.
Combined setup: Organizations can use a trace backend for active investigations and configure scheduled exports to preserve historical records in their own object storage. Exported records should retain trace and parent identifiers so the execution history can be reconstructed for long-term analysis. Archived records will still require query infrastructure when engineers need to search them.
Trace storage criteria: retention, export, access, and cost
Production failures may surface weeks after an agent run, and incident investigations may require records no longer available in the active trace backend. Four operational criteria help determine whether a storage system can support investigations over time.
Retention window: Keep traces long enough to investigate regressions that emerge after a release and collect production examples for future evaluations. Retention should reflect actual investigation timelines, including the time needed to diagnose failures and reproduce affected runs. Organizations with additional compliance requirements should establish separate policies for audit-ready LLM logging.
Export path: Exports should use formats supported by downstream analysis tools and preserve trace identifiers alongside parent-child relationships. Confirm that historical records can be exported on a schedule and reconstructed when an investigation extends beyond the active retention window.
Access and data location: Production traces may contain sensitive customer information within prompts and tool responses. Role-based permissions should restrict who can inspect and export records, while deployment options should support the organization's data residency requirements. For stricter isolation, hybrid deployment allows sensitive trace data to remain within the organization's cloud environment.
Ingestion cost model: Storage costs depend on how a provider measures usage. Byte-based pricing increases with large prompts and tool outputs, whereas record-based pricing increases with the number of spans generated by each run. Estimate expenses using actual production traffic and payload sizes, including any additional retention charges, before introducing sampling or truncation to control costs.
Trace storage evaluation checklist
Before committing to a storage system, test it with production-sized traces and realistic query volumes. The evaluation should establish whether engineers can retrieve complete executions and investigate failures within an acceptable time, including when records contain large payloads or approach the retention limit.
-
Open a trace by ID: Retrieve a known agent run and verify that the complete span tree is available with its original inputs and outputs. Missing spans or truncated content should be identified during the test.
-
Find traces by phrase: Search for a sentence from a user complaint and measure how quickly the relevant execution appears. Run the search against production-scale data so the timing reflects what engineers will see during an incident.
-
Combine metadata and span conditions: Filter by user ID and a specific span condition, such as an LLM call containing an error. Check that the query matches the intended span without returning unrelated executions.
-
Inspect the largest traces: Open runs containing lengthy prompts or substantial tool outputs to check payload completeness and trace viewer responsiveness.
-
Test the retention boundary: Retrieve records approaching the end of the retention window to establish when historical traces become unavailable for investigation.
-
Export a filtered set: Export traces associated with a specific user and verify that the original trace and parent identifiers survive. The exported records should retain enough information to reconstruct the execution history.
-
Check indexing freshness: Generate a new production trace and measure the delay before it becomes searchable. The result should meet the team's requirements for investigating active incidents.
-
Verify access controls: Use an account with restricted permissions to check that sensitive projects and their traces remain inaccessible. Test export permissions separately to ensure users cannot retrieve data beyond their authorized scope.
Storing and searching agent traces in Braintrust
Braintrust brings production trace storage and investigation into the same environment through Brainstore. Engineers can search across recorded executions and open the corresponding agent run directly from the results, with the original span relationships available for inspection. Brainstore provides the underlying storage and query infrastructure, while Braintrust adds the tools needed to investigate production behavior.
Brainstore for AI trace data
Brainstore is a database that stores and indexes large, semi-structured AI records. Its storage architecture uses object storage with an inverted index and column store based on Tantivy to support full-text search and filtering. Related spans are placed in the same physical index, and a write-ahead log makes new records queryable as soon as they are written. Brainstore also partitions each organization's data separately.

Braintrust tested Brainstore against a competing system using 3.9 million traces and reported full-text search times of 401 ms versus 9,587 ms. The same benchmark reported span loads 3.73 times faster. These results describe that test workload; query times depend on the data and query.
Large payload handling and attachments
Braintrust supports logging uploads of up to 20 MB per span. For larger transcripts or document collections, use JSONAttachment to store large trace payloads separately while keeping them accessible through the trace viewer. Attachment contents are excluded from search and filtering, so metadata needed for investigations should remain inline.
Braintrust also automatically converts supported inline base64 media from OpenAI and Anthropic requests into attachments. Google and AWS Bedrock request formats are handled as well, with client-side conversion available in the SDKs that offer it. Engineers can inspect the resulting media within the associated trace without manually uploading each file.
Trace search and metadata filtering
The Logs search interface supports full-text search and structured filtering. Basic filters provide point-and-click conditions, while SQL filters allow engineers to combine more precise expressions across recorded fields. With the row type set to Traces, Basic filters automatically evaluate conditions across the spans within each execution.
For example, an engineer investigating failed LLM calls can use the following filter to find traces where an LLM span contains an error.
ANY_SPAN(span_attributes.type = 'llm' AND error IS NOT NULL)
Both conditions are evaluated against the same span because they appear inside a single ANY_SPAN() expression. Using separate ANY_SPAN() expressions would also match traces where the LLM call and error occurred in different spans.
Application metadata can narrow the results further. For example, the following filter isolates production records associated with a particular model:
metadata.environment = 'production' AND metadata.model = 'gpt-5-mini'
Engineers can also search across all text fields using search('timeout') or target a particular field with output MATCH 'timeout'. When a trace ID is already known, filtering by root_span_id provides direct indexed retrieval of the complete execution. Individual spans can be retrieved using their id field.
For repeated investigations, Braintrust provides additional search optimizations for frequently queried metadata fields and multi-word phrases. The same query capabilities are accessible through bt sql in the terminal and the /btql API, which supports JSON and Parquet responses. Loop also allows team members to describe an investigation in natural language and find relevant traces without writing SQL manually.
Trace inspection in the trace viewer
Opening a search result brings up the trace viewer, where engineers can examine the recorded execution through several layouts. Spans display the nested call graph with duration and token usage attached to individual operations. Estimated costs also roll up through parent spans, helping engineers identify which parts of an agent run consume the most resources.
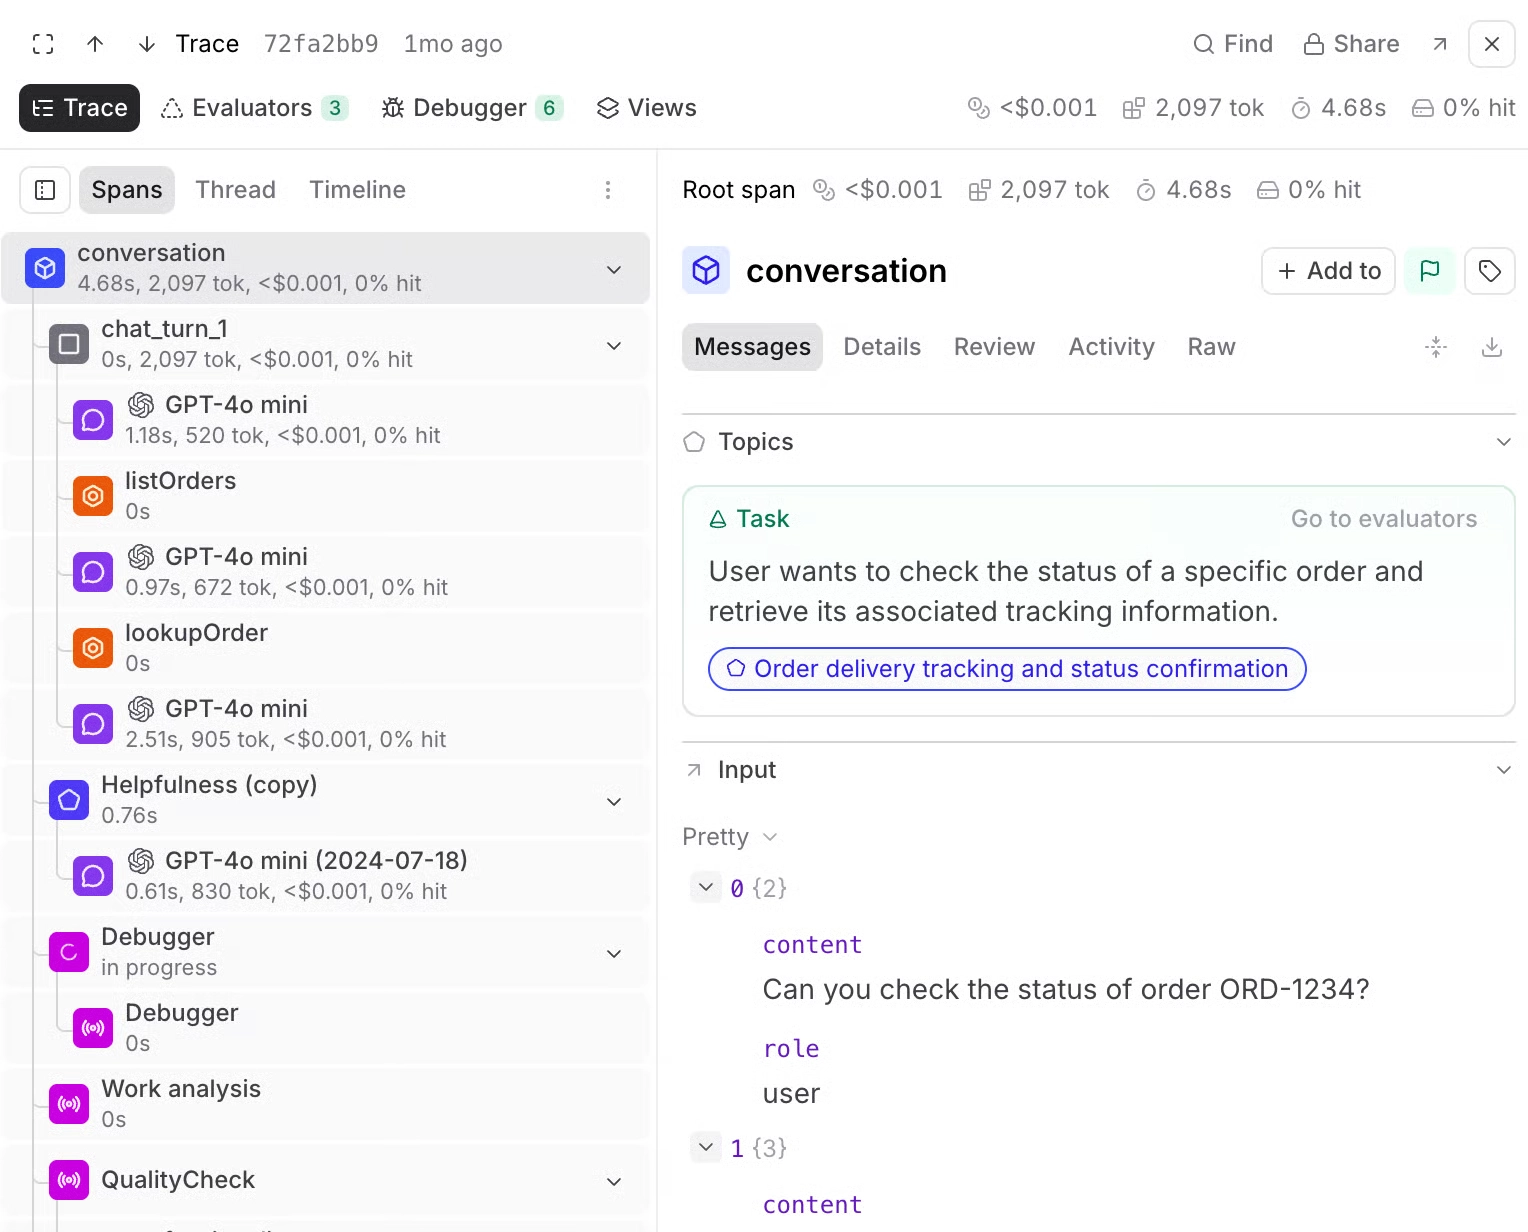
Thread presents the execution as an ordered conversation, while Timeline shows execution flow and token distribution. For longer production runs, Debugger uses Loop to investigate likely failure causes and cite supporting evidence from the trace.
The Raw tab exposes the complete JSON representation of an individual span or the entire trace. Engineers can search within an open execution using Find and share a stable trace URL identified by its root_span_id.
Retention, export, and deployment options
Braintrust supports configurable log retention and export options to keep production traces available for historical investigations. Organizations with extended retention requirements can extend their retention window or use scheduled exports to Amazon S3 for long-term storage. Custom retention policies shorten retention; they do not extend the organization's retention window. Cloud storage exports are an Enterprise feature. Role-based access controls help restrict access to sensitive records, while enterprise deployment options let organizations host the data plane within their own cloud infrastructure.
Notion adopted Brainstore to search specific tool calls and error patterns across large AI traces.
Store and search production agent traces with Braintrust →
FAQs about LLM trace storage (2026)
Where should production LLM traces be stored?
A searchable trace backend is generally suitable for day-to-day debugging because engineers can retrieve individual executions and investigate failures directly. Organizations that require longer retention can maintain an additional archive in object storage, provided the export preserves enough information to reconstruct complete runs. The storage location should also meet the organization's security and data residency requirements.
Should you sample LLM traces in production?
Sampling reduces ingestion volume at the cost of gaps in production history. Head sampling decides at the start of a request, before any later step can fail, while tail sampling can prioritize errors but still discards runs that looked successful, including confidently wrong answers a customer reports days later. Estimate ingestion costs against real production traffic and payload sizes before deciding; if volume still needs controlling, tail sampling with error prioritization keeps more debugging evidence than head sampling.
Can you store LLM traces in S3 and still search them?
Traces in S3 become searchable once an index and query layer sit on top of the bucket. Services such as Amazon Athena can query structured records, but interactive text search and trace inspection need additional infrastructure, and reading a single run means rebuilding the span tree from parent IDs. Brainstore keeps data on object storage and adds an inverted index and write-ahead log so that layer comes built in.
What happens when an LLM trace exceeds the size limit?
The outcome depends on the storage backend and its configured limits. An oversized span may be rejected or truncated, leaving engineers with an incomplete execution record. Braintrust supports spans up to 20 MB and provides JSONAttachment for storing larger JSON payloads separately. Attachment contents remain accessible through the trace viewer but cannot be searched or filtered directly, so important search fields should remain in the span.
How long should LLM traces be retained for debugging?
Retain traces long enough to investigate failures that surface after a release. Contractual retention requirements and the time needed to turn important failures into evaluation datasets extend that window further. Traces that need longer retention can move to an archive, provided engineers confirm the archived records stay retrievable when an investigation calls for them.