

An agent trace is useful only when another engineer can reconstruct what happened without rerunning the agent or reading its source code. A trace that records only the user request and final response hides the model calls, tool execution, retries, and failures that produced the answer.
A good trace mirrors the agent’s execution through clearly named and nested spans, with enough information on each step to explain what it received, what it returned, and how it affected the run. Inputs and outputs establish what happened, while per-span timing, token usage, errors, and consistent metadata help engineers locate slow or failed operations and find related runs later.
This guide explains how to evaluate agent traces across span structure, recorded context, tool payloads, latency, errors, retries, and metadata. It also shows how Braintrust uses Spans, Timeline, and Thread views to reveal missing nesting, unrecorded execution time, and model calls that were never captured.
What makes an AI agent trace useful
An agent trace records one run as connected spans, with each span representing a unit of work such as a model call, tool invocation, retrieval step, or application function. Understanding how to read a trace starts with those span relationships, but trace quality depends on whether an engineer who did not build the agent can reconstruct the run and explain the outcome from the recorded evidence alone.
What ran: The trace should show each model call, tool invocation, retrieval step, and handoff in execution order. Clear names and nesting make it possible to follow the agent’s path, identify repeated steps, and see which operation triggered the next one.
What each step received and returned: Inputs and outputs should preserve the information needed to explain how one operation affected the next. Model spans need the messages the model received, while tool spans need the arguments passed and the results returned, so an incorrect answer can be traced back to the step where the relevant information changed.
Where time and errors accumulated: Per-span timing, token usage, and errors connect performance or failures to a specific operation. A retry or fallback can allow the overall run to succeed, but the original failure should remain visible on the span where it occurred.
A practical quality check is to give the trace to an on-call engineer or teammate who did not work on the agent. If they need to inspect source code, rerun the request, or ask the original author what a span represents, the trace is missing information needed for independent investigation.
Also read: How to trace and debug AI agents in production
Incomplete vs. useful agent traces
Consider an order-status agent handling the request, “Check on order 4471 and tell me whether I can still return it.” The agent looks up the order, checks the carrier status and returns policy, retries a timed-out carrier request, and eventually tells the customer that the 14-day return window has closed. The order is shipping to Germany, where the applicable policy allows 30 days, so the final answer is incorrect even though the run completes successfully.
Incomplete trace: The root span records the customer message, final reply, and total duration, but most of the execution is missing. The entire agent loop sits inside one child span, the tool spans contain no arguments or results, and the failed carrier request never appears because it ran inside an untraced helper function. The trace also lacks user, session, environment, and version metadata, making related production runs difficult to locate later.
Useful trace: The complete trace separates the run into three model calls and four tool spans, with each step preserving the information needed to explain its outcome. The search_returns_policy span shows that the model submitted region: "US" even though the earlier lookup_order result identified Germany as the shipping country. The trace pins the incorrect policy lookup on the model decision that selected the wrong region. It also records the first get_carrier_status attempt ending in a timeout before the retry succeeds, accounting for two seconds of the run’s latency.
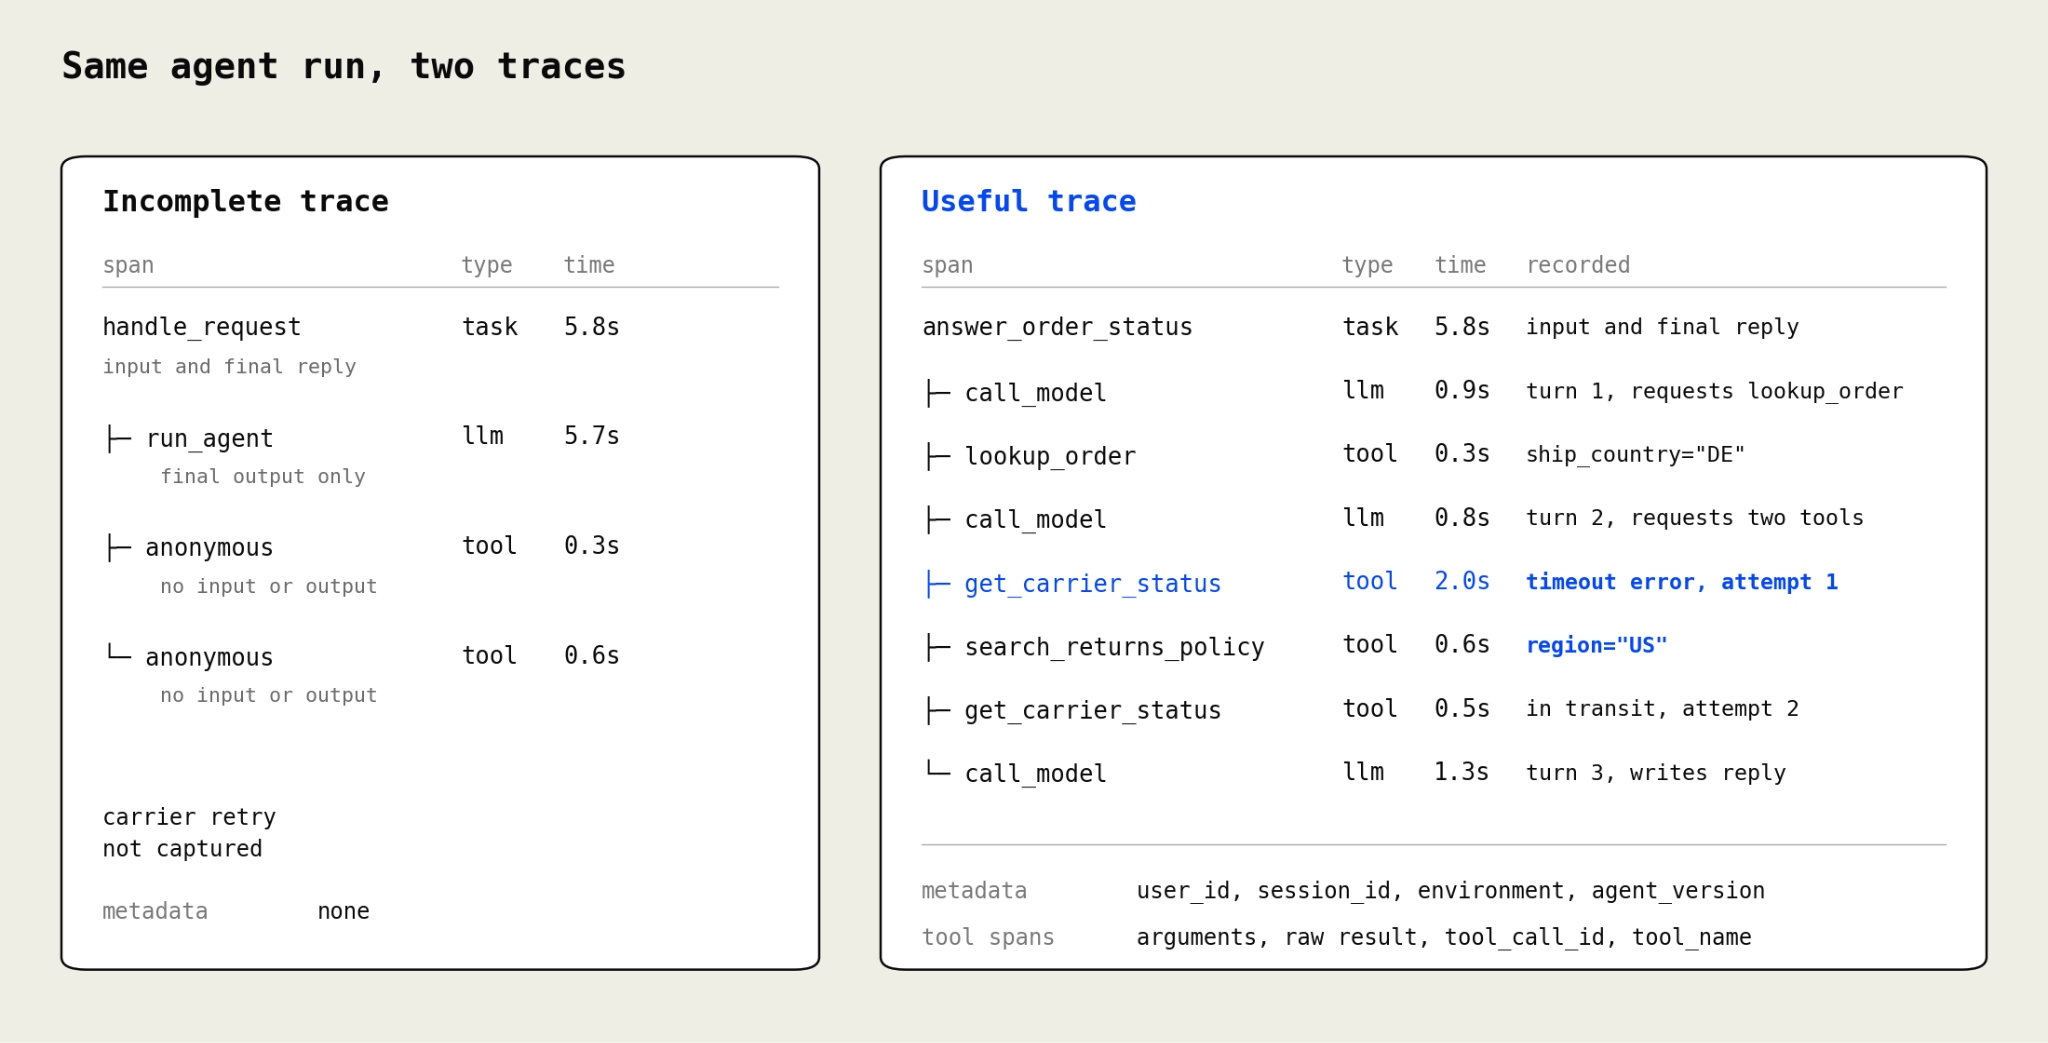
The same order-status run recorded with incomplete instrumentation and with the model, tool, retry, and metadata details needed for investigation.
Those two spans also keep the quality failure and the performance problem apart, so an engineer investigating the wrong answer never has to untangle it from the timeout.
Agent trace structure and span hierarchy
A useful trace should make the agent’s execution understandable from the span tree before an engineer opens individual records. Clear boundaries, stable names, correct span types, and consistent parent-child relationships allow the tree to reflect how the run progressed.
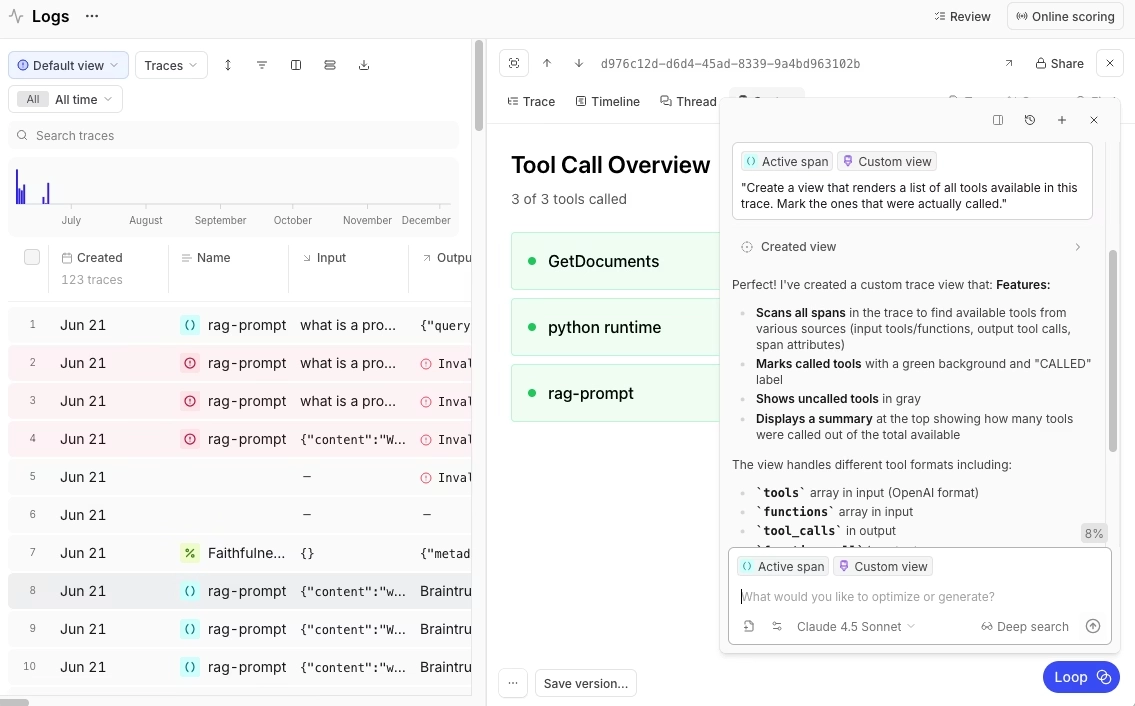
Braintrust displays model and tool operations as nested spans so the trace tree follows the agent’s execution path.
Set span boundaries around meaningful operations
Each model invocation should have its own span, positioned alongside the tool calls and other operations it triggered. In the order-status example, three model spans preserve the decisions to look up the order, retrieve tracking and policy information, and compose the final response. Recording the entire agent loop inside one span would hide how each tool result influenced the next model call and make context growth difficult to explain.
Span boundaries can also become too granular. Low-level HTTP requests, database-driver activity, and framework internals add rows without helping an engineer understand the agent’s decisions. A useful boundary should correspond to an operation someone would naturally name when describing the run, such as looking up an order or searching the returns policy.
Use stable, descriptive span names
Consistent span names make the execution tree readable across individual runs and searchable across production traffic. Names such as lookup_order, search_returns_policy, and call_model describe the work performed and allow filters, scorers, or saved views to target the same operation repeatedly.
Dynamic values belong outside the span name. Adding an order number, retry count, or model name creates a different name on each run and breaks grouping across traces. Store those values as metadata while keeping the operation name stable. A trace filled with anonymous spans creates a similar problem because the tree no longer communicates what each operation did.
Assign the correct span type
Braintrust uses span types such as llm, tool, function, and task to distinguish different kinds of work in a trace. An LLM span can expose model messages, token usage, and cost, while a generic function span focuses on the function’s inputs and outputs. Correct typing shapes both what engineers see in the trace viewer and how precisely they can search recorded operations.
For example, combining span_attributes.type = 'llm' with an error condition isolates failures recorded specifically on model calls, which is much more useful than filtering every failed operation in the trace together.
Preserve parent-child relationships across tools and handoffs
Parent-child relationships should show which operation triggered each subsequent step. Tool spans can sit beneath the model call that requested them or alongside that model span under the same agent step, as long as the convention remains consistent. When several tools run during one turn, custom LLM tracing can preserve identifiers such as tool_call_id and tool_name, making it possible to match each tool execution with the model request that initiated it.
Sub-agent and cross-service work should remain connected to the original run as well. When execution moves to another service, trace context propagation keeps the downstream work attached to the same trace. Lost context usually appears as orphaned tool spans, a new trace beginning at a service boundary, or parent-span duration that the recorded child spans cannot account for.
Span inputs, outputs, and tool payloads
Clear span names and hierarchy show what the agent executed, but an investigation also needs the data that moved between those operations. Recording the relevant input and output on each span allows an engineer to follow how information changed throughout the run and identify where an incorrect value, missing field, or misleading result entered the execution.
Keep the root span readable
The root span should make the overall request understandable at a glance by recording the user’s input and the agent’s final response. In the order-status example, the customer’s question and the final answer belong at the root because they establish what the agent was asked to do and what it ultimately returned.
Large serialized request objects, headers, and routing details can obscure that information when placed directly in the root input or output. Operational fields that may still be useful during investigation can live in structured metadata, leaving the root record focused on the interaction an engineer needs to explain.
Record the complete model context on LLM spans
Each LLM span should preserve the messages the model actually received on that call, including the system prompt, relevant conversation history, and tool results added during earlier steps. Because the context changes after each tool invocation, recording only the final prompt makes it impossible to establish which information influenced an earlier model decision.
Model configuration belongs on the same span. The model name, temperature, available tools, and other request parameters help explain why otherwise similar calls may behave differently. When wrapping a custom LLM client, log the provider-formatted request messages and response content on the LLM span so the trace reflects what the model received and returned.
Preserve tool arguments and raw results
Each tool span should record the arguments generated by the model alongside the result returned by the tool. This separation makes tool-call failures easier to locate because an engineer can distinguish an incorrect model-generated argument from a tool that produced the wrong result for a correct input.
In the order-status run, search_returns_policy correctly returns the US policy because the model supplied region: "US". The fault sits with the earlier model decision that chose the wrong region. If the tool had received region: "DE" and still returned the US policy, the same trace would place the problem inside the tool implementation.
When application code trims, transforms, or reformats a tool result before passing it back to the model, preserve both the raw result and the transformed version. Comparing them can show whether preprocessing removed information the next model call needed.
Capture retrieved context and intermediate state
Retrieval, memory access, and shared-state updates need their own spans when they influence later agent decisions. A retrieval span that records both the query and returned documents can show whether an answer relied on stale or irrelevant context, while a state-update span establishes what information the agent carried into subsequent turns.
Across the trace, every consequential span should provide enough evidence to establish what the operation received, what it produced, and whether the output was appropriate for that input. When a span cannot answer those questions on its own, the fix is more context on the span, a more specific child span, or an additional metadata field.
Latency, token usage, and errors in agent traces
Root-level totals can show that an agent run was slow, expensive, or unsuccessful, but they do not identify the operation responsible. Per-span timing, usage, and error data connect each symptom to the model call, tool execution, or retry that produced it.
Span latency: Start and end timestamps establish how long each operation took and where it occurred in the run. On LLM spans, LLM call observability can capture time to first token alongside total latency and output tokens per second, helping separate the initial wait from response generation and expose gaps where child spans do not account for the parent span’s full duration. If a parent runs for four seconds while its recorded children account for only two and a half, the remaining time points to work the trace did not capture, such as queueing or an uninstrumented function.
Parallel execution: Overlapping spans should be read on a shared time axis because summing child durations can overstate wall-clock time. In the order-status run, search_returns_policy overlaps with the first get_carrier_status attempt, while the carrier timeout and retry account for 2.5 seconds on the critical path. Braintrust’s Timeline view makes concurrent work visible and separates overlapping operations from those that actually extend total latency.
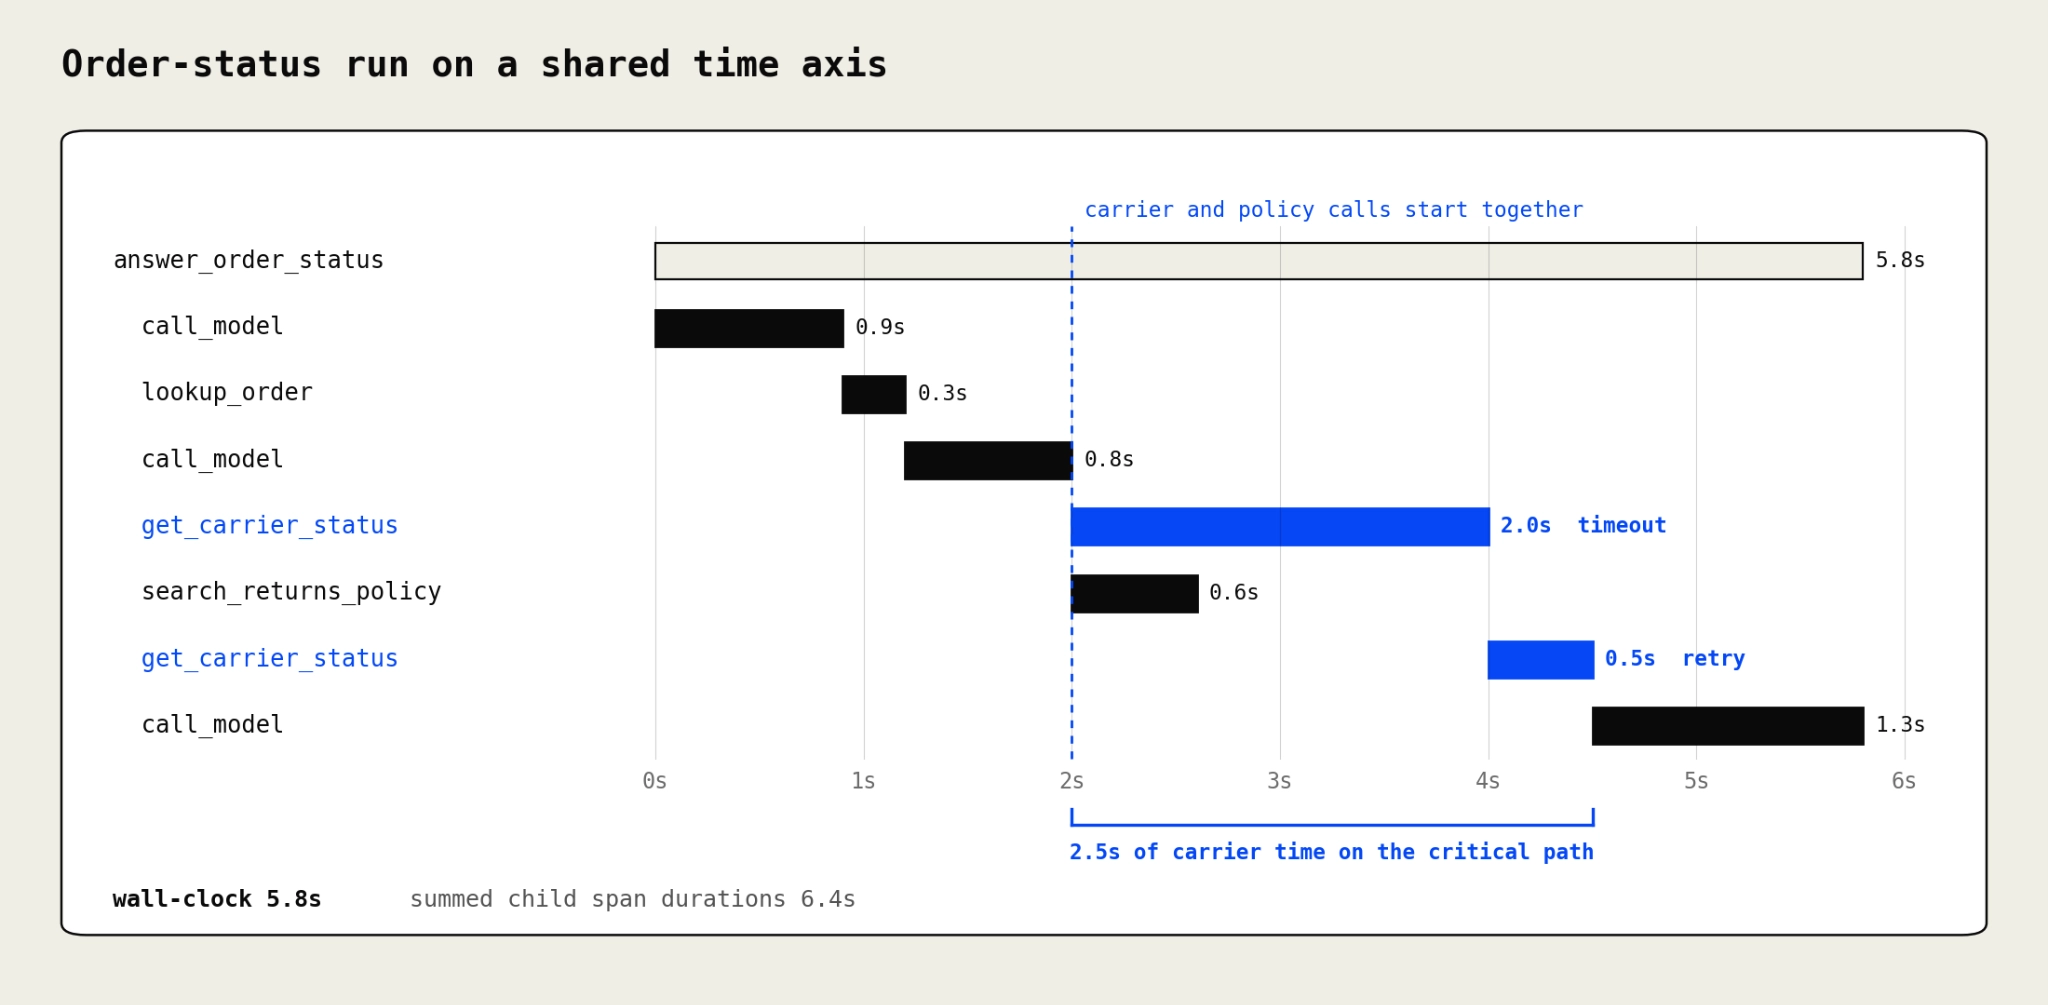
The policy lookup overlaps with the carrier request, while the timeout and retry add 2.5 seconds to the critical path.
For Python applications that execute tools in worker threads, span context also needs to survive the handoff. Braintrust’s TracedThreadPoolExecutor preserves the active parent context so concurrent tool spans remain attached to the operation that launched them.
Token usage and cost: Recording prompt, completion, and cached-token usage on individual LLM spans shows how consumption changes as an agent moves through its loop. A sharp increase in prompt tokens between model calls can point to a large tool result added to the next request, and the corresponding tool span shows what content caused that increase. Braintrust rolls estimated cost through the span tree, so an engineer can trace total request expense down to the individual model calls behind it.
Errors, retries, and fallbacks: Failures should remain attached to the span where they occurred, even when the agent recovers and returns a successful response. Braintrust records exceptions inside traced application logic, while failures that do not raise an exception can still be written to the span’s error field. Once recorded, those errors can be filtered across production traffic, so a recurring timeout or retry pattern shows up without opening individual runs.
Each retry should receive its own span so the trace retains both the failed attempt and the successful recovery. In the order-status example, the first get_carrier_status call times out after two seconds before the retry succeeds. Recording only the successful attempt would leave part of the run’s latency unexplained. Fallback paths need the same visibility, with the fallback operation recorded separately and the reason for using it stored as metadata.
Agent trace metadata: user, session, environment, and version
A well-structured trace still becomes difficult to use when engineers cannot find it among thousands of production runs or compare it with related requests. Consistent metadata makes traces searchable by the context that shaped the run, including the user, conversation, environment, application version, and active experiment configuration. Braintrust stores metadata as key-value fields on spans, so teams can filter production traces by specific metadata values.
User and session identifiers
User IDs connect individual traces to the person who triggered them, so a support escalation becomes a targeted search for that customer's production runs. Session IDs provide the broader conversational context by linking related turns from the same interaction. For a multi-turn agent, the session link shows how earlier responses, tool results, or state changes shaped later behavior, so an engineer can investigate the related turns together. Recording a session ID alone does not merge separate traces into one run.
For conversational applications, the same identifiers also make it easier to evaluate behavior across an entire multi-turn conversation when a failure depends on context accumulated over several exchanges.
Environment and request context
Environment metadata separates production, staging, and development traffic so test runs do not distort production analysis. Request IDs can connect the AI trace with gateway logs, APM data, or a support ticket describing the same incident, giving engineers a path from the user-facing problem to the corresponding agent execution.
Feature flags and experiment variants belong in the same request context because two runs of the same agent may behave differently even when the visible input is identical. Recording the active variant on the trace puts the configuration in the filter, so engineers can compare runs by variant and never have to guess which one was live.
Prompt, model, and agent versions
Version metadata identifies the configuration responsible for each run. With the prompt version, model, and code or agent version recorded, traces from before and after a release can be compared directly, and a regression can be tied to the change that introduced it. In the order-status example, filtering by release version could show whether incorrect return windows existed before a deployment or began only after the new configuration reached production.
Prompt changes deserve the same traceability as code changes. Braintrust’s prompt versioning keeps prompt revisions identifiable across evaluation and production, so an output can be associated with the configuration that generated it.
Keep metadata keys consistent
Metadata stays useful across services only when every component uses the same keys and values. Logging user_id in one service and userId in another splits the same customer’s history across separate fields, while mixing prod and production divides traffic that should belong to the same environment.
Defining a small set of required fields and attaching them to the root span at the beginning of every run keeps traces comparable across services and releases. Braintrust filters on specific metadata fields and array elements, so structured metadata can be queried the same way across logs and experiments.
Agent trace capture limits
Even a well-instrumented trace has limits on the evidence available for investigation. Missing information may result from incomplete tracing, unsent spans, deliberate masking, payload limits, or activity that the model never exposes through its API. Distinguishing among those causes prevents engineers from treating every absent field or unexplained interval as an application failure.
Missing instrumentation and unflushed spans: Braintrust auto-instrumentation covers supported provider and framework calls, and application-logic tracing extends coverage to custom retrieval functions, business rules, transformations, and other operations outside those integrations. Custom work left untraced appears as unexplained time inside the parent span and removes the inputs or outputs needed to understand how the operation affected the run.
Trace data may disappear even when the relevant code is instrumented if initialization or shutdown is incomplete. Braintrust’s tracing quickstart covers the setup required to initialize tracing and verify that spans reach the project. The Braintrust SDK buffers logs before sending them, so short-lived processes may exit with records still pending. Runtimes that manage shutdown explicitly may need to flush pending logs before the process ends.
Redacted and masked payloads: Agent traces may contain personal data, credentials, payment details, or other values that should not reach the logging backend in raw form. Braintrust supports masking sensitive data before logging across fields including input, output, expected, metadata, and context.
Useful masking preserves enough structure to show what kind of information moved through the run. An email field containing [EMAIL], for example, still shows that the customer supplied an address and that the downstream operation received one. Removing the field entirely makes deliberate redaction difficult to distinguish from missing instrumentation.
Truncated and oversized payloads: Long transcripts, large document sets, and verbose tool results may exceed normal logging limits. Braintrust documents a 20 MB per-span limit for individual logging upload requests and supports large JSON payloads through JSONAttachment. The JSON remains viewable from the trace after separate upload, but attachment data is not indexed for search or filtering, so values required for production queries should remain in inline metadata.
Application code, framework integrations, or collectors may shorten a payload before Braintrust receives it. Intentional truncation should leave evidence such as truncated: true and the original payload length, giving engineers a clear indication that the displayed value represents only part of the original data.
Recorded activity and unobserved model reasoning: Braintrust traces LLM calls with observable data such as model inputs, outputs, parameters, usage, and timing. In the order-status example, the second model call received Germany in its input and returned region: "US". The trace therefore identifies the model call where the incorrect value appeared without claiming to expose the internal process that produced the decision.
Reasoning summaries provide additional model-generated context, but they do not establish the complete internal decision process. A stronger investigation uses the recorded evidence to check whether the required information appeared in the input, whether the prompt explained how to use it, and whether another instruction or tool result influenced the output. The diagnosis then stays grounded in evidence preserved in the trace.
Inspecting agent trace quality in Braintrust
Braintrust opens each agent run in a trace viewer with layouts for different parts of an investigation:
-
Spans show the execution hierarchy.
-
Timeline maps timing and concurrency.
-
Thread reconstructs the chronological conversation.
-
Debugger analyzes complex failures from the recorded trace evidence on project logs traces.
The trace viewer is available across Logs, Experiments, and Review, keeping production and evaluation traces in a consistent inspection workflow. Debugger and Analyze trace are available on project logs traces; they do not appear on experiment or dataset traces, or in embedded and human review contexts.
Step 1. Check the execution structure in Spans
Start with span boundaries, names, types, and parent-child relationships to confirm that the recorded tree matches the agent’s execution. Inline duration, token, estimated LLM cost, and hit-rate metrics add enough context to spot expensive or unusually slow operations before opening their details. Anonymous rows, orphaned tool calls, or one LLM span covering several turns usually indicate that the instrumentation needs more precise boundaries.
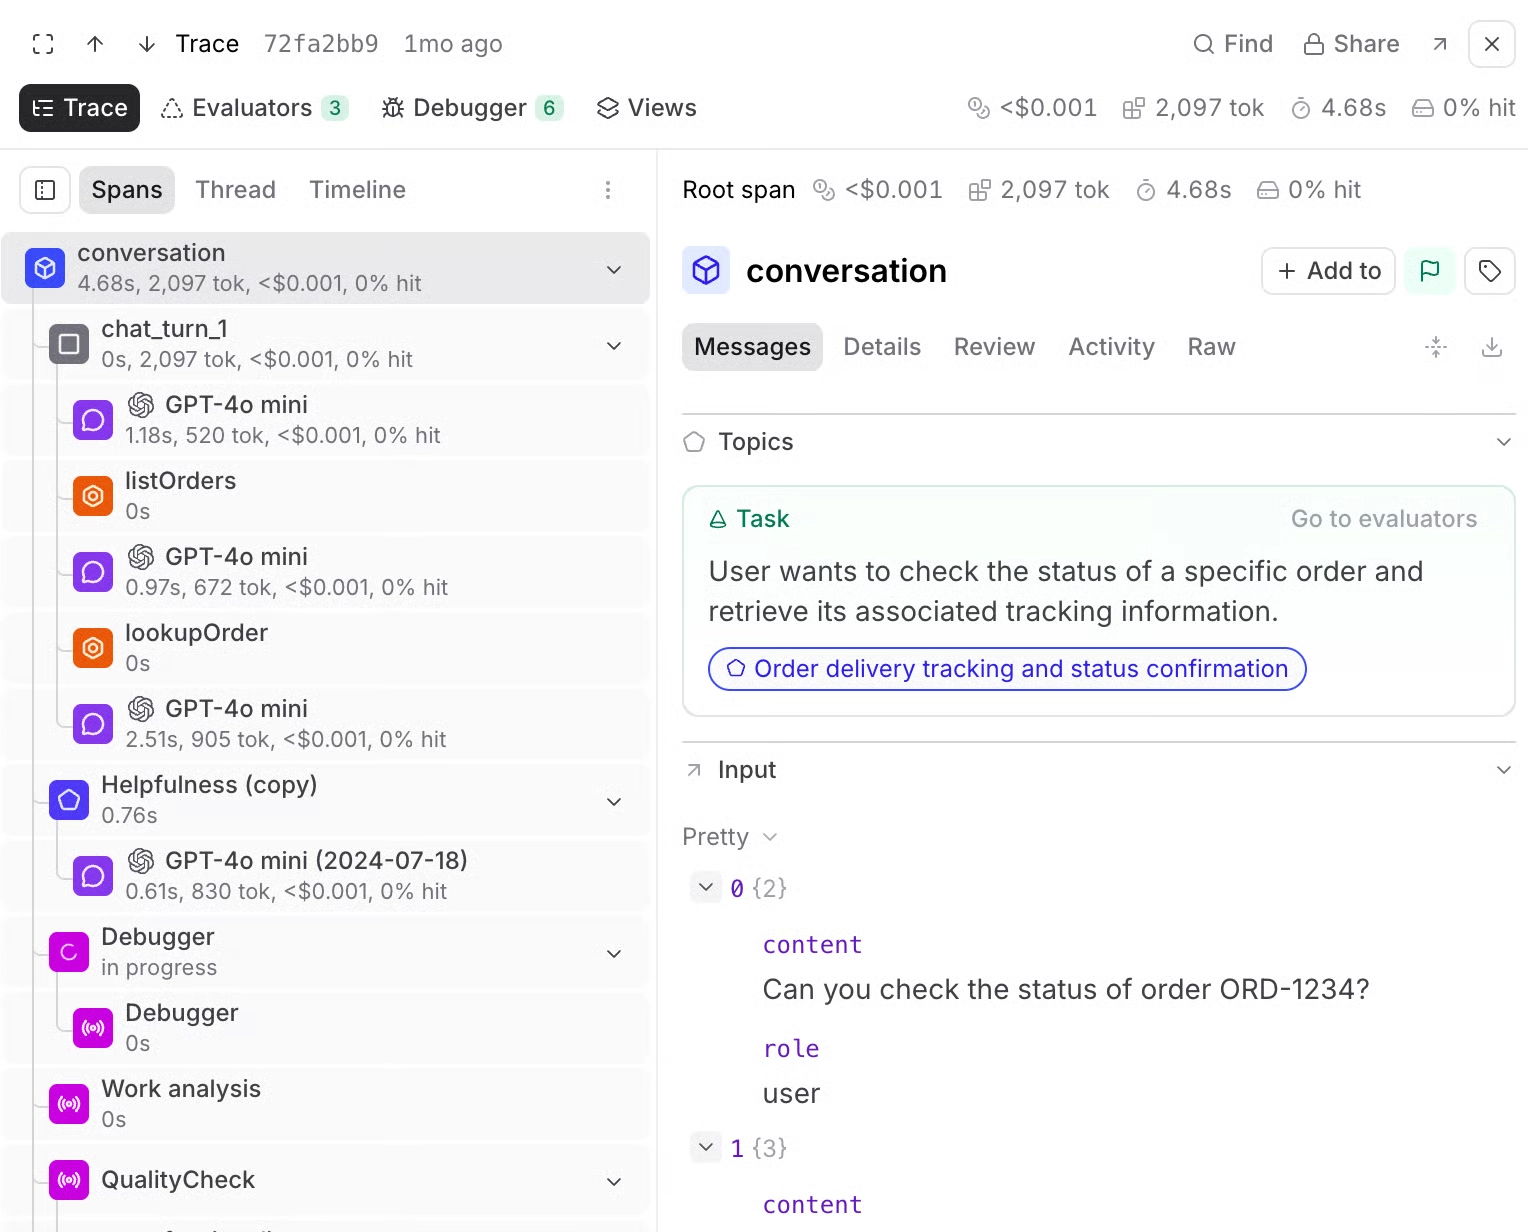
The Spans view shows the execution hierarchy with duration, token usage, and cost alongside individual operations.
Step 2. Use Timeline to investigate latency and usage
A shared time axis makes concurrent calls, retries, and unexplained gaps visible without manually comparing span timestamps. The bars can be scaled by duration, total tokens, prompt tokens, completion tokens, or estimated cost, and the token distribution view separates uncached input, cached reads, cache writes, and output for individual LLM spans.
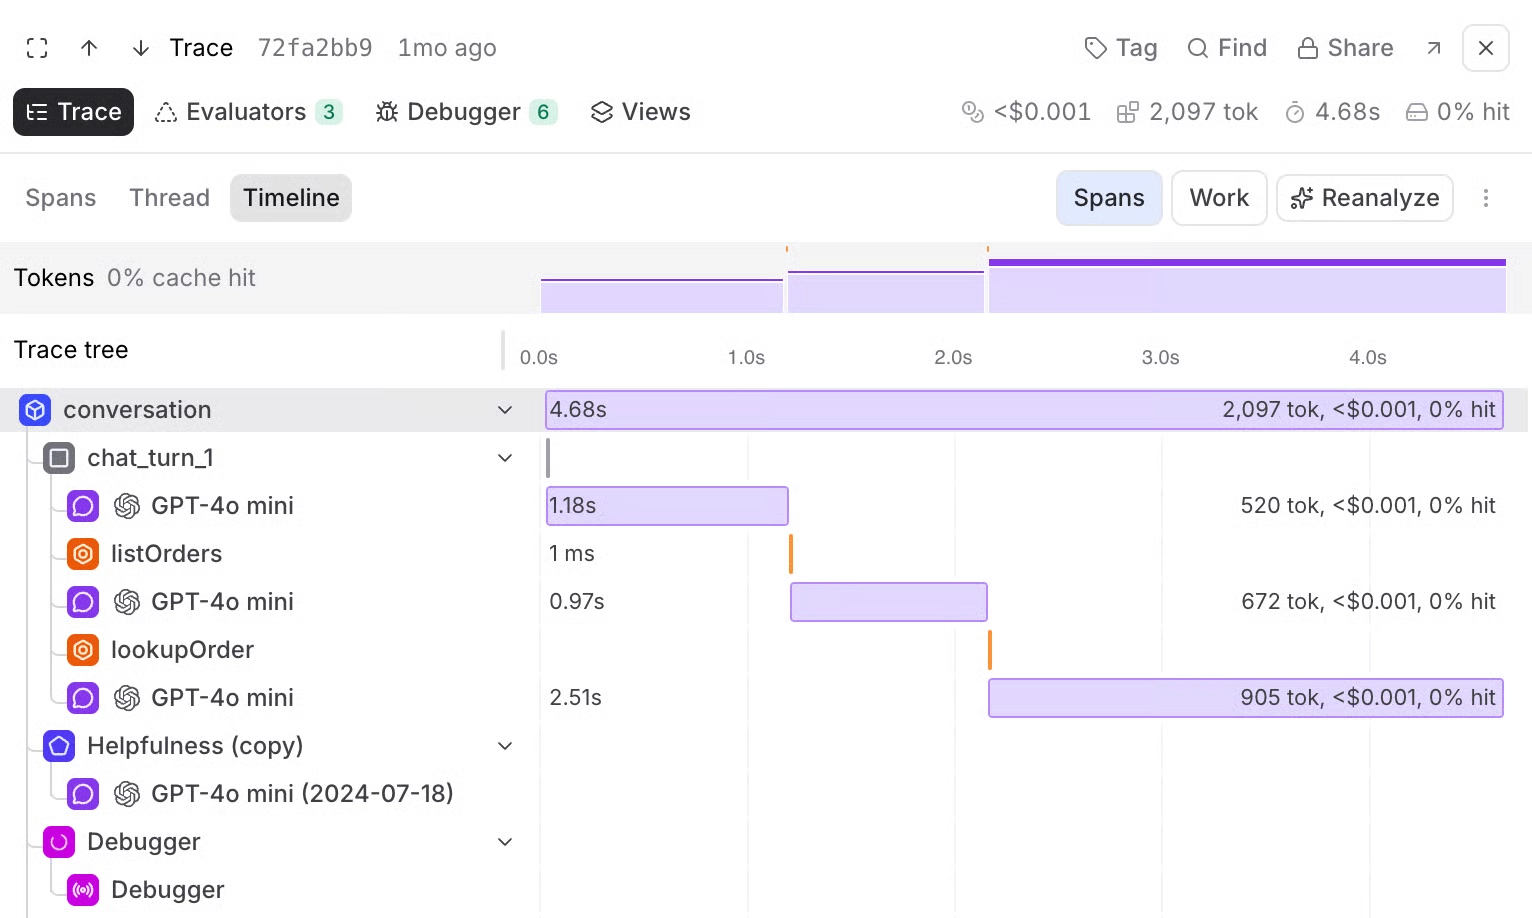
Timeline reveals concurrent execution, latency concentration, and token distribution across the run.
Step 3. Verify the recorded evidence
Opening an individual span exposes its messages, tool calls, errors, metadata, metrics, and parameters, while the Raw view provides the underlying JSON for the selected span or complete trace. Thread view is useful when the investigation depends on the order of model messages and tool interactions. If model calls were never captured, Thread view flags the missing LLM spans directly, so the engineer sees an instrumentation gap where the conversation would otherwise just look incomplete.
Find also searches the whole trace for a specific value such as an order number or error string, which narrows a long execution to the spans that mention it.
Step 4. Narrow production issues and investigate the failure
Braintrust’s log filters support fields such as metadata.user_id, environment, version, and other recorded metadata, allowing an engineer to move from a customer report to the relevant set of production traces. For a complex individual run, Debugger analyzes spans, tool calls, tool results, and model outputs to identify likely failure modes and ground each explanation in trace evidence.
Investigations that extend beyond one trace can continue in Loop. Teams can describe the issue in natural language, investigate patterns across production data, and carry confirmed findings into datasets or evaluators without requiring every collaborator to write analysis code.
Notion uses Braintrust’s tracing and observability workflows to find specific problems within large production traces and turn those failures into evaluation datasets for regression testing.
Start free with Braintrust and inspect your agent traces from execution structure through failure analysis.
FAQs: what makes a good AI agent trace (2026)
Should every LLM call in an agent loop be its own span?
Each distinct model invocation should generally have its own LLM span, including calls made inside tools or sub-agents, so latency, token usage, cost, and failures stay attributable to the call that produced them. A streamed response still represents one invocation and belongs in one span.
What metadata should every AI agent trace include?
Start with the fields needed to locate a run and compare it with related traffic: user and session identifiers, environment, and versions for the prompt, model, and agent. Add other fields only when a filter or grouping depends on them, such as a feature flag or customer tier. Braintrust log filters make those fields usable during production investigation.
Can an agent trace explain why the model made a decision?
A trace can establish the evidence surrounding a decision, but it does not expose the model’s complete internal reasoning. A stronger debugging workflow uses the recorded prompt, tool results, and model output to form a hypothesis, then tests the suspected change against the captured case, which a Braintrust dataset can hold as a permanent regression case.
How do you trace sensitive data without losing debugging value?
Mask sensitive values before trace data leaves the application, but preserve enough structure to follow the request across spans. A stable placeholder or pseudonymous identifier lets engineers correlate related operations without exposing the original value.
Does more instrumentation always make a trace more useful?
More instrumentation helps only when the added spans represent operations or decisions engineers may need to investigate. Low-level framework activity can make the execution tree harder to read, and large inline payloads can add unnecessary weight. Braintrust attachments keep larger data available from the trace while filterable values remain in structured metadata.