

An AI agent can confirm a subscription cancellation even when the billing system never completed it. The final response tells engineers what the agent claimed, but to understand what actually happened, they need to examine the tools it called and the results it received. Stored traces hold the evidence for that investigation.
Once engineers identify the affected run, they can search production history for similar behavior and determine how many recorded executions were affected. The investigation can then move beyond a single customer complaint to establish the scope of the problem, with findings limited to the execution data that was captured and retained.
Braintrust stores production agent traces in Brainstore and makes them searchable through full-text search and structured filtering. Engineers can inspect individual runs and query execution history to identify recurring behavior and measure its frequency.
Why production agent runs need investigation
A customer reports that a billing agent confirmed their cancellation, yet their card was charged again. The agent's response appears correct in the conversation log, and the run completed without errors or unusual latency. Standard monitoring signals provide little reason to investigate, even though the customer experienced a failed outcome.
Resolving the complaint requires establishing whether the agent called the cancellation tool, what the billing API returned, and whether other customers received similar confirmations. The first two questions help explain the individual case, while the third determines whether the problem extends beyond a single customer and requires a broader response.
Similar investigations arise in four situations:
Claimed actions: An agent reports that it issued a refund or updated a record. Verifying the claim means checking whether the corresponding tool ran and what result it returned.
Customer disputes: Support needs to locate the customer's exact execution and examine the recorded actions before determining what went wrong.
Post-release changes: Following a prompt or model update, engineers need to establish whether the agent still performs required steps, such as retrieving account details before modifying a subscription.
Security and compliance reviews: Reviewers may need to identify executions where an agent invoked a destructive tool without first recording the required user verification.
Also read: How to trace and debug AI agents in production
What agent traces record as execution evidence
A trace preserves the recorded steps of an agent run as connected spans. Each span represents an operation and contains the information captured during its execution. The LLM tracing structure connects model and tool calls through parent-child relationships, so an investigator can follow the sequence behind a response and examine the evidence at each step.
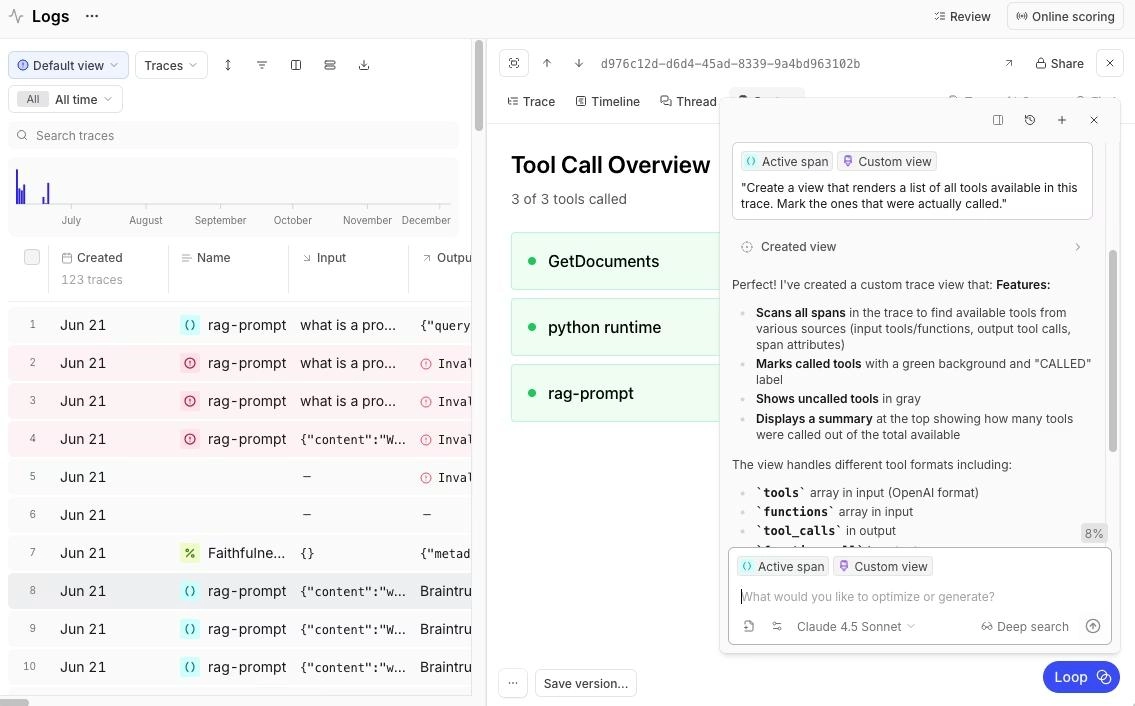
A Braintrust agent trace showing connected tool calls and their recorded execution details.
Tool arguments and results
A tool span records the arguments passed to a tool and the response returned. In the billing example, the cancel_subscription span can show which account ID the agent submitted and whether the billing API returned a confirmation ID or a status indicating that the cancellation was still pending.
An error field can also reveal exceptions encountered during execution. Comparing the submitted arguments with the returned result helps establish what the agent attempted and how the tool responded.
Model inputs and outputs
LLM spans capture the messages sent to the model and its generated response, along with configuration details and token usage. For an agent that uses tools, the recorded model calls can show which tool the model requested and how it responded after receiving the tool's output.
In the cancellation investigation, comparing the model's final message with the billing API's response reveals whether the agent accurately reported the outcome. A successful model call can still produce an incorrect confirmation when the model misinterprets a pending status.
Span identifiers and metadata
Braintrust assigns each span a unique id, while root_span_id connects spans belonging to the same trace. With these identifiers, an investigator can retrieve a single operation or reconstruct the full execution.
Application-defined metadata makes the relevant records findable. Logging a user ID connects runs to the affected customer, while session IDs and prompt versions help investigators distinguish conversations and identify the application configuration used during execution.
Limits of instrumented evidence
Agent traces can establish what the application recorded during execution, but investigators must account for four limitations when interpreting the evidence.
-
Uninstrumented code: Operations outside the tracing configuration leave no span. An absent tool span therefore cannot establish that the operation never occurred.
-
Masked fields: Data masking can remove sensitive values before transmission. A recorded cancellation call may show that an account ID was supplied without revealing the actual identifier.
-
Sampling and span filters: Collection policies may discard entire traces or individual spans, leaving gaps in the stored execution history.
-
Retention windows: Historical records become unavailable after the configured retention period, limiting how far back investigators can search.
Searching stored traces for agent actions
A customer complaint rarely includes a trace ID. Support may have an account identifier, an approximate time, and a description of the action the agent claimed to perform. A search on those details can still surface the relevant run and show whether the action was recorded.
Filter by tool name
A tool-name filter separates executions that called cancel_subscription from conversations where the agent merely discussed canceling a subscription. In Braintrust, select the Spans row type in Logs and apply a SQL filter such as span_attributes.name = 'cancel_subscription' to list matching operations directly. Clicking a span's name in the trace panel header copies it to the clipboard, making it easier to build the filter.
Full-text search
When the customer provides an error message or a phrase from the conversation, full-text search can locate matching records without requiring an exact identifier. Braintrust supports searching across all text fields or targeting a specific field through SQL filters.
The following expressions search for timeout across recorded text or specifically within span outputs.
search('timeout')
output MATCH 'timeout'
Braintrust stores traces in Brainstore, which supports full-text search across semi-structured AI records. Engineers can search recorded tool responses even when different tools return different data structures.
Filter by user and session metadata
A customer identifier narrows the investigation to executions associated with the affected account. When the application records user IDs as structured metadata, engineers can retrieve the relevant records using a filter such as:
metadata.user_id = 'user-123'
Session identifiers separate one conversation from another when a customer has several, provided the application records them consistently.
Narrow results by time
A time filter limits the search to executions recorded around the reported incident. Braintrust supports relative intervals, including the following expression for records created within the previous day.
created > now() - interval 1 day
Check the project's log retention settings before reading anything into an empty result. Hosted Braintrust excludes records outside the configured retention window without returning an error, so an unavailable historical trace may have aged out of storage.
Match conditions across traces and spans
Braintrust displays one row per trace by default, with the Spans row type available for inspecting individual operations. When searching complete executions, ANY_SPAN() allows conditions to match spans within the trace.
For example, finding traces where an LLM call itself failed requires both conditions inside the same expression:
ANY_SPAN(span_attributes.type = 'llm' AND error IS NOT NULL)
Separate ANY_SPAN() expressions can match different spans within the same execution. Keeping related conditions together prevents an unrelated error elsewhere in the run from being attributed to the LLM call. The same filtering logic can be applied to investigate specific tool failures.
Connecting tool calls to agent responses
Finding the relevant trace establishes which actions the agent recorded, but the investigation must also determine whether the actions matched the user's request and supported the final response. For the billing complaint, the comparison follows three steps.
Step 1. Compare tool arguments with the user's request
Start with the account the customer asked to cancel and examine the arguments passed to cancel_subscription. If the agent first called get_account, compare the account ID returned by the lookup with the ID submitted for cancellation.
A mismatch could indicate that the agent carried an identifier from an earlier conversation turn or selected the wrong account from retrieved context. Even a successful cancellation API response would not resolve the customer's request if the agent acted on the wrong subscription.
Step 2. Check whether the tool result supports the final response
Suppose the billing API returns pending_review because the customer has an outstanding invoice, but the agent tells the customer their subscription has been canceled.
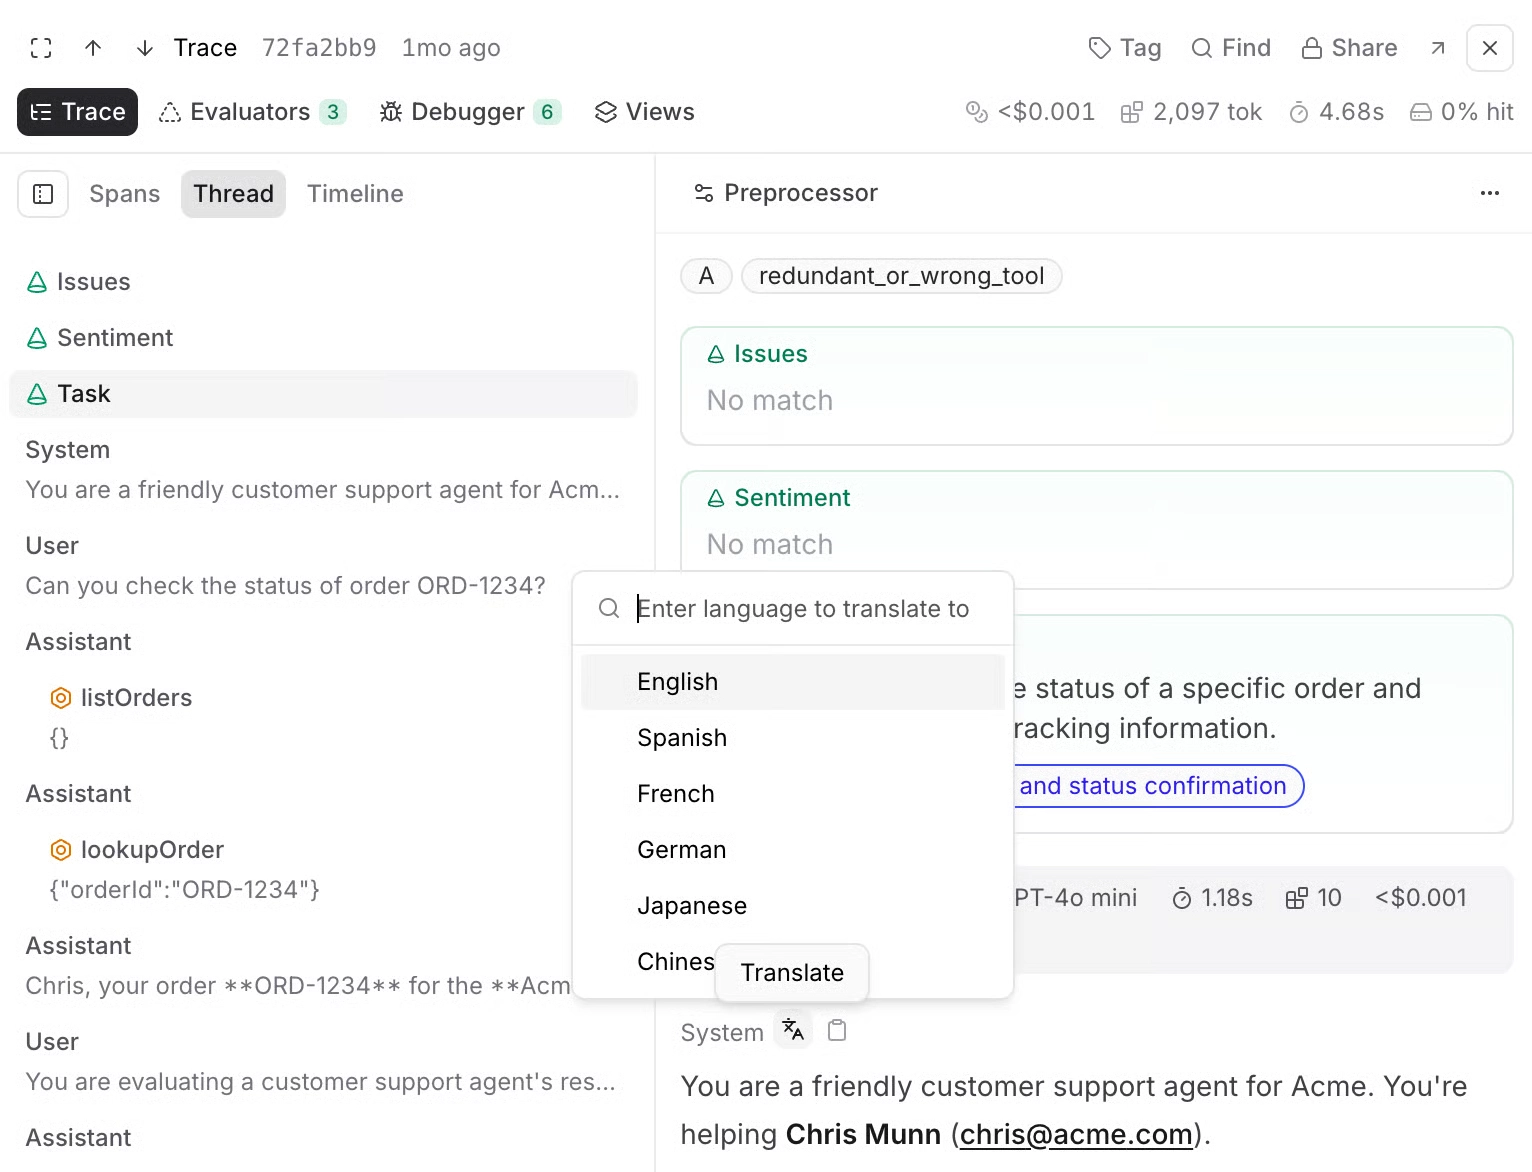
Braintrust's Thread view displays tool results alongside the agent's subsequent responses.
Braintrust's Thread view lists messages and tool calls chronologically, putting the tool response and the agent's final message side by side. A pending_review result sitting beside a cancellation confirmation shows the agent misread the returned status, even though the execution completed without raising an error.
Step 3. Confirm the action in the external system
A trace records what the billing API returned to the agent, but the subscription's actual status must be verified in the billing system. The account ID and any confirmation or transaction ID from the tool result locate the corresponding record.
For a cancellation, check whether the subscription status changed and whether the billing system recorded the cancellation. If the API reported success but the subscription remains active, the investigation must continue into the external system to determine why the expected change did not persist.
The same verification applies to other consequential actions. Refunds require confirmation from the payment provider, sent emails can be checked against delivery logs, and customer record updates should be verified in the application database.
Timing, retries, and errors in agent runs
An agent's final response may conceal execution problems that occurred earlier in the run. Examining the order and duration of recorded spans can reveal unnecessary tool calls or failed attempts that the agent recovered from before responding to the user.
Span order and latency
Braintrust's Timeline view displays each span as a bar scaled by duration and color-coded by span type. For the billing investigation, the timeline helps establish whether get_account executed before cancel_subscription and how much time each operation consumed. Engineers can also inspect overlapping spans to understand which operations ran concurrently.
An unusually long tool span identifies where the delay occurred within the recorded execution. Determining whether the underlying cause was an API timeout or slow database query may require examining the external service's logs.
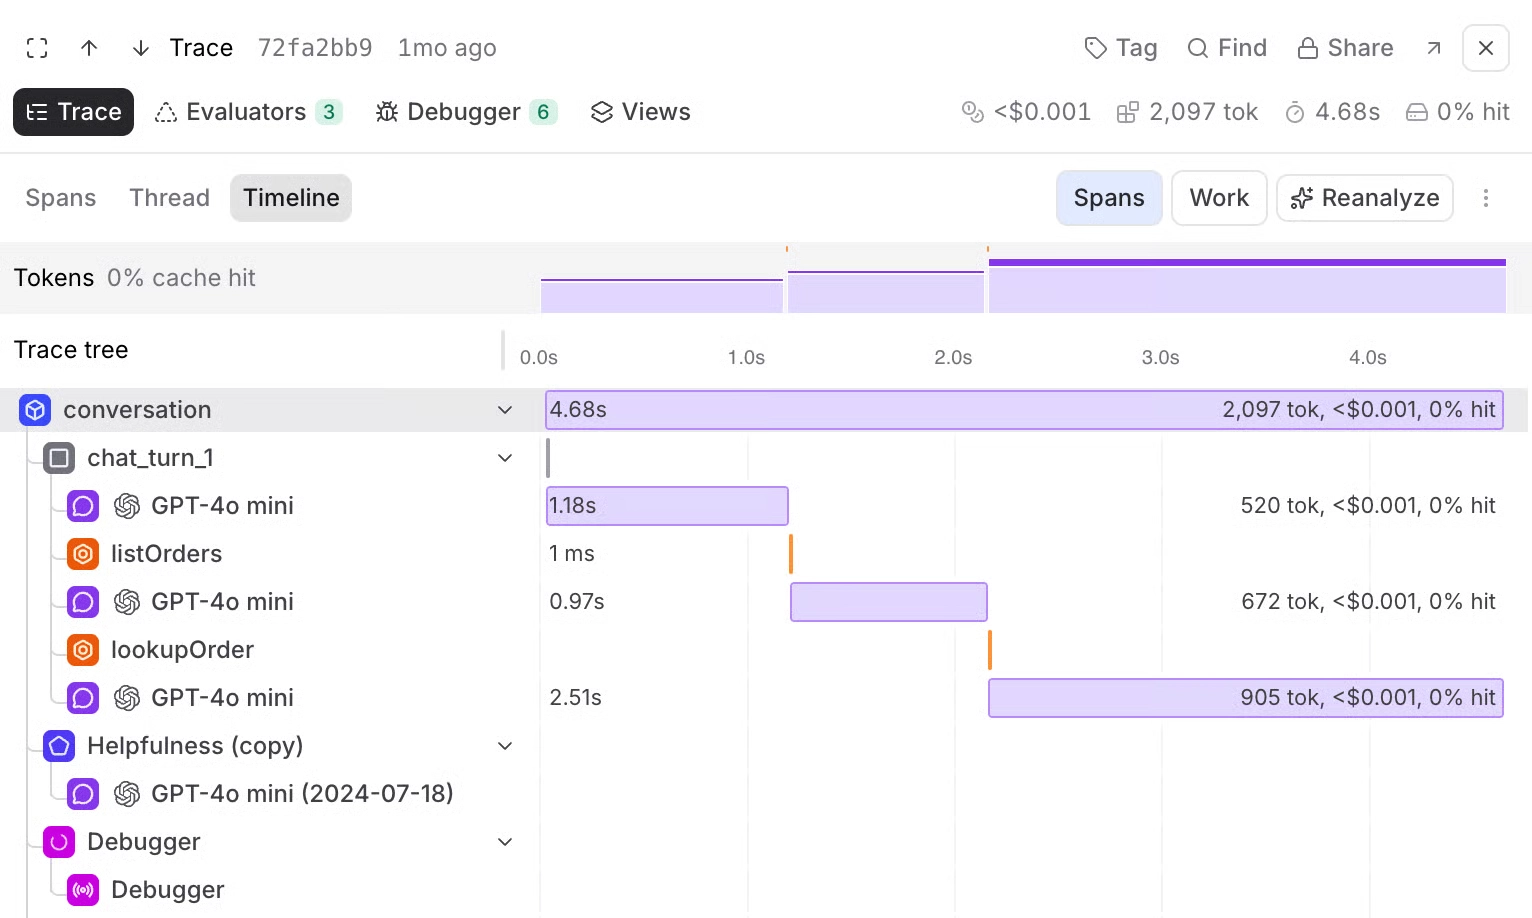
Braintrust's Timeline view shows execution order and duration across the spans in an agent run.
Repeated tool calls
Multiple calls to the same tool may indicate a retry or an agent loop. Comparing their arguments and results helps distinguish a legitimate second attempt from unnecessary repetition. Identical arguments can indicate that the agent requested information it already received, while changing arguments may reflect an attempt to find a different result.
Repeated calls carry the most risk when a tool modifies external state, because calling cancel_subscription twice could submit duplicate cancellation requests if the billing API does not enforce idempotency. Each invocation needs to be checked against how the billing system handled it.
Braintrust’s tool-call observability guide covers how to read repeated operations in more depth.
Retries and recovered errors
An agent can finish successfully even when an earlier operation failed. A cancellation request might time out on its first attempt and succeed on retry, leaving an error on the initial tool span despite a successful final response.
Braintrust shows span errors beside the inputs and outputs of the same span, so each failed attempt can be read in context. The span-filtering logic introduced earlier can also identify tool calls containing errors within otherwise successful traces.
For state-changing operations, a timeout requires additional investigation because the external service may have completed the action without returning a response. Engineers should check the billing system's records before concluding that a retry was necessary or that the first attempt failed completely.
Finding repeated agent behavior across runs
A single trace can explain a customer's cancellation complaint, but identifying the scope requires examining other production runs. Agent observability across the full production history shows whether the same incorrect confirmation reached other customers, and a targeted trace search establishes how many.
Turn one trace into a query
The investigated run provides the conditions for finding similar executions. In the billing example, the search needs to identify three recorded events:
-
Tool execution: The agent called cancel_subscription.
-
Tool result: The cancellation returned pending_review.
-
Final response: The agent told the customer their subscription was canceled.
The tool name and pending status must match within the same span. The final confirmation must then be checked against the agent's response in the corresponding trace.
Using the ANY_SPAN() pattern from earlier, combine the tool name and result in one expression so that a pending status from an unrelated operation cannot produce a false match. Spot-checking several results confirms that the response text actually claims a completed cancellation.
Count how often the behavior occurred
Once the filter identifies the relevant executions, SQL aggregation can measure their frequency over time and group results by customer. The query must count either tool calls or complete agent runs, and the choice changes the result because one execution with three cancellation attempts adds three to a per-call count.
The following query counts how many times a named span ran, grouped by day and by user. As written, it targets a span called streamChat; changing that value to cancel_subscription makes it count cancellation calls:
SELECT
  DATE(created) AS date,
  metadata.user,
  COUNT(*) AS event_count
FROM project_logs('PROJECT_ID', shape => 'spans')
WHERE created > NOW() - INTERVAL 3 day
  AND span_attributes.name = 'streamChat'
  AND metadata.user IS NOT NULL
GROUP BY DATE(created), metadata.user
ORDER BY date DESC, event_count DESC
That count includes every cancellation attempt, so an execution that retried three times contributes three rows. It also says nothing about whether the confirmation was wrong. To measure the billing failure, add the validated conditions for the pending_review result and the agent's final response, then use count_distinct(root_span_id) so that repeated attempts inside one execution register as a single affected run.
Identify affected customers and releases
Grouping confirmed matches by recorded metadata establishes the scope of the investigation. Each grouping answers a different operational question.
-
User ID: Identifies affected customers and supports targeted outreach.
-
Session or conversation ID: Distinguishes repeated attempts by one customer from incidents involving separate customers.
-
Prompt or model version: Helps determine whether the behavior appeared alongside a particular release.
Comparing affected runs with successful cancellations can reveal a more specific failure condition. For example, if incorrect confirmations consistently follow a pending_review result associated with an outstanding invoice, engineers have evidence to investigate how the agent handles pending cancellations.
Account for incomplete production records
Frequency counts are limited by the available trace data. Sampling can exclude affected runs, retention limits remove older runs, and missing instrumentation leaves certain actions unrecorded.
Investigation reports should therefore state the number of matching runs, the search period, and any known collection limitations. Customer outreach should be based on verified affected accounts, particularly when the results will trigger refunds or other consequential actions.
Also read: How to analyze AI agent usage patterns to build eval datasets
Investigate agent traces in Braintrust
Braintrust connects individual trace inspection with production-wide analysis through Brainstore. Engineers can investigate a reported agent action in the Logs interface and use the same stored records to search for related runs through the CLI or API. The following five-step workflow takes the billing cancellation complaint from an initial report to a documented finding.
Step 1. Find the affected execution
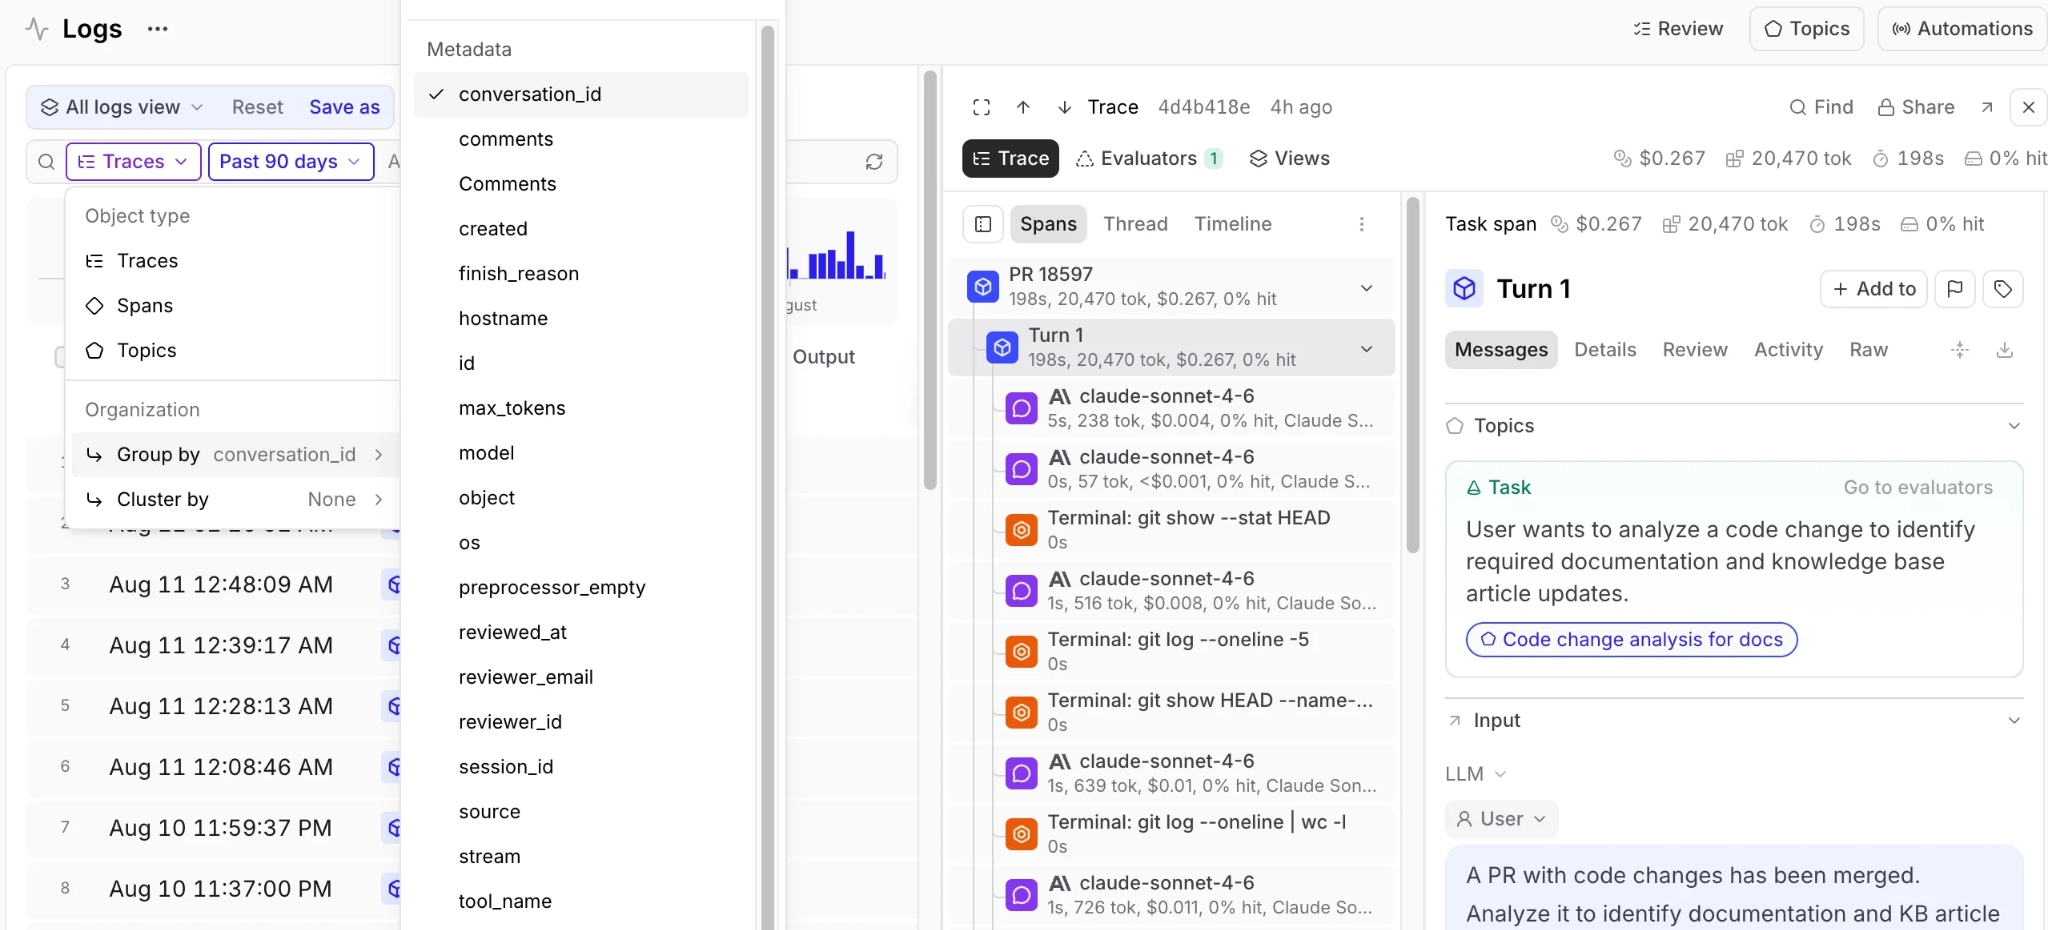
Open the project's Logs page and search using the information available from the complaint. The search field accepts full-text queries, and Basic filters narrow results by structured fields. For more specific conditions, the SQL tab includes a Generate button that converts natural-language descriptions into filter expressions.
Start with the customer's identifier and reported time, then check that the matching trace contains the disputed cancellation response.
Step 2. Examine the recorded actions
Select the matching trace and use the available layouts to inspect its execution. Spans shows the call hierarchy, Thread presents messages and tool calls chronologically, and Timeline shows how operations unfolded during the run.
Use Find with the scope set to Full trace to locate the cancellation tool and inspect its recorded arguments and result. Confirm that the trace belongs to the reported customer before drawing conclusions about the cancellation.
Step 3. Use Loop to analyze complex traces
For a lengthy execution, select Analyze trace in Timeline to have Loop organize the agent's work into sections and explain what each contributed. The analysis is saved on the trace for other team members to review.
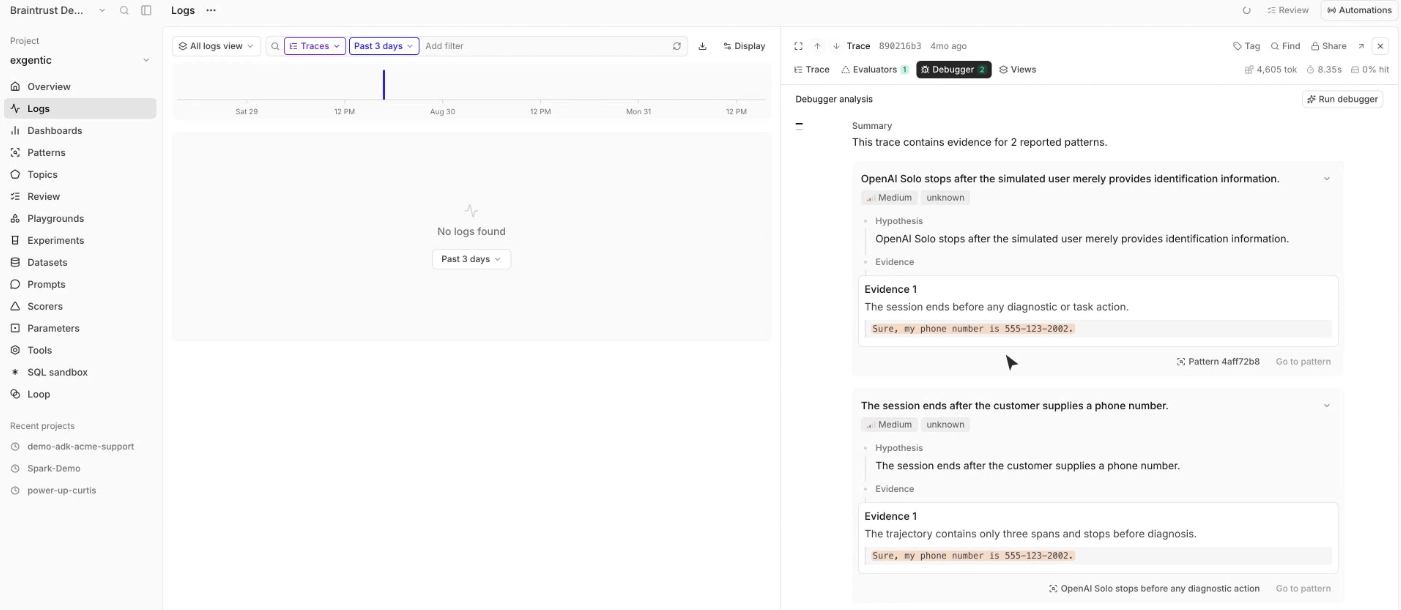
When the investigation requires a diagnosis, Debugger examines the execution and identifies possible failure modes with supporting trace evidence. Its explanations still need to be checked against the recorded tool results and any relevant external records.
Step 4. Extend the investigation across production
Once the cancellation failure is understood, use the validated search conditions to locate similar runs. The same SQL queries can run through bt sql in the terminal or the /btql API, which supports JSON and Parquet output for further analysis.
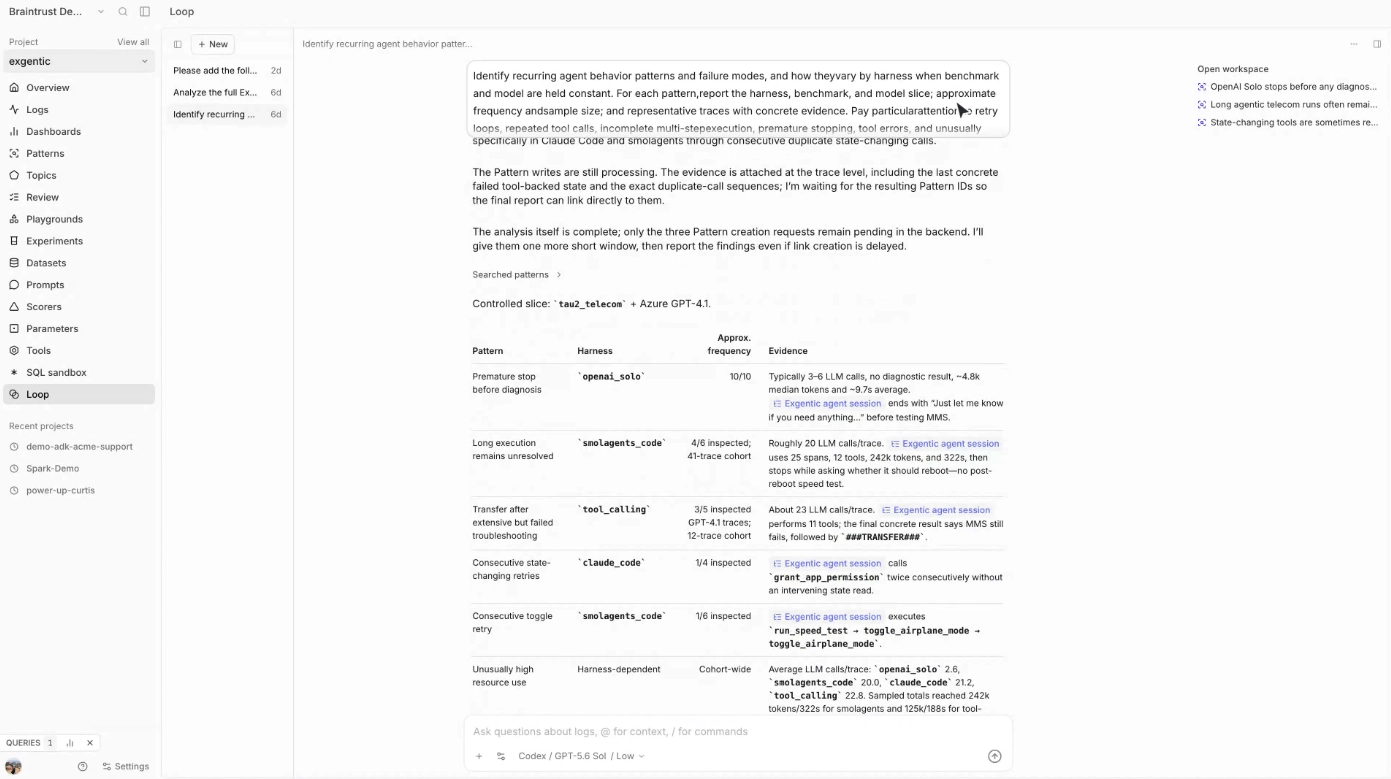
Select a representative trace and use Loop's Find similar traces to surface runs that share its characteristics. Review the returned results to confirm that they represent the same failure before including them in the incident count.
Step 5. Save and share the investigation
Save the confirmed filters and relevant columns as a custom table view so other project members can access the same results. Frequently queried metadata fields can also be configured for subfield indexing to improve retrieval performance.
The saved view provides support and engineering with a shared set of affected runs for reviewing the incident. Individual trace links preserve access to the evidence behind each finding.
How Retool investigates agent behavior with Braintrust
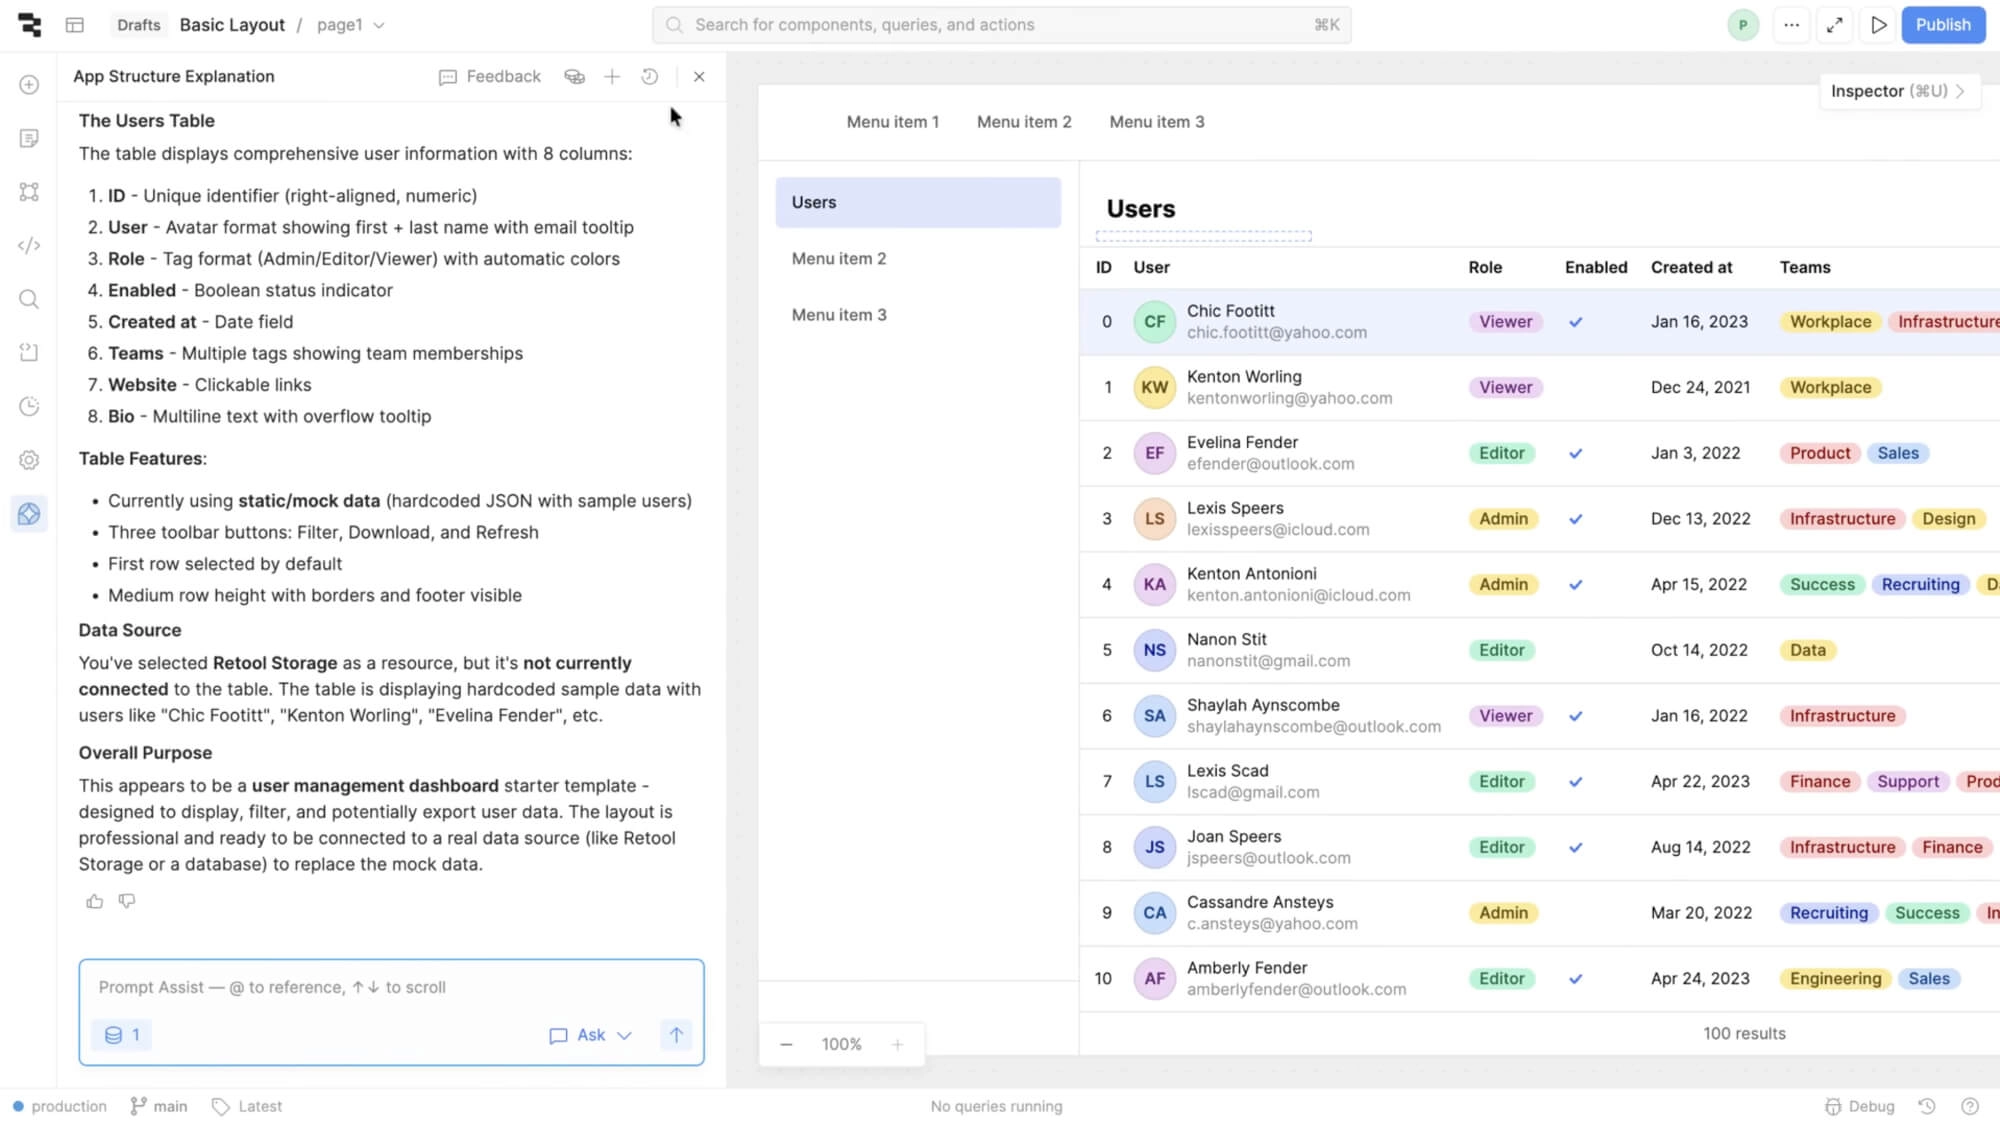
Retool uses Braintrust and Loop to investigate production issues in its AI development assistant. When customers reported that the agent claimed to have completed tasks it had never finished, Retool used Loop to identify a recurring cause: missing tool definitions prevented the agent from performing certain actions. Retool fixed the missing definitions within hours.
Start free with Braintrust to investigate agent actions and identify recurring production failures.
FAQs: how to trace what your AI agent actually did (2026)
How is investigating agent traces different from debugging a failed trace?
Debugging typically begins with a known error and focuses on identifying its cause. Investigating agent behavior can begin with a customer complaint even when the execution completed successfully. The investigator must establish what occurred and determine whether similar behavior affected other runs. Confirmed failures can subsequently become regression evaluation cases to check whether future changes reintroduce the problem.
Can an agent trace prove an action happened in an external system?
A trace can establish that the agent invoked a tool and record the response it received, but an API success response does not guarantee that the external system retained the intended change. For consequential actions such as payments or subscription cancellations, verify the transaction or confirmation ID against the system of record.
What metadata makes agent traces easier to search?
User and session IDs identify the affected customer and separate one interaction from another. Environment and prompt or model versions tie a behavior to the deployment that produced it, and trace IDs give support tickets and application logs an exact execution to reference. Record all of these as structured fields so filters and groupings return consistent results.
How far back can I search production agent traces?
Searchable history depends on the project's retention configuration. Braintrust enforces retention limits across its query interfaces, and expired records can disappear from results without an explicit error. For investigations that may arise beyond the active retention period, establish a suitable retention policy and archive important traces before they expire.
Can I search agent traces without writing SQL?
Braintrust provides full-text search and point-and-click filters for locating executions through the Logs interface. For more specific investigations, the SQL tab can generate filter expressions from natural-language descriptions. Loop also supports natural-language questions about recorded behavior and can find traces similar to selected examples, letting team members investigate production issues without manually building every query.