

A prompt can pass pre-release evaluations and still regress after deployment. Production traffic introduces new input patterns, retrieved context changes, evolving model behavior, and tool definitions that can change even when the prompt text stays exactly the same. Without version-level monitoring, you may see a quality drop without knowing which prompt configuration caused it.
Reliable prompt monitoring starts by attaching the prompt version to production traces, scoring representative live traffic, and establishing a baseline for the version currently serving users. Comparisons should use matched traffic segments and sustained measurement windows so teams can separate genuine regressions from changes in traffic mix or normal variation.
This guide explains how to instrument prompt versions, choose production signals, establish baselines, segment and investigate regressions, convert confirmed failures into evaluation cases, and use production evidence to make rollout and rollback decisions. Braintrust keeps each deployed prompt version tied to the production traces and scores it generated, so teams can trace a regression back to the exact configuration and turn confirmed failures into evaluation cases for the next release. Start free with Braintrust.
Why prompt performance changes after deployment
Pre-release evaluation tests a prompt against a controlled dataset. Production exposes the same prompt to inputs, retrieved context, models, tools, and usage patterns that continue changing after launch, so performance can decline even when the prompt text stays unchanged.
Input distribution changes: New customers, locales, and use cases introduce requests that may not exist in the original evaluation set. A summarization prompt validated on short support tickets, for example, may behave differently when users begin submitting long contracts, structured data, or multi-part requests.
Retrieved context changes: Applications that assemble prompts at runtime can send different context even when the stored template stays the same. Re-indexing a knowledge base, updating source documents, or changing retrieval and chunking settings can alter what reaches the model.
Models and provider behavior change: Model migrations, checkpoint updates, parameter changes, and provider defaults can affect output quality, formatting, refusal behavior, or tool use. Tracking performance by prompt version and model configuration lets you separate a prompt regression from a model-side change.
Tool definitions and schemas change: Agents use tool descriptions and schemas to decide which tool to call and how to construct its arguments. Renaming a parameter, changing a description, or introducing a tool with overlapping functionality can alter agent behavior without any corresponding prompt edit.
User behavior changes: Production usage evolves as people become more familiar with a feature. Longer requests, new document formats, different languages, and more complex tasks can expose failure patterns that were absent from the original evaluation dataset.
Prompt evaluation measures quality against known cases before release, prompt versioning records how the prompt changes between iterations, and LLM monitoring measures application behavior under live traffic. Version-level production monitoring connects those pre-release results and prompt changes with live traces, making it possible to determine whether a regression came from the prompt, model, retrieved context, tools, or the traffic reaching the application.
Attach prompt identity and version metadata to production traces
Every comparison later in the monitoring workflow depends on knowing which prompt configuration produced each output. A trace that records the model, latency, and cost without the prompt slug and version can show performance changed, but it cannot isolate the prompt configuration responsible.
Fields every prompt trace should carry
| Field | What it isolates |
|---|---|
| Prompt slug | The prompt under review, consistent across all versions |
| Prompt version | The exact prompt configuration that produced the output |
| Model and parameters | Separates model or configuration changes from prompt changes |
| Environment | Keeps development and staging traffic out of production comparisons |
| Feature or surface | Identifies the product area affected by a regression |
| Customer or tier | Shows which accounts or customer groups experience the change |
| Task type | Separates different workloads that use the same prompt |
| Input source | Distinguishes traffic such as typed queries, pasted documents, and API requests |
Pin and record the version in code
Every prompt change in Braintrust creates a new version. loadPrompt() can retrieve a prompt by slug, pin a specific version, or load the version assigned to an environment, giving production traces a clear version boundary for later comparisons.
const logger = initLogger({ projectName: "My Project" });
const client = wrapOpenAI(new OpenAI());

async function runPrompt() {
  const prompt = await loadPrompt({
    projectName: "My Project",
    slug: "summarizer",
    defaults: {
      model: "gpt-5-mini",
    },
  });

  const { messages, ...parameters } = prompt.build({
    text: "Article to summarize...",
  });

  return client.responses.create({
    ...parameters,
    input: messages,
  });
}
For a staged rollout or controlled comparison, pin the version so all traffic under measurement runs the same prompt configuration:
const prompt = await loadPrompt({
  projectName: "My Project",
  slug: "summarizer",
  version: "5878bd218351fb8e",
});
Sending the output of prompt.build() through a wrapped client is what makes that version visible later: the wrapper reads the prompt metadata from build() and attaches it to the LLM span. A hard-coded prompt, or one sent without the loadPrompt() workflow, produces a span with no prompt metadata and shows no origin prompt in the UI.
Braintrust traces therefore retain the origin prompt and version, and the trace menu offers Go to origin prompt for moving from a failing trace back to the prompt that produced it. Applications that construct prompts outside Braintrust should record the same identity explicitly as structured metadata, using consistent fields such as prompt_slug and prompt_version on the root span.
Keep metadata fields consistent across services
Version comparisons become unreliable when different services record the same value under different keys, such as promptVersion in one service and prompt_version in another. Define the field names and value formats before production traffic is logged, then apply them consistently across every service that calls a model.
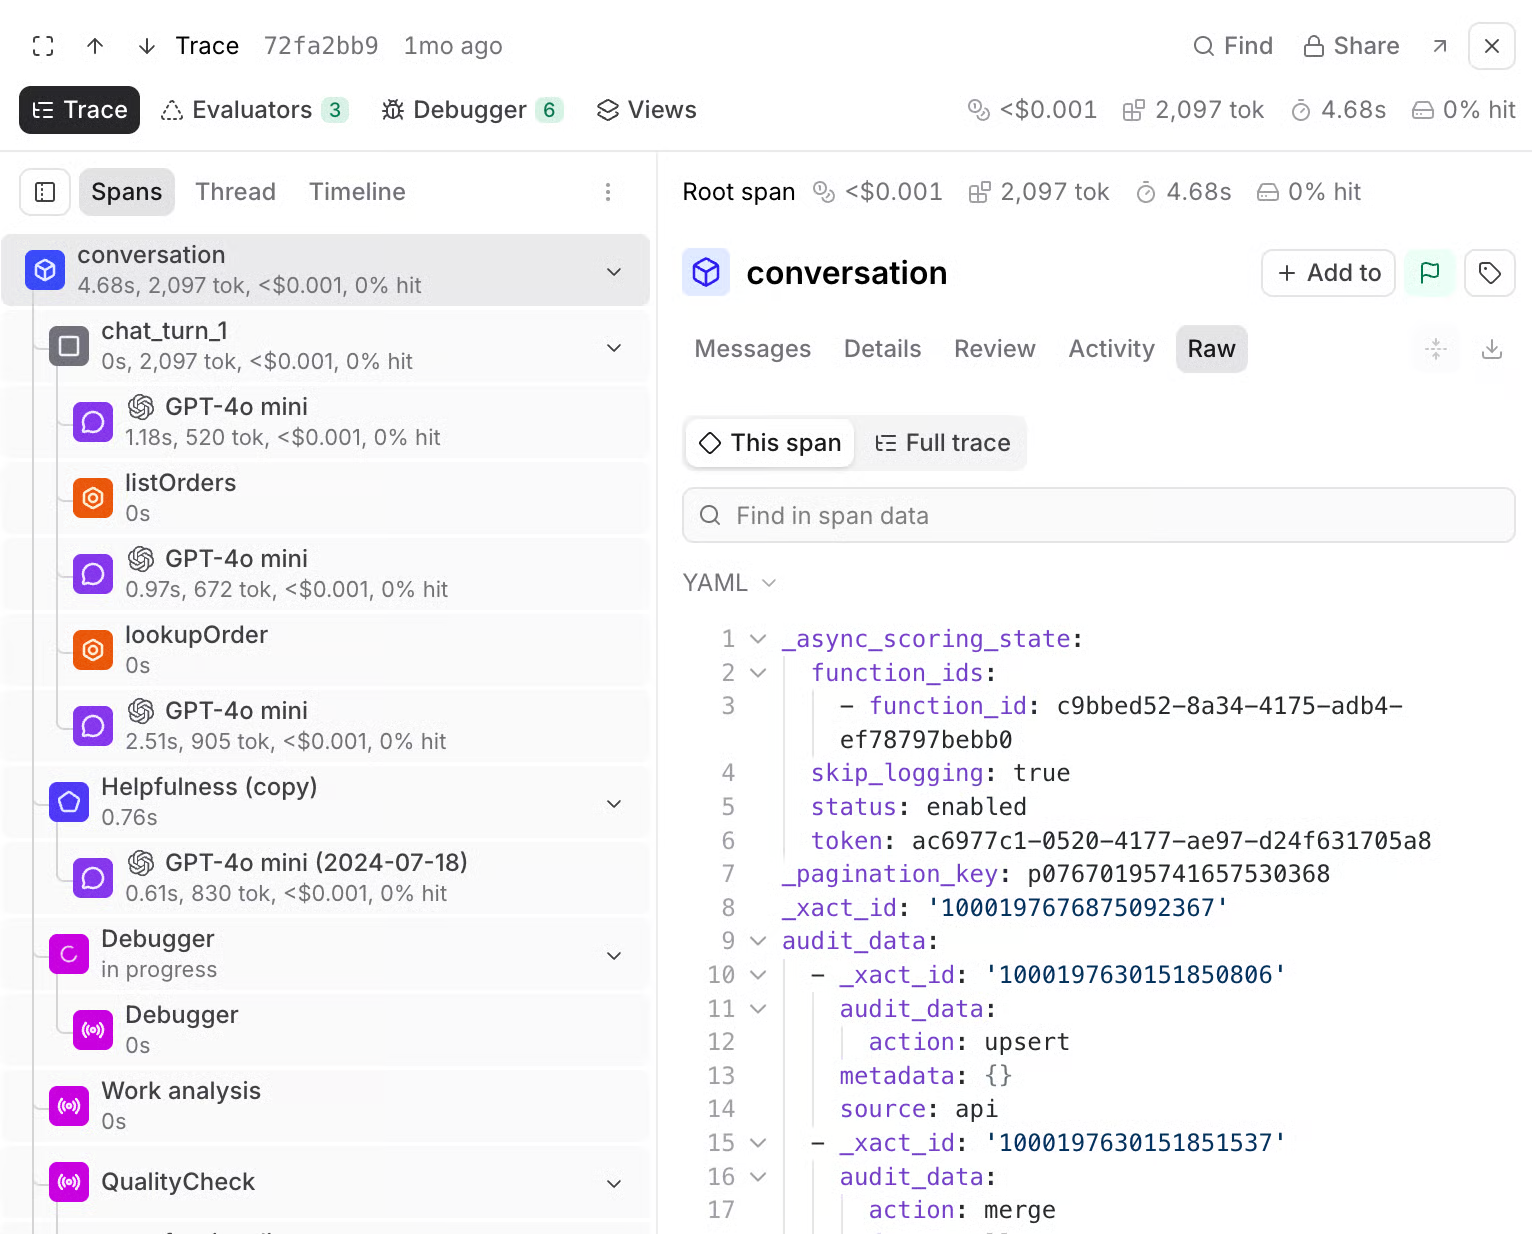
The Raw view exposes the structured span record, including the metadata fields that version comparisons depend on.
For fields used frequently in filters, Braintrust supports subfield indexes, and subfield paths must start with input, output, expected, metadata, or span_attributes. Indexing fields such as metadata.prompt_version keeps version-level filtering responsive as production trace volume grows.
Also read: Deploy prompts and Filter and search logs.
Select the prompt performance signals worth monitoring
Monitor signals that help determine whether a deployed prompt version is still producing acceptable results under live traffic. The goal is to cover both output quality and the operational changes that can accompany a prompt release without creating a dashboard full of metrics nobody acts on.
| Signal | What a change indicates |
|---|---|
| Quality scores | The released version is producing worse answers on live requests than it did on the evaluation set |
| Output format and required fields | Structured responses are failing validation downstream, often after a template or model change |
| Refusals and safety blocks | The prompt has become more restrictive, or new inputs are triggering guardrails |
| Latency percentiles | Added instructions or longer generations are slowing the tail of production requests |
| Token usage and cost | The new version consumes more context or produces longer outputs per request |
| User feedback | Users are reporting problems no existing scorer was written to detect |
Braintrust can score production traces asynchronously, which keeps evaluation work off the user-facing request path. Scope the scorer to the behavior being measured: use a span-level scorer for an individual model or tool output, and a trace-level scorer when success depends on the complete request.
For subjective criteria such as factuality or grounding, LLM-as-a-judge scorers apply one consistent rubric across sampled production traffic. Deterministic checks work better for conditions such as refusal patterns or required output fields, and user feedback surfaces problems no scorer was written to detect.
Establish a baseline for the deployed prompt version
Compare a candidate prompt version against production performance from the version already serving users. Build the baseline from a window that captures a complete traffic cycle, including recurring variations such as weekday and weekend usage, business hours, batch jobs, or month-end processing. A short window that excludes predictable traffic patterns can make normal variation look like a regression.
Capture the full distribution for each signal so the baseline reflects both typical performance and tail failures.
For latency, record the median, p95, and p99.
For quality, keep the score distribution together with the share of traces that fall below the acceptable threshold.
For cost, track at least the median and p95 per request.
Recording tail values alongside medians makes smaller regressions visible even when the overall average remains stable.
Sampling also needs to produce enough scored traces inside every segment being compared. Braintrust recommends sampling 1% to 10% of traffic for high-volume applications and 50% to 100% for low-volume or critical workloads, but the percentage alone does not determine whether the comparison is reliable. Check the number of scored traces inside each segment and measurement window, since a 5% sample of a small customer tier or task type may still leave too little evidence to interpret confidently.
Record the baseline separately from the underlying log query so the reference remains available after the original traces expire. Braintrust's data retention limits include 14 days on Starter and 30 days on Pro, so teams comparing prompt versions across longer intervals should save the baseline metrics, segment definitions, and trace counts before the source logs age out.
| What to record | Purpose |
|---|---|
| Version identifier | Ties the baseline to one prompt configuration |
| Date range and trace count | Shows how much production evidence supports the baseline |
| Segment definition | Keeps later comparisons within the same traffic population |
| Median and tail values for each signal | Provides the reference values for the next candidate |
| Known exclusions | Removes load tests, backfills, incidents, and other traffic that could distort the comparison |
| Owner and approval date | Records who approved the baseline and when |
After a new version reaches full traffic and maintains acceptable performance across a complete traffic cycle, use its production measurements as the baseline for the next release. Updating the reference after every promotion prevents several individually acceptable releases from accumulating into a gradual decline.
Set sampling, percentiles, and alert conditions for prompt signals
Measurement window: Once a production baseline is established, decide how much evidence each comparison needs before a change is treated as meaningful. The window should contain enough scored traces to represent the prompt version and segment being monitored, so lower-volume customer groups or task types may need a longer window or higher sampling rate before a percentile or quality threshold becomes reliable.
Percentile thresholds: Percentiles make regressions in the tail easier to detect because a small number of severely delayed or low-quality requests may barely affect the overall average. Compare p95 or p99 values against the deployed version's baseline, then set thresholds around changes large enough to affect users or violate an established quality target.
Sustained conditions: A threshold should persist long enough to rule out temporary noise. One poor window can result from a small sample, an unusually difficult batch of requests, or a short provider issue, so evaluate the condition only after a minimum trace count is reached or require the threshold to be breached across consecutive windows. Sustained conditions reduce unnecessary alerts without hiding regressions that continue affecting production traffic.
Alert scope: Scope each alert to the prompt version and segment being monitored. Braintrust log alerts evaluate individual records with a SQL filter, so teams can filter by prompt slug, version, environment, customer, or other metadata and open the traces associated with the affected configuration. Per-row thresholds are noisy for aggregate questions, so where the alert type is available, a Time window alert computes a scalar SQL calculation over a window and compares it to a threshold, with settings for window length, trigger delay, late-data handling, recovery notifications, and renotification. See Alerting on scorer errors and aggregated scores for the configuration details and the scheduled-SQL fallback when Time window alerts are not available in a deployment.
Segment prompt metrics by model, feature, environment, and customer
Aggregate metrics can hide regressions that affect only one part of production traffic. A support prompt serving 40,000 daily requests at 0.91 factuality, for example, can absorb 600 enterprise requests scoring 0.62 with only a small change in the blended score, even though those enterprise requests are performing substantially worse. Segmenting the data shows where the regression is concentrated before the overall metric moves enough to trigger concern.
| Segment | Question it answers |
|---|---|
| Model and parameters | Did a model or configuration change produce the regression? |
| Feature or surface | Is one product area affected while others remain stable? |
| Environment | Is the change present in production, staging, or both? |
| Customer or tier | Which accounts or customer groups experience the regression? |
| Task type | Is one workload failing within a prompt used for several tasks? |
| Input pattern | Does the failure correlate with input length, language, format, or source? |
Match the traffic being compared: Compare candidate and baseline versions within the same segment, measurement window, and traffic mix. If a candidate receives mostly enterprise traffic and the baseline served a broader mix of requests, the score difference may come from the workloads each version handled. Holding those variables constant isolates the prompt version as the one thing that differs between the two sets of traces.
Filter to the affected segment: Metadata recorded on production traces can narrow the comparison to the specific segment showing the regression. For example, the following filter limits the traces to production requests using gpt-5-mini:
metadata.environment = "production" AND metadata.model = "gpt-5-mini"
Add prompt version, customer tier, task type, or other metadata fields to the filter until it isolates the traffic segment where performance changed, then compare that segment across the deployed and candidate versions.
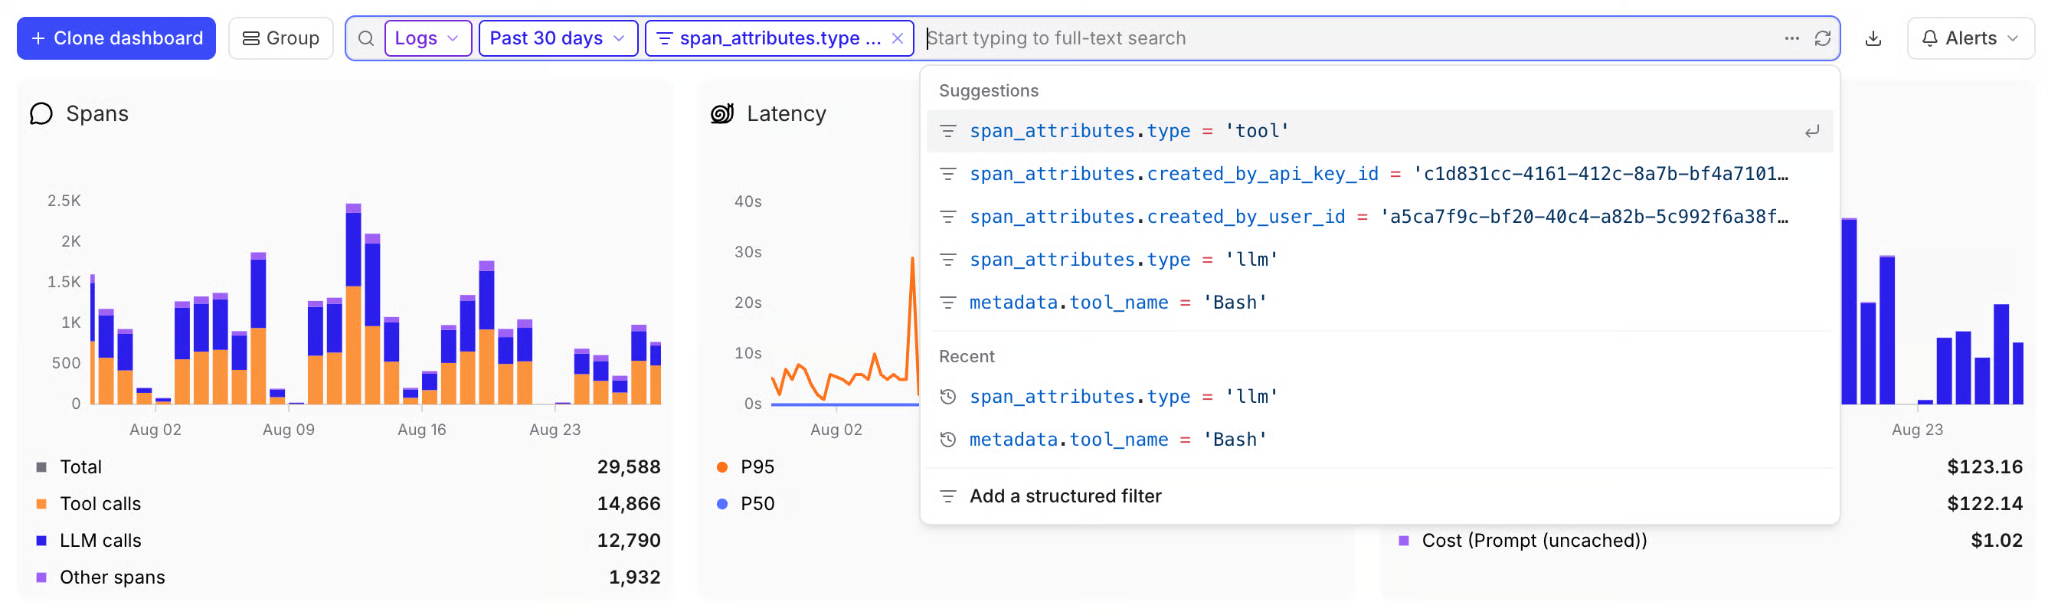
Structured filters narrow a dashboard to one traffic segment using the same metadata fields recorded on production traces.
Track segment performance over time: Braintrust dashboards can group and chart the same metadata fields used for filtering, keeping version-level quality, latency, and cost visible across releases. Teams can then move from a change in a segmented metric to the traces behind it without rebuilding the comparison manually. The built-in Cost and quality dashboard is available on every plan, while custom charts with their own group-by dimensions require Pro or Enterprise.
Investigate a prompt regression from aggregate signal to failing traces
A sustained regression signal becomes actionable only once you trace it back to the specific requests and execution steps that changed.
1. Confirm the timing and prompt version: Identify when the signal first moved and which prompt version was serving traffic at that point. Compare the timing with prompt promotions, model changes, retrieval updates, and tool deployments so the regression is not attributed to the prompt before other changes are ruled out.
2. Hold the segment constant: Compare the deployed and previous versions within the customer tier, language, task type, model, or input pattern where performance declined. If the score still moves once the traffic is held constant, the prompt version is the likely cause; if it stops moving, the traffic each version received was driving the score.
3. Filter to the failing traces: Combine the prompt version, environment, affected segment, time range, and score threshold in one filter. The resulting traces provide the production examples needed for investigation without mixing in requests that continued to perform normally.
4. Find where execution first failed: Open representative traces and follow the spans until the behavior first diverges from the expected result. Braintrust's trace viewer exposes the inputs, outputs, timing, metadata, and span hierarchy for the request, which helps separate failures caused by retrieval, tool execution, model output, or the prompt itself.
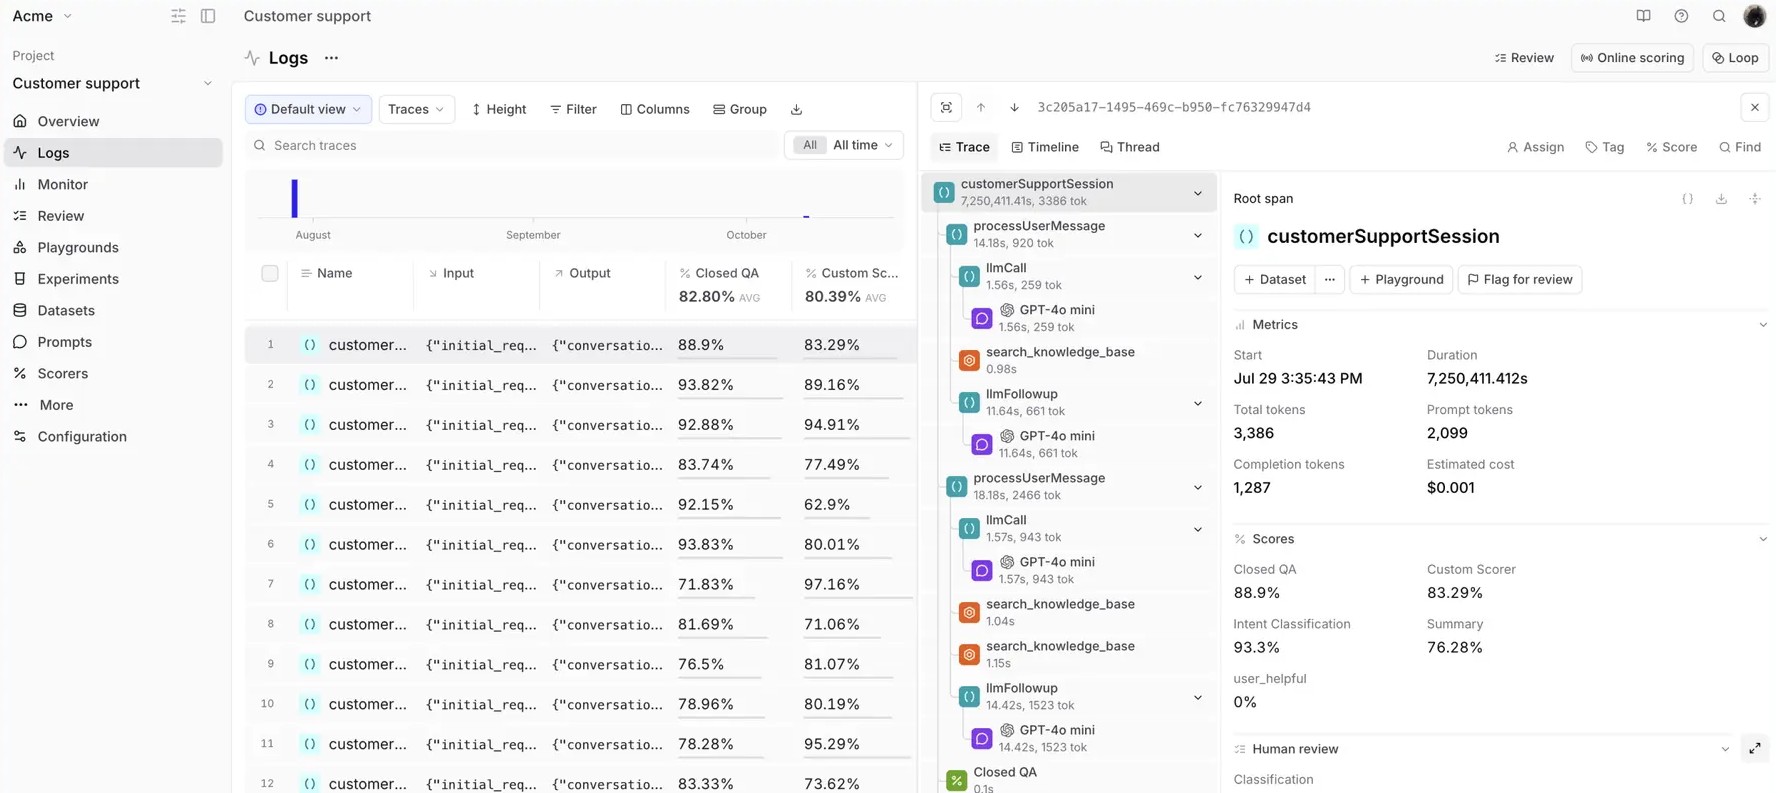
Scores on the Logs table lead to the trace behind them, where the span hierarchy shows which step first diverged.
5. Identify the shared input pattern: Compare failing traces with successful traces from the same segment and look for characteristics that consistently separate them. Failures may cluster around long inputs, a specific language or document format, a single customer workflow, or another pattern missing from the original evaluation set.
6. Test whether the prompt change caused the failure: Review the version history to see what changed, then run representative failing inputs against the previous and current prompt versions in the Braintrust playground. If the previous version succeeds on the same inputs and the current version fails, the prompt change becomes the primary cause to investigate. If both versions fail, check the model, retrieved context, tools, or other application changes before revising the prompt.
Convert failing production traces into prompt evaluation cases
Once you confirm a production regression, preserve it as evaluation coverage for future prompt changes.
Capture the production input: Add the reviewed trace to a versioned dataset and keep the template variables that produced the prompt alongside the rendered input. Preserving both makes the test reusable even if the prompt template changes later. Braintrust can build datasets from reviewed production traces, so confirmed failures can move directly from Logs into repeatable evaluations.
Define the expected behavior: Store the approved response or outcome in expected when a clear reference exists, and keep the failed production output and supporting context in metadata. Storing the two separately gives the scorer a concrete success condition while preserving the evidence that explains the original regression.
Cover the failure pattern: One production request may represent a broader class of failures. Add a small set of variations that preserve the same underlying pattern, such as different input lengths, document formats, or phrasing, so the evaluation checks whether the fix generalizes beyond the original trace.
Test the fix against existing behavior: Run the candidate prompt against the new production-derived cases together with the existing evaluation dataset. The comparison should confirm that the regression is fixed without lowering established quality scores elsewhere in the prompt's workload.
Carry the failure into future releases: Once the new cases reliably detect the regression, include them in the evaluation suite that runs before promotion. Braintrust evaluations can run in CI/CD, which turns confirmed production failures into release checks that future prompt versions must clear.
Braintrust's guide to turning production failures into regression tests covers the broader process for preserving failure context, creating regression datasets, and maintaining that coverage across releases.
Roll out and roll back prompt versions with production evidence
Production performance should determine whether a candidate prompt continues receiving more traffic or returns to the previous validated version.
Hold each stage through representative traffic: Keep the candidate at each traffic level until it has served enough of the normal production cycle to support a decision. A few quiet hours may exclude weekend traffic, scheduled batch workloads, or customer segments that appear at different points in the week.
Promote only when live performance holds: Compare the candidate against the current production baseline within matched segments. If quality, latency, cost, or another release criterion falls outside the accepted range, stop the rollout and investigate before increasing traffic.
Roll back to a known prompt version: Braintrust environments can keep a validated prompt version assigned to production while newer versions move through development and staging. If a candidate fails its rollout criteria, reassign the previous version to production or pin that version directly.
// Load from a specific environment
const prompt = await loadPrompt({
  projectName: "My Project",
  slug: "my-prompt",
  environment: "production",
});
Loading the prompt from the production environment keeps the application aligned with the version approved to serve users, so version changes don't require reconstructing prompt text in application code.
Monitor prompt versions in Braintrust
Braintrust connects versioned prompts and environments with production traces, so teams can measure how the prompt version assigned to production performs on live requests. Prompt history records the text, parameters, and other changes between versions, and production traces capture the inputs, outputs, token usage, cost, timing, metadata, and span hierarchy needed to investigate a regression.
Production traces associated with each prompt version can be filtered and grouped by model, feature, customer, task type, score, or other metadata, and dashboards track those segments over time. Online scoring applies the same scorers used during pre-release evaluation to sampled production traffic, and confirmed production failures move into datasets for testing in playgrounds and experiments before the next release. Braintrust's GitHub Action runs the prompt evaluation suite on pull requests, checking new prompt changes against existing regression cases and scoring thresholds before promotion.
Teams at Notion, Stripe, Zapier, Vercel, and Ramp use Braintrust to evaluate and monitor production AI systems. Start free with Braintrust and monitor prompt performance from evaluation through production.
FAQs: Monitoring prompt performance in production
What does prompt monitoring track that LLM monitoring does not?
LLM monitoring shows how the application is performing across model calls, retrieval, tools, latency, and cost. Prompt monitoring adds version-level attribution to check whether a quality or operational change appeared with a specific prompt release and which production requests were affected.
What gives product managers visibility into prompt performance, cost, and quality?
Product managers need production traces that carry prompt-version metadata together with quality scores, latency, token usage, cost, and user feedback. Braintrust can surface those signals by prompt version and product segment, giving product teams a way to compare releases and inspect examples behind a metric change without working through application code.
How do you capture token usage and latency for LLM outputs without adding overhead?
Token counts and model timing can be recorded from the model call through wrapped clients or automatic instrumentation, so collecting those metrics does not require an additional evaluation request on the user-facing path. Quality scorers can then run asynchronously after the trace is logged, with sampling used to control how much production traffic gets scored.
How many production traces need scoring to detect a prompt regression?
Detection depends on how many scored traces exist inside the specific segment and comparison window being evaluated, so the same sampling percentage can be enough for a high-volume prompt and far too thin for a niche one. A few hundred scored traces can provide a useful read for a meaningful quality change, while lower-volume segments may need higher sampling rates or a longer measurement window before the comparison is reliable.
How does monitoring a deployed prompt differ from evaluating it before release?
Use the same scoring criteria in both stages so pre-release results can be compared directly with observed production performance. Pre-release evaluation scores a candidate against a fixed set of known cases, while production monitoring scores the released version against live requests whose inputs, retrieved context, model behavior, and tool behavior keep shifting after launch.
When should a prompt version be rolled back?
A rollback is justified when a sustained regression affects an important production segment and the timing aligns with the prompt release. If the evidence points to a model update, retrieval change, or tool failure, correcting that component is more appropriate because reverting the prompt would leave the cause untouched. When users are actively affected and the previous prompt version is known to perform reliably, restoring that version first limits further impact and leaves the failed-version traces available for diagnosis.